Saltwater Pool vs Chlorine: 10-Year Costs, Water Chemistry and How Common Salt Pools Are (2026 Data)
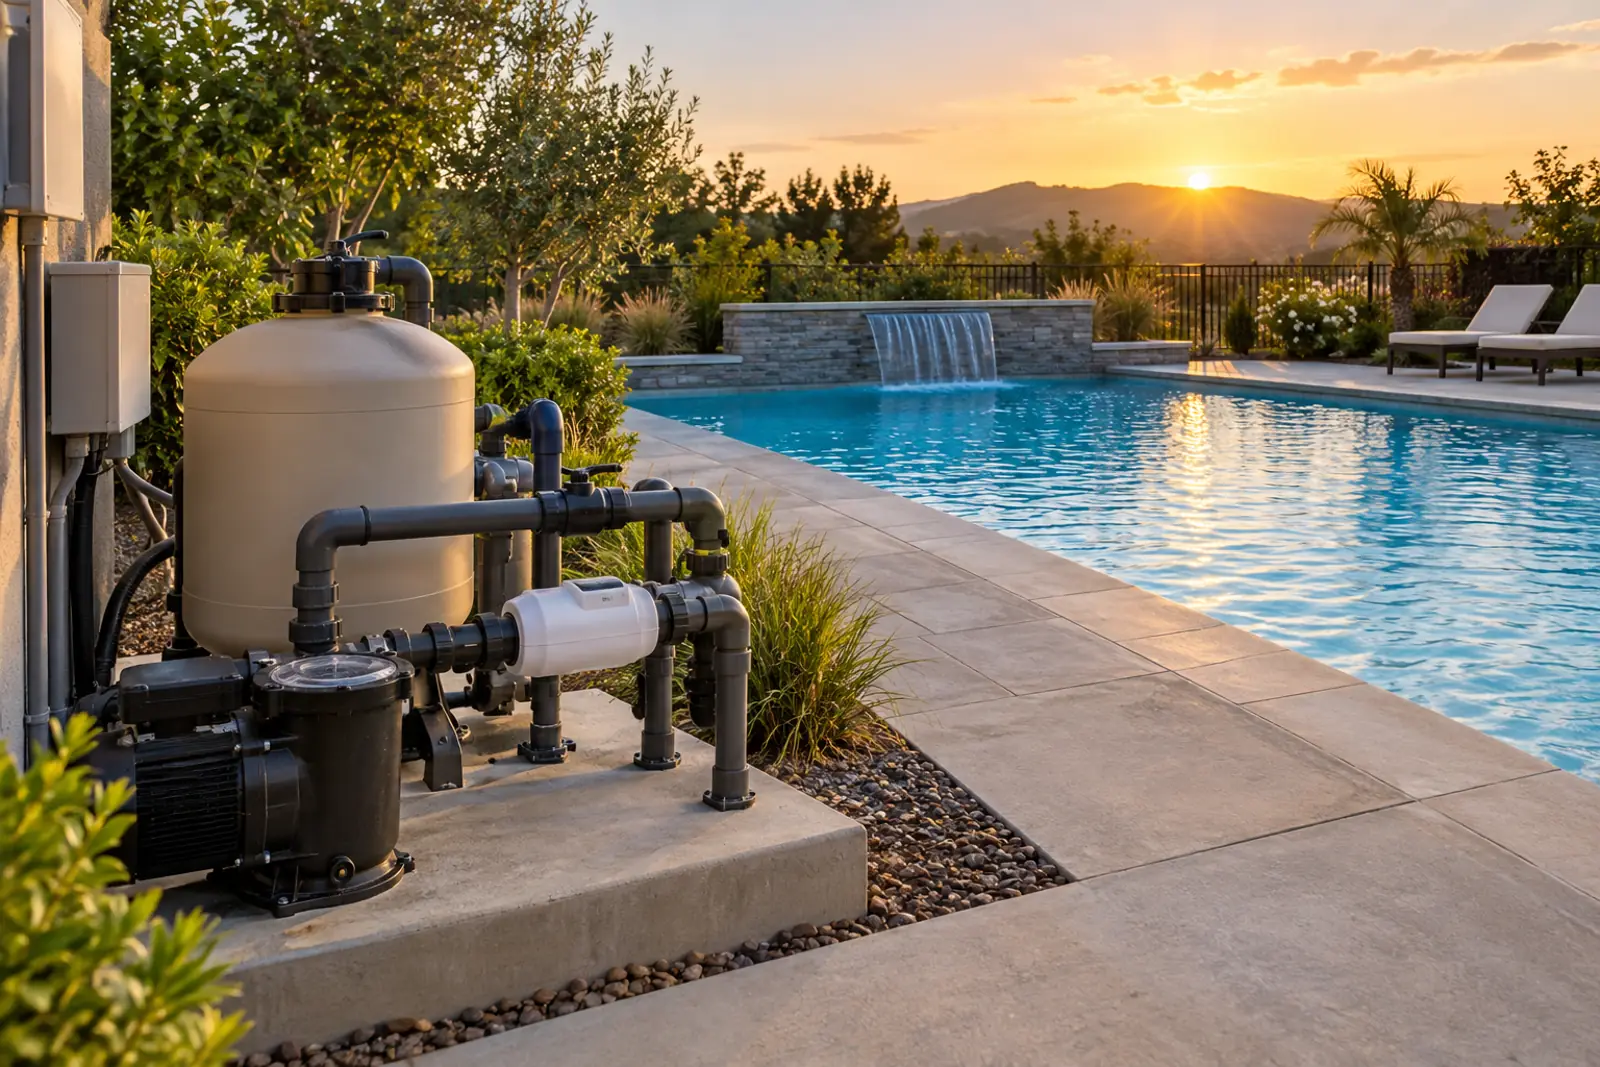
Saltwater pool vs chlorine, using 2026 US data: both are chlorine pools, because a salt cell makes chlorine from dissolved salt. For a 20,000-gallon year-round pool, 10-year sanitizer costs are close ($4,204 salt vs $4,106 tablets). In 4-month seasons tablets stay cheaper. Only 6.4% of detailed Airbnb pool listings say saltwater.
Saltwater pool vs chlorine at a glance: what differs and what does not
A saltwater pool is a chlorine pool with an on-site chlorine maker. The free chlorine target, the germ-killing chemistry and the twice-daily testing advice are the same; what changes is where the chlorine comes from, what else ends up in the water, and which parts wear out.
Mahoning County Public Health states that salt pools are still sanitized using chlorine, made by a salt chlorine generator from salt dissolved in the water (Mahoning County Public Health). The CDC 2024 Model Aquatic Health Code describes in-line generators that use pool-grade salt to produce chlorine through an electrolytic chamber (CDC MAHC 2024).
CDC recommends at least 1 ppm free chlorine for home pools, or at least 2 ppm when cyanuric acid is present, and testing chlorine and pH at least twice a day (CDC). The CDC page sets no separate targets for salt pools.
| Topic | Salt chlorine generator pool | Traditional chlorine pool | Source | Fact rows |
|---|---|---|---|---|
| What disinfects the water | Chlorine, made in the cell from dissolved salt by electrolysis | Chlorine, added as tablets, liquid or granules | Mahoning County Public Health; CDC MAHC 2024 | #52, #38 |
| Free chlorine target (CDC, home pools) | At least 1 ppm; at least 2 ppm with cyanuric acid | At least 1 ppm; at least 2 ppm with cyanuric acid | CDC | #43 |
| Salt level kept in the water | 2,700 to 3,400 ppm (Hayward ideal range) | None | Hayward | #56 |
| Salt level compared with seawater | About 9.1% of seawater: 3,200 ppm vs 35,000 ppm | None | Hayward; USGS | #58, #97 |
| pH drift | Rises as chlorine is generated; acid additions needed | Not quantified in sources reviewed | Mahoning County Public Health | #54 |
| Stabilizer (cyanuric acid) source | Added separately (Hayward 60 to 80 ppm) | Built into trichlor tablets: 0.56 lb of cyanuric acid per lb of trichlor, and it accumulates | Hayward; PubChem (PC&S calculation) | #56, #96 |
| EPA status | Generator alone: generally a device, no registration; sold with salt: a pesticide that must be registered | Required: chlorine products carry an EPA registration number | U.S. EPA; EPA product labels | #48, #49, #71 |
| Public pool code (MAHC 2024) | Permitted; EPA establishment number required; salt tested weekly | Permitted; cyanuric acid capped at 90 ppm | CDC MAHC 2024 | #38, #39, #40, #42 |
| Natural stone coping and decking | Hayward warranty excludes natural stone degradation; consult a stone specialist first | Not addressed in sources reviewed | Hayward | #61, #62 |
| New or resurfaced plaster | Wait at least 1 month before adding salt (Pentair) | Not addressed in sources reviewed | Pentair | #67 |
| Heater water chemistry | Pentair Max-E-Therm: salt up to 5,000 ppm; Hayward heat pump: 2,700 to 5,000 ppm | Same heaters; chlorine and pH limits apply | Pentair; Hayward | #69, #70 |
| Wear part | Salt cell: 3-year warranty (Hayward); 3 years or 10,000 hours (Pentair Plus); replaced about every 5 years (Mahoning) | Tablet feeder or floater (not priced here) | Hayward; Pentair; Mahoning County Public Health | #64, #66, #53 |
Sources: CDC; CDC MAHC 2024; U.S. EPA; Mahoning County Public Health; Hayward; Pentair; USGS; PubChem; PC&S calculation. Download CSV
How common are saltwater pools? Airbnb pool listings in 34 US markets, September 2026
No public US census of saltwater pools was found. Airbnb listings give a dated, market-level floor: 6.4% of pool listings with pool detail say saltwater, and 13.9% of detailed private pools do. Among markets with at least 100 detailed pool listings, Rhode Island (16.4%), Broward County, Florida (12.9%) and Nashville (10.0%) rank highest.
Markets with fewer than 100 detailed pool listings are in the table only. Saltwater is an optional host tick-box, so these are lower bounds.
Source: Inside Airbnb listings files scraped 2026-09-14 to 2026-09-30 (CC BY 4.0); PC&S calculation. Download chart data (CSV)
Inside Airbnb’s latest files for 34 US markets, scraped 2026-09-14 to 2026-09-30, hold 285,261 listings, of which 86,586 (30.4%) list a pool (Inside Airbnb). Airbnb lets hosts add optional pool attributes; 21,056 pool listings (24.3%) carry at least one.
1,353 listings marked the pool saltwater in September 2026. That is 6.4% of detailed pool listings and 1.6% of all pool listings across the 34 markets (Inside Airbnb; PC&S calculation).
Private pools, closer to a backyard residential pool than a condo or resort pool, show a higher share: 13.9% of 4,803 detailed private-pool listings were marked saltwater. Broward County, Florida reached 20.1% of 1,401 detailed private pools, San Diego 22.5% and Los Angeles 15.5%, while Clark County, Nevada (4.6%) and Austin (4.7%) were far lower (Inside Airbnb).
| Market | Scrape date | Listings | Pool listings | Pool listings with detail | Saltwater listings | Saltwater % of detailed pool listings | Saltwater % of all pool listings | Private-pool listings with detail | Saltwater % of detailed private pools | Heated % of detailed pool listings | Indoor % of pool listings | Infinity % of detailed pool listings |
|---|---|---|---|---|---|---|---|---|---|---|---|---|
| Rhode Island (state) | 2026-09-28 | 6026 | 713 | 177 | 29 | 16.4 | 4.1 | 41 | 31.7 | 29.9 | 6.3 | 0.0 |
| San Francisco, CA | 2026-09-14 | 7405 | 354 | 64 | 9 | 14.1 | 2.5 | 0 | 51.6 | 0.6 | 0.0 | |
| Broward County, FL | 2026-09-22 | 17630 | 11727 | 2979 | 383 | 12.9 | 3.3 | 1401 | 20.1 | 57.0 | 0.2 | 3.8 |
| Nashville, TN | 2026-09-19 | 10133 | 2283 | 551 | 55 | 10.0 | 2.4 | 65 | 33.8 | 29.4 | 1.9 | 0.9 |
| Los Angeles, CA | 2026-09-14 | 43781 | 10103 | 2109 | 205 | 9.7 | 2.0 | 838 | 15.5 | 37.0 | 0.2 | 3.2 |
| San Diego, CA | 2026-09-20 | 13253 | 2585 | 745 | 63 | 8.5 | 2.4 | 209 | 22.5 | 44.6 | 0.2 | 2.4 |
| New Orleans, LA | 2026-09-16 | 7263 | 1517 | 545 | 43 | 7.9 | 2.8 | 83 | 25.3 | 37.2 | 1.9 | 9.7 |
| Columbus, OH | 2026-09-22 | 2959 | 184 | 52 | 4 | 7.7 | 2.2 | 6 | 66.7 | 61.5 | 4.9 | 1.9 |
| Asheville, NC | 2026-09-19 | 2865 | 112 | 53 | 4 | 7.5 | 3.6 | 27 | 11.1 | 50.9 | 10.7 | 0.0 |
| Hawaii (state) | 2026-09-17 | 38779 | 30325 | 7191 | 376 | 5.2 | 1.2 | 446 | 13.2 | 37.3 | 0.1 | 1.8 |
| Twin Cities MSA, MN | 2026-09-20 | 5401 | 312 | 97 | 5 | 5.2 | 1.6 | 37 | 8.1 | 55.7 | 13.8 | 0.0 |
| San Mateo County, CA | 2026-09-21 | 3360 | 410 | 107 | 4 | 3.7 | 1.0 | 12 | 8.3 | 41.1 | 0.2 | 0.0 |
| Clark County, NV | 2026-09-20 | 20651 | 14034 | 2963 | 108 | 3.6 | 0.8 | 876 | 4.6 | 36.6 | 0.8 | 1.0 |
| Portland, OR | 2026-09-14 | 4161 | 73 | 31 | 1 | 3.2 | 1.4 | 4 | 25.0 | 58.1 | 4.1 | 0.0 |
| Santa Cruz County, CA | 2026-09-28 | 1800 | 236 | 128 | 4 | 3.1 | 1.7 | 11 | 9.1 | 62.5 | 0.0 | 0.8 |
| Santa Clara County, CA | 2026-09-21 | 6831 | 1194 | 265 | 8 | 3.0 | 0.7 | 40 | 10.0 | 29.1 | 0.8 | 1.9 |
| Austin, TX | 2026-09-17 | 11111 | 4203 | 1188 | 31 | 2.6 | 0.7 | 492 | 4.7 | 37.7 | 0.7 | 1.9 |
| Cambridge, MA | 2026-09-23 | 1462 | 78 | 38 | 1 | 2.6 | 1.3 | 1 | 100.0 | 94.7 | 44.9 | 0.0 |
| Fort Worth, TX | 2026-09-17 | 2431 | 368 | 145 | 3 | 2.1 | 0.8 | 30 | 10.0 | 33.1 | 10.9 | 0.7 |
| Dallas, TX | 2026-09-19 | 6436 | 2254 | 456 | 9 | 2.0 | 0.4 | 119 | 5.9 | 16.4 | 0.4 | 3.1 |
| Denver, CO | 2026-09-25 | 4955 | 463 | 153 | 3 | 2.0 | 0.6 | 9 | 0.0 | 41.2 | 2.2 | 2.0 |
| New York City, NY | 2026-09-14 | 29918 | 699 | 197 | 3 | 1.5 | 0.4 | 15 | 0.0 | 20.3 | 20.9 | 1.5 |
| Seattle, WA | 2026-09-20 | 7657 | 388 | 181 | 1 | 0.6 | 0.3 | 9 | 11.1 | 72.9 | 40.2 | 0.0 |
| Chicago, IL | 2026-09-19 | 8695 | 1001 | 185 | 1 | 0.5 | 0.1 | 3 | 0.0 | 35.7 | 12.4 | 0.0 |
| Albany, NY | 2026-09-14 | 500 | 6 | 3 | 0 | 0.0 | 0.0 | 1 | 0.0 | 66.7 | 0.0 | 0.0 |
| Boston, MA | 2026-09-19 | 4368 | 246 | 121 | 0 | 0.0 | 0.0 | 12 | 0.0 | 11.6 | 15.4 | 0.0 |
| Bozeman, MT | 2026-09-16 | 582 | 15 | 10 | 0 | 0.0 | 0.0 | 0 | 0.0 | 66.7 | 0.0 | |
| Jersey City, NJ | 2026-09-21 | 2330 | 141 | 83 | 0 | 0.0 | 0.0 | 2 | 0.0 | 4.8 | 1.4 | 0.0 |
| Newark, NJ | 2026-09-28 | 1908 | 12 | 6 | 0 | 0.0 | 0.0 | 3 | 0.0 | 0.0 | 0.0 | 0.0 |
| Oakland, CA | 2026-09-20 | 2074 | 42 | 13 | 0 | 0.0 | 0.0 | 7 | 0.0 | 30.8 | 0.0 | 0.0 |
| Pacific Grove, CA | 2026-09-30 | 274 | 2 | 0 | 0 | 0.0 | 0 | 0.0 | ||||
| Rochester, NY | 2026-09-21 | 1013 | 1 | 1 | 0 | 0.0 | 0.0 | 0 | 100.0 | 100.0 | 0.0 | |
| Salem, OR | 2026-09-21 | 343 | 8 | 3 | 0 | 0.0 | 0.0 | 0 | 0.0 | 0.0 | 0.0 | |
| Washington, DC | 2026-09-19 | 6906 | 497 | 216 | 0 | 0.0 | 0.0 | 4 | 0.0 | 2.3 | 8.2 | 0.5 |
| All 34 US markets | 2026-09-14 to 2026-09-30 | 285261 | 86586 | 21056 | 1353 | 6.4 | 1.6 | 4803 | 13.9 | 39.4 | 1.2 | 2.2 |
Source: Inside Airbnb listings files scraped 2026-09-14 to 2026-09-30 (CC BY 4.0); PC&S calculation. Download CSV
The most-cited industry figure is old. AQUA Magazine reported in May 2009 that estimates of the share of new pools receiving salt chlorine generators ranged from 40% to 70%, with the salt pool population judged to be over one million (AQUA Magazine). The article gives no method, and no newer published count was found in this research.
For the number of US pools of every type, see number of swimming pools in the US; for pool shares and prices across vacation rentals, see vacation rentals with pools.
Heated, saltwater, lap, infinity and indoor pools: five pool features compared on Airbnb
Of the five pool features compared here, heating is marked most often, on 39.4% of detailed pool listings. Saltwater ranks second of the five, ahead of lap, infinity and indoor pools.
Source: Inside Airbnb listings files scraped 2026-09-14 to 2026-09-30 (CC BY 4.0); PC&S calculation. Download chart data (CSV)
39.4% of detailed pool listings in the 34 US markets were marked heated in September 2026, and 49.0% of detailed private pools (Inside Airbnb). 3.7% of detailed pool listings were indoor pools, and 1.2% of all pool listings.
Among the four markets with more than 2,000 detailed pool listings, Broward County, Florida had the highest heated share, 57.0% of 2,979, against 37.3% in Hawaii, 37.0% in Los Angeles and 36.6% in Clark County, Nevada (Inside Airbnb). Seattle, with 181 detailed pool listings, reached 72.9%. Heating cost is covered in cost to heat a pool.
Salt system, salt cell, salt and chlorine prices in 2026
The salt option front-loads cost: $1,799 to $2,199 for the generator, plus cells at $899 to $1,819. Per pound of chlorine, generator electricity is cheap and tablets and liquid are not; the cell is what closes the gap.
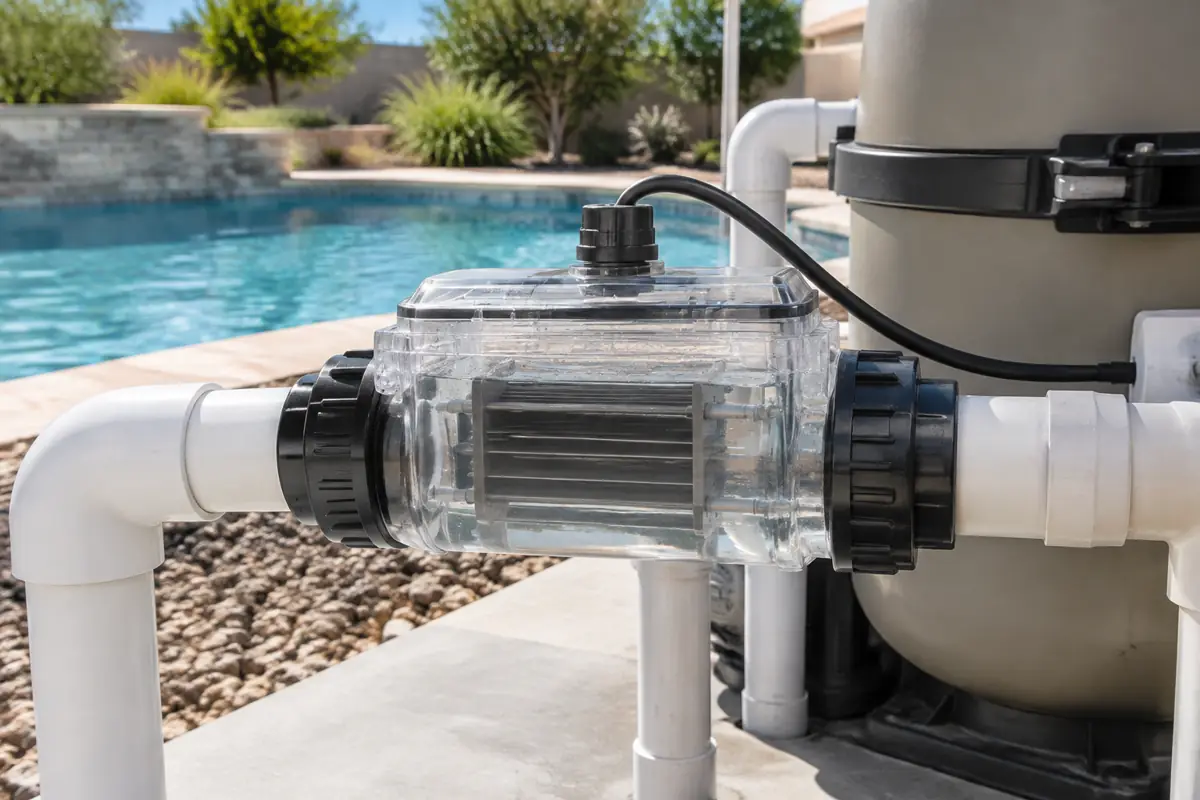
Leslie’s listed Hayward AquaRite complete salt systems at $1,799 (15,000 gallons), $1,999 (25,000 gallons) and $2,199 (40,000 gallons) on June 30, 2026. Replacement cells listed at $899 (Hayward W3T-CELL-9, June 2026), $1,099 (W3T-CELL-15, September 2026) and $1,819 (Pentair IntelliChlor Plus40, September 2026). Installation labour is not included.
A 40 lb bag of Leslie’s pool salt listed at $11.99 in June 2026, about $0.30 per lb. Reaching 3,200 ppm from zero takes 267 lb of salt per 10,000 gallons on Hayward’s chart (Hayward), so a 20,000-gallon pool needs about 534 lb, or $160.
Source: Leslie's (Wayback captures 2026); Pentair IntelliChlor Plus/LT specs; EIA Electric Power Monthly Table 5.6.A; PC&S calculation. Download chart data (CSV)
| Chlorine source | Cost per lb of available chlorine ($) | Basis |
|---|---|---|
| Trichlor tablets, 50 lb bucket, sale price | 4.0 | Leslie's, Sept 2026 |
| Trichlor tablets, 50 lb bucket, regular price | 5.0 | Leslie's, Sept 2026 |
| Trichlor tablets, 35 lb bucket, regular price | 5.4 | Leslie's, Oct 2026 |
| Trichlor tablets, 20 lb bucket, regular price | 6.67 | Leslie's, Sept 2026 |
| Liquid chlorine 4-pack at 12.5% strength | 7.19 | Leslie's, Sept 2026 |
| Liquid chlorine 4-pack at 10% strength | 8.99 | Leslie's, Sept 2026 |
| Salt generator, electricity only, US average price | 0.52 | Pentair specs x EIA July 2026 |
| Salt generator, electricity only, Hawaii price | 1.35 | Pentair specs x EIA July 2026 |
| Salt generator, electricity + salt + cell, year-round pool | 3.47 | PC&S model, mid demand |
| Salt generator, electricity + salt + cell, 4-month pool | 9.29 | PC&S model, mid demand |
Sources: Leslie‘s captures (2026); Pentair; EIA Table 5.6.A; PC&S calculation. Download CSV
Pentair rates its IntelliChlor Plus and LT models at 63 W to 206 W for 0.65 to 2.0 lb of chlorine a day, which works out to 2.33 to 3.19 kWh per lb (median 2.81) (Pentair; PC&S calculation). At the July 2026 US residential price of 18.31 cents per kWh, that is $0.52 per lb; at Hawaii’s 48.00 cents it is $1.35 (EIA).
Leslie’s 3-inch tablets are 99% trichlor with 90% available chlorine (Leslie‘s), so $3.60 to $6.00 per lb of tablet becomes $4.00 to $6.67 per lb of chlorine. Leslie’s liquid chlorine 4-pack, stated at 10% to 12.5% strength, works out to $7.19 to $8.99 per lb (Leslie‘s; PC&S calculation). Tablet and liquid price trends are tracked in pool chemical prices and pool equipment prices.
10-year cost of a salt chlorine generator vs chlorine tablets and liquid chlorine
For a 20,000-gallon year-round pool at mid chlorine demand, the 10-year totals land within $98 of each other. Chlorine demand, tablet price and cell life decide which side wins; in short seasons tablets win in every scenario tested.
Excludes installation labour, acid and other balancing chemicals, shock and repairs.
Source: PC&S cost model: Leslie's prices (Wayback captures 2026), Pentair power specs, EIA July 2026, DOE TSD, EPA labels. Download chart data (CSV)
The model prices a 20,000-gallon pool, the mean of DOE’s pool volume distribution for standard-size self-priming pool pumps (U.S. DOE). It counts only sanitizer costs: the salt system, cells, salt, stabilizer and cell electricity on one side, and tablets or liquid chlorine on the other. It excludes installation labour, acid, shock, water, testing and repairs.
Chlorine demand comes from EPA-accepted labels and retailer guidance: 1.14 oz of trichlor per 10,000 gallons a day (one 8 oz tablet a week, EPA Reg. No. 1258-1338), 2.0 oz (EPA Reg. No. 42177-18, upper end of 1 to 2 oz) and 3.2 oz (one 8 oz tablet per 5,000 gallons every 5 days, Leslie‘s). The salt generator must make the same chlorine: 90% of the tablet weight.
At mid demand, a year-round pool uses 91.2 lb of tablets a year, about $411, so 10 years cost $4,106. The salt option costs $2,251 upfront, about $105 a year in electricity and top-up salt and stabilizer, and one $899 cell in year 5, for $4,204 (PC&S calculation).
| Season (DOE) | Days | Chlorine demand | Trichlor dose (oz per 10,000 gal per day) | Trichlor (lb per year) | Available chlorine needed (lb per year) | Tablet pool, 10-yr ($) | Liquid chlorine 12.5%, 10-yr ($) | Liquid chlorine 10%, 10-yr ($) | Salt system pool, 10-yr ($) | Salt minus tablets, base ($) | Salt minus tablets, salt-favoured ($) | Salt minus tablets, tablet-favoured ($) | Break-even year, base | Break-even year, salt-favoured | Break-even year, tablet-favoured | Salt minus liquid 12.5%, base ($) | Break-even year vs liquid 12.5%, base |
|---|---|---|---|---|---|---|---|---|---|---|---|---|---|---|---|---|---|
| year-round | 365 | low | 1.14 | 52.1 | 46.9 | 2346 | 3374 | 4217 | 4022 | 1676 | 413 | 5850 | Not within 10 years | Not within 10 years | Not within 10 years | 649 | Not within 10 years |
| year-round | 365 | mid | 2.0 | 91.2 | 82.1 | 4106 | 5904 | 7380 | 4204 | 98 | -1829 | 4981 | Not within 10 years | 5 | Not within 10 years | -1700 | 7 |
| year-round | 365 | high | 3.2 | 146.0 | 131.4 | 6570 | 9446 | 11807 | 4458 | -2112 | -4968 | 3764 | 6 | 3 | Not within 10 years | -4988 | 3 |
| 4-month | 123 | low | 1.14 | 17.6 | 15.8 | 791 | 1137 | 1421 | 3862 | 3071 | 2395 | 6619 | Not within 10 years | Not within 10 years | Not within 10 years | 2725 | Not within 10 years |
| 4-month | 123 | mid | 2.0 | 30.8 | 27.7 | 1384 | 1989 | 2487 | 3923 | 2540 | 1639 | 6326 | Not within 10 years | Not within 10 years | Not within 10 years | 1934 | Not within 10 years |
| 4-month | 123 | high | 3.2 | 49.2 | 44.3 | 2214 | 3183 | 3979 | 4009 | 1795 | 582 | 5916 | Not within 10 years | Not within 10 years | Not within 10 years | 826 | Not within 10 years |
Source: PC&S calculation from Leslie‘s prices, Pentair specs, EIA July 2026, DOE seasons and EPA labels. Download CSV
Source: PC&S cost model; inputs in tables/sensitivity_year_round.csv. Download chart data (CSV)
Year-round results swing with demand. At low demand the salt system costs $1,676 more over 10 years; at high demand it saves $2,112 and pulls even with tablets in year 6 (PC&S calculation).
In a 4-month season (the DOE May 1 to August 31 window used for most cold states), the salt system costs $1,795 to $3,071 more over 10 years. With every input set in its favour the gap still stays at $582 or more (PC&S calculation; DOE).
Liquid chlorine costs more per pound than tablets, so salt compares better against it. A year-round mid-demand salt pool costs $1,700 less over 10 years than one on 12.5% liquid chlorine and breaks even in year 7 (PC&S calculation).
| Input | Unit | Low | Base | High | Salt minus tablets at low ($) | Salt minus tablets at base ($) | Salt minus tablets at high ($) | Fact rows |
|---|---|---|---|---|---|---|---|---|
| 3-inch trichlor tablet price | $/lb | 3.6 | 4.5 | 6.0 | 919 | 98 | -1271 | #83, #82, #85 |
| Residential electricity price, July 2026 | cents/kWh | 12.72 | 18.31 | 48.0 | -31 | 98 | 784 | #90, #89, #91 |
| Generator electricity per lb of chlorine | kWh/lb chlorine | 2.33 | 2.81 | 3.19 | 24 | 98 | 154 | #65 |
| Salt system purchase (25,000 or 40,000 gal model) | $ | 1999.0 | 1999.0 | 2199.0 | 98 | 98 | 298 | #76, #77 |
| Replacement salt cell | $ | 899.0 | 899.0 | 1099.0 | 98 | 98 | 298 | #78, #79 |
| Salt cell life (low = favourable 7 yr, high = 3 yr) | years | 7 | 5 | 3 | 98 | 98 | 1896 | #103, #53 |
| Salt and stabilizer top-up (PC&S scenario, no published rate) | share of initial charge per year | 0.1 | 0.25 | 0.5 | -280 | 98 | 728 | #60 |
Source: PC&S calculation; fact rows listed per input. Download CSV
Salt vs chlorine cost by state: season length and electricity prices
Season length matters more than electricity price. In the 14 year-round DOE states the 10-year difference runs from -$31 to $784; in 3 to 7 month states the salt system costs $1,579 to $2,839 more.
Season length is the DOE modeling assumption, not observed pool use.
Source: PC&S cost model; DOE DPPP TSD Table 7.3.11; EIA Electric Power Monthly Table 5.6.A (July 2026). Download chart data (CSV)
DOE assumes 12 months of pool use in 14 states, including Florida, Texas, Arizona and California, and 3 to 7 months elsewhere (DOE TSD Table 7.3.11). Combined with July 2026 residential electricity prices from EIA, the salt system’s 10-year cost exceeds tablets by $22 in Florida, $30 in Arizona, $42 in Texas, $451 in California and $784 in Hawaii, at mid chlorine demand (PC&S calculation).
Generator electricity is a small line even where power is expensive: about $35 a year in Florida, $78 in California and $111 in Hawaii for a year-round 20,000-gallon pool (PC&S calculation). Pump electricity, which a salt pool also needs, is covered in cost to run a pool pump; local season lengths are in pool season length by city.
| State | State name | DOE pool-use window | Days | Residential price July 2026 (cents/kWh) | Generator electricity per year ($) | Tablet pool, 10-yr ($) | Salt system pool, 10-yr ($) | Salt minus tablets ($) | Break-even year |
|---|---|---|---|---|---|---|---|---|---|
| AK | Alaska | 5/1-9/30 | 153 | 28.83 | 27.93 | 1721 | 4060 | 2339 | Not within 10 years |
| AL | Alabama | 1/1-12/31 | 365 | 16.4 | 37.91 | 4106 | 4160 | 54 | Not within 10 years |
| AR | Arkansas | 1/1-12/31 | 365 | 14.33 | 33.12 | 4106 | 4112 | 6 | Not within 10 years |
| AZ | Arizona | 1/1-12/31 | 365 | 15.38 | 35.55 | 4106 | 4136 | 30 | Not within 10 years |
| CA | California | 1/1-12/31 | 365 | 33.61 | 77.69 | 4106 | 4557 | 451 | Not within 10 years |
| CO | Colorado | 5/1-8/31 | 123 | 17.0 | 13.24 | 1384 | 3913 | 2529 | Not within 10 years |
| CT | Connecticut | 5/1-8/31 | 123 | 24.16 | 18.82 | 1384 | 3969 | 2585 | Not within 10 years |
| DC | District of Columbia | 5/1-9/30 | 153 | 25.21 | 24.43 | 1721 | 4025 | 2304 | Not within 10 years |
| DE | Delaware | 5/1-9/30 | 153 | 18.48 | 17.91 | 1721 | 3960 | 2238 | Not within 10 years |
| FL | Florida | 1/1-12/31 | 365 | 15.03 | 34.74 | 4106 | 4128 | 22 | Not within 10 years |
| GA | Georgia | 4/1-10/31 | 214 | 16.27 | 22.05 | 2407 | 4001 | 1594 | Not within 10 years |
| HI | Hawaii | 1/1-12/31 | 365 | 48.0 | 110.95 | 4106 | 4890 | 784 | Not within 10 years |
| IA | Iowa | 6/1-9/30 | 122 | 15.99 | 12.35 | 1372 | 3904 | 2532 | Not within 10 years |
| ID | Idaho | 5/1-8/31 | 123 | 13.73 | 10.69 | 1384 | 3888 | 2504 | Not within 10 years |
| IL | Illinois | 5/1-8/31 | 123 | 19.22 | 14.97 | 1384 | 3930 | 2547 | Not within 10 years |
| IN | Indiana | 5/1-8/31 | 123 | 16.73 | 13.03 | 1384 | 3911 | 2527 | Not within 10 years |
| KS | Kansas | 6/1-9/30 | 122 | 15.27 | 11.8 | 1372 | 3899 | 2526 | Not within 10 years |
| KY | Kentucky | 1/1-12/31 | 365 | 13.81 | 31.92 | 4106 | 4100 | -6 | 10 |
| LA | Louisiana | 1/1-12/31 | 365 | 12.72 | 29.4 | 4106 | 4075 | -31 | 10 |
| MA | Massachusetts | 5/1-8/31 | 123 | 30.49 | 23.75 | 1384 | 4018 | 2634 | Not within 10 years |
| MD | Maryland | 5/1-9/30 | 153 | 21.41 | 20.74 | 1721 | 3988 | 2267 | Not within 10 years |
| ME | Maine | 5/1-8/31 | 123 | 32.41 | 25.24 | 1384 | 4033 | 2649 | Not within 10 years |
| MI | Michigan | 5/1-8/31 | 123 | 23.05 | 17.95 | 1384 | 3960 | 2576 | Not within 10 years |
| MN | Minnesota | 6/1-9/30 | 122 | 17.45 | 13.48 | 1372 | 3915 | 2543 | Not within 10 years |
| MO | Missouri | 6/1-9/30 | 122 | 16.09 | 12.43 | 1372 | 3905 | 2532 | Not within 10 years |
| MS | Mississippi | 1/1-12/31 | 365 | 14.54 | 33.61 | 4106 | 4117 | 11 | Not within 10 years |
| MT | Montana | 5/1-8/31 | 123 | 14.99 | 11.68 | 1384 | 3897 | 2514 | Not within 10 years |
| NC | North Carolina | 4/1-10/31 | 214 | 15.16 | 20.54 | 2407 | 3986 | 1579 | Not within 10 years |
| ND | North Dakota | 6/1-9/30 | 122 | 13.41 | 10.36 | 1372 | 3884 | 2512 | Not within 10 years |
| NE | Nebraska | 6/1-9/30 | 122 | 13.78 | 10.65 | 1372 | 3887 | 2515 | Not within 10 years |
| NH | New Hampshire | 5/1-8/31 | 123 | 26.6 | 20.72 | 1384 | 3988 | 2604 | Not within 10 years |
| NJ | New Jersey | 5/1-8/31 | 123 | 25.19 | 19.62 | 1384 | 3977 | 2593 | Not within 10 years |
| NM | New Mexico | 1/1-12/31 | 365 | 16.09 | 37.19 | 4106 | 4153 | 46 | Not within 10 years |
| NV | Nevada | 1/1-12/31 | 365 | 12.77 | 29.52 | 4106 | 4076 | -30 | 10 |
| NY | New York | 5/1-8/31 | 123 | 29.9 | 23.29 | 1384 | 4014 | 2630 | Not within 10 years |
| OH | Ohio | 5/1-8/31 | 123 | 19.45 | 15.15 | 1384 | 3932 | 2548 | Not within 10 years |
| OK | Oklahoma | 1/1-12/31 | 365 | 14.35 | 33.17 | 4106 | 4112 | 6 | Not within 10 years |
| OR | Oregon | 6/1-8/31 | 92 | 15.97 | 9.3 | 1035 | 3874 | 2839 | Not within 10 years |
| PA | Pennsylvania | 5/1-8/31 | 123 | 21.72 | 16.92 | 1384 | 3950 | 2566 | Not within 10 years |
| RI | Rhode Island | 5/1-8/31 | 123 | 28.29 | 22.04 | 1384 | 4001 | 2617 | Not within 10 years |
| SC | South Carolina | 4/1-10/31 | 214 | 15.47 | 20.97 | 2407 | 3990 | 1583 | Not within 10 years |
| SD | South Dakota | 6/1-9/30 | 122 | 15.37 | 11.87 | 1372 | 3899 | 2527 | Not within 10 years |
| TN | Tennessee | 1/1-12/31 | 365 | 13.71 | 31.69 | 4106 | 4098 | -9 | 10 |
| TX | Texas | 1/1-12/31 | 365 | 15.88 | 36.71 | 4106 | 4148 | 42 | Not within 10 years |
| UT | Utah | 5/1-8/31 | 123 | 13.12 | 10.22 | 1384 | 3883 | 2499 | Not within 10 years |
| VA | Virginia | 4/1-10/31 | 214 | 17.55 | 23.78 | 2407 | 4018 | 1611 | Not within 10 years |
| VT | Vermont | 5/1-8/31 | 123 | 23.75 | 18.5 | 1384 | 3966 | 2582 | Not within 10 years |
| WA | Washington | 6/1-8/31 | 92 | 14.71 | 8.57 | 1035 | 3866 | 2831 | Not within 10 years |
| WI | Wisconsin | 6/1-9/30 | 122 | 19.06 | 14.73 | 1372 | 3928 | 2555 | Not within 10 years |
| WV | West Virginia | 5/1-9/30 | 153 | 15.78 | 15.29 | 1721 | 3934 | 2212 | Not within 10 years |
| WY | Wyoming | 5/1-8/31 | 123 | 14.36 | 11.19 | 1384 | 3892 | 2509 | Not within 10 years |
Sources: U.S. DOE; EIA Electric Power Monthly Table 5.6.A; PC&S calculation. Download CSV
Water chemistry in salt and chlorine pools: pH drift, stabilizer and salt level
Each system pushes the water in its own direction. Salt generators push pH up and need stabilizer added; trichlor tablets bring stabilizer with every dose, enough to build up past public-pool limits unless water is replaced.
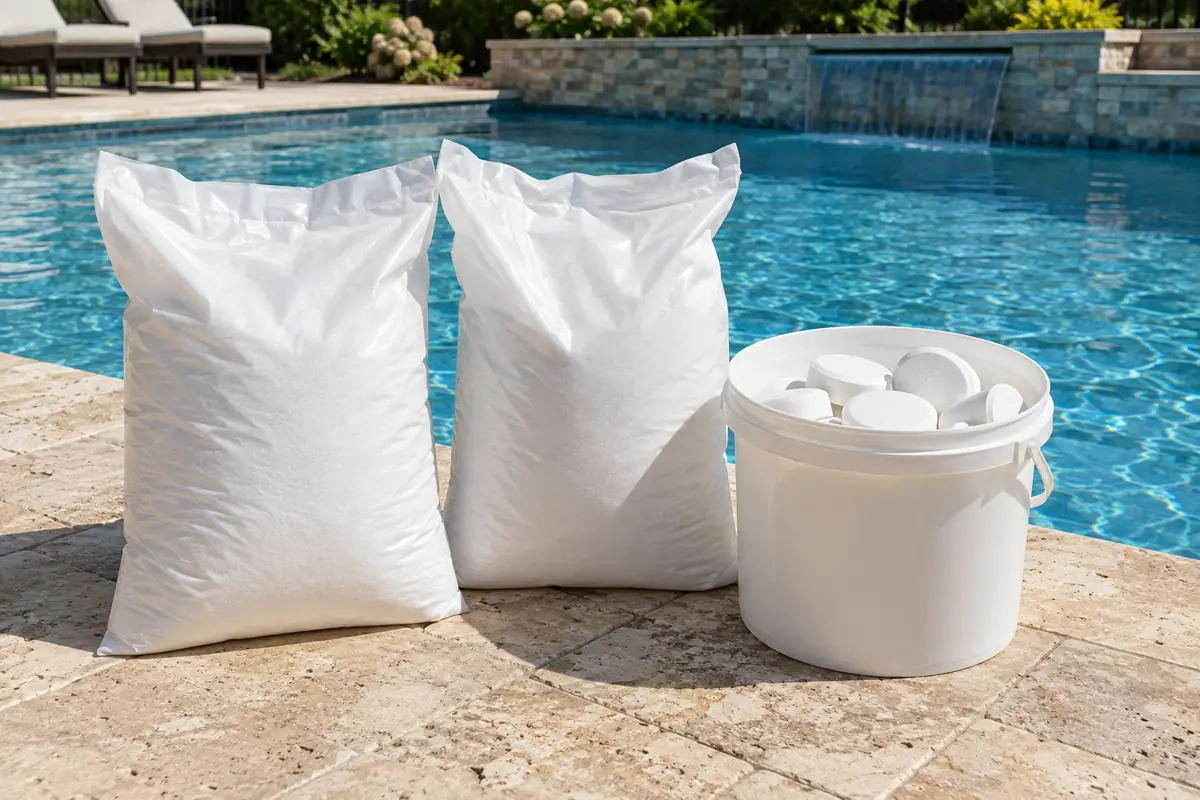
Hayward lists an ideal salt level of 2,700 to 3,400 ppm, free chlorine of 1.0 to 3.0 ppm and stabilizer of 60 to 80 ppm for its AquaRite systems (Hayward). Salt begins to be tasted at about 3,500 to 4,000 ppm (Hayward). At 3,200 ppm a salt pool holds about 9.1% of the salt in ocean water, which USGS puts at about 35,000 ppm (USGS; PC&S calculation).
Mahoning County Public Health states that pH rises as chlorine is generated, and that salt chlorination needs frequent hydrochloric acid additions (Mahoning County Public Health). Acid use is not priced in the cost model because no source quantified it; see how to lower pH in a pool.
Trichlor is a chlorinated cyanurate: by PubChem molecular weights, each pound of trichlor carries 0.56 lb of cyanuric acid (PubChem; PC&S calculation). At mid demand a 20,000-gallon tablet pool adds about 304 ppm of cyanuric acid a year if run year-round and about 102 ppm in a 4-month season, before splash-out, backwashing and rain dilute it (PC&S calculation).
The 2024 MAHC caps cyanuric acid at 90 ppm in public aquatic venues and closes a venue at 300 ppm or more (CDC MAHC 2024). CDC notes that disinfection takes longer when cyanuric acid is present (CDC). Since 1958, cyanuric acid and chlorinated cyanurates have been used in outdoor pools to slow sunlight loss of chlorine (Wahman, J AWWA 2018).
Chloramines, the irritants behind eye and lung complaints, form when chlorine combines with sweat, dirt and pee (CDC). Because salt pools also run on chlorine, the same reaction can occur in both. Claims that salt water is gentler on skin and eyes were not supported by any primary source reviewed.
Does saltwater damage pool equipment, stone or plaster? What the evidence shows
The evidence is thin and mostly indirect. Manufacturers hedge on natural stone and new plaster, heaters list salt limits, and the only pool-specific plaster test found is small, dated and confounded.
Hayward’s AquaRite limited warranty excludes degradation of natural stone used in or immediately adjacent to a pool (Hayward), and its AquaRite S3 manual tells owners to consult a stone specialist on stone type and sealant before installing (Hayward). Pentair warns that salt is corrosive and says to wait at least 1 month after new or resurfaced plaster before adding salt (Pentair).
Heater manuals set salt ceilings. Pentair’s Max-E-Therm gas heater lists salt at 2,000 ppm minimum, 3,200 ideal and 5,000 maximum (Pentair). Hayward’s heat pump manual lists 2,700 to 5,000 ppm and flags values outside it as corrosive to the heat exchanger or poor for chlorinator performance (Hayward).
At Cal Poly’s National Pool Industry Research Center, salt-sanitized test pools showed the most plaster etching after about 10 months in the 2004 to 2005 protocol, but the researchers noted the two salt pools could not hold chlorine steady because the generators were oversized for 7,900-gallon test pools (AQUA Magazine, 2006). The result is unresolved, not proof.
Materials research explains the mechanism without measuring pool decks. A 2024 laboratory study found salt-crystallization cycles cause weight loss in limestone, with resistance tied to porosity (Cappai et al., Materials 2024). A 1989 Kansas study found sodium chloride scaled concrete paste and limestone aggregate even without freeze-thaw, with flakes up to 0.6 inches, but under deicing-salt exposure far saltier than pool water (Transportation Research Record 1250).
Resurfacing and repair costs are covered in pool resurfacing cost and pool repair.
How long a salt cell lasts: warranties, hours and field estimates
No manufacturer publishes a rated cell life. Warranties run 3 years, Pentair caps its warranty at 10,000 hours, and a county health department puts average replacement at 5 years.
Hayward warrants AquaRite chlorination products for 3 years on US residential pools (Hayward). Pentair warrants IntelliChlor Plus cells for 3 years or 10,000 hours and LT cells for 2 years or 6,000 hours (Pentair). Mahoning County Public Health puts salt cell replacement at every five years on average (Mahoning County Public Health), and a pool-supply retailer cites 3 to 7 years (EZ Test Pools).
Hours give a cross-check. A Hayward cell rated at 0.98 lb of chlorine a day (Hayward) must generate about 5.5 hours a day to meet mid demand in a 20,000-gallon pool. That is 2,011 hours a year if run year-round, reaching 10,000 hours in about 5.0 years, versus 14.8 years in a 4-month season (PC&S calculation).
How EPA and the public pool code treat salt chlorine generators
Federal rules split on how a generator is sold. A generator alone is generally a pesticide device; sold with salt, it is a pesticide that needs registration. Public pool code allows generators with labelling and testing rules.
EPA says products that generate a substance, such as hypochlorous acid generators, are generally devices that do not need EPA registration unless sold with or containing a substance, and that an apparatus sold with a substance such as salt used to generate a pesticide is generally a pesticide (U.S. EPA). Hayward’s 2025 10-K states that its salt chlorinator products are regulated under FIFRA (Hayward Holdings 10-K).
The 2024 MAHC permits in-line and brine salt electrolytic chlorine generators at public aquatic venues, requires an EPA establishment number on the equipment and requires weekly salt testing (CDC MAHC 2024). MAHC is a voluntary model code for public pools and does not govern backyard pools.
Scenarios we modeled
Saltwater share of Airbnb pool listings by market
How common are saltwater pools in US short-term rentals, market by market?
listings whose pool amenity carries the 'saltwater' attribute / pool listings with at least one pool attribute; also / all pool listings and / detailed private poolsInputs: fact rows #2 to #37; derived D1 to D43
Limitations: Rental listings, not all pools; optional host attribute, so a lower bound; shared pools repeat across listings; one scrape per market.
10-year sanitizer cost of ownership, salt vs chlorine
Is a salt chlorine generator cheaper than chlorine over 10 years?
Salt: system + initial salt and stabilizer + 10 x (electricity + top-up) + cell replacements. Chlorine: 10 x lb of tablets (or liquid) x price. Ranges set every input to its salt-favoured or tablet-favoured end.Inputs: fact rows #53, #58, #59, #65, #71, #73, #74, #76 to #89, #94, #95, #103; derived D44 to D57
Limitations: Illustrative 20,000-gallon pool; sanitizer costs only; one retailer’s list prices; salt top-up and cell life are uncertain; acid and labour excluded.
Break-even year for the salt system premium
How many years until a salt system pays back its upfront cost?
First year in which cumulative salt cost <= cumulative tablet (or liquid) cost; plus simple payback = upfront / (tablet annual - salt annual - cell price / cell life)Inputs: derived D46, D52 to D58
Limitations: Break-even jumps with discrete cell replacements; results scale with chlorine demand, which the model takes from labels rather than measurement.
Heated and indoor pool shares as context
How do saltwater pools compare with other pool features hosts list?
attribute count / detailed pool listings (and / detailed private pools)Inputs: derived D7 to D9
Limitations: Same listing caveats; indoor is read from the amenity name, other features from optional attributes.
Cost per pound of available chlorine
What does a pound of chlorine cost from each source?
tablet price / 0.90; liquid price / (strength x 8.34 lb per gallon); generator kWh per lb x electricity price; plus top-up and cell spread over 5 yearsInputs: fact rows #53, #65, #78, #82 to #85, #88, #89, #91; derived D50
Limitations: List prices from one retailer; liquid strength is a stated range; generator figures use rated power.
Cyanuric acid load from tablets
How much stabilizer does a tablet pool add compared with public-pool limits?
lb trichlor x (129.07 / 232.41) / (gallons x 8.34e-6)Inputs: fact rows #42, #58, #73, #94, #96; derived D61
Limitations: Ignores water replacement, which lowers real levels; MAHC limits apply to public pools only.
What the comparison shows
- Salt pools are chlorine pools: a salt chlorine generator turns dissolved salt into chlorine, according to Mahoning County Public Health and the CDC 2024 Model Aquatic Health Code.
- Across 34 US Inside Airbnb markets in September 2026, 1,353 listings marked their pool saltwater, 6.4% of the 21,056 pool listings with pool detail and 13.9% of detailed private pools (Inside Airbnb; PC&S calculation).
- Broward County, Florida had 12.9% of detailed pool listings marked saltwater and Los Angeles 9.7%, versus 3.6% in Clark County, Nevada, in September 2026 (Inside Airbnb).
- A Hayward AquaRite salt system for pools up to 25,000 gallons listed at $1,999 at Leslie’s in June 2026, and a W3T-CELL-9 replacement cell at $899.
- For a 20,000-gallon year-round US pool, the model puts 10-year sanitizer cost at $4,204 with a salt system and $4,106 with 3-inch tablets, a $98 gap that spans -$1,829 to $4,981 across input ranges (PC&S calculation).
- Against liquid chlorine at 12.5% strength, the same year-round salt pool costs $1,700 less over 10 years and breaks even in year 7 (PC&S calculation; Leslie‘s prices).
- In a 4-month DOE pool season, the salt system costs $1,795 to $3,071 more than tablets over 10 years and never breaks even, even with every input set in its favour (PC&S calculation; U.S. DOE).
- Trichlor tablets add 0.56 lb of cyanuric acid per lb of tablet; a year-round 20,000-gallon tablet pool at mid demand adds about 304 ppm a year before dilution, against a 90 ppm cap for public pools in the 2024 MAHC (PC&S calculation).
Results
- Inside Airbnb published listings files for 34 US markets on its Get the Data page, with scrapes dated 2026-09-14 to 2026-09-30.
- 30.4% of 285,261 listings in the 34 US markets had a pool amenity in September 2026 (86,586 listings; Inside Airbnb).
- 24.3% of those 86,586 pool listings carried at least one pool attribute such as heated or saltwater in September 2026 (Inside Airbnb; PC&S calculation).
- 6.4% of detailed pool listings and 1.6% of all pool listings in the 34 US markets were marked saltwater in September 2026 (Inside Airbnb).
- 39.4% of detailed pool listings were marked heated in the 34 US markets in September 2026, rising to 49.0% for private pools (Inside Airbnb).
- Indoor pools made up 1.2% of all pool listings in the 34 US markets in September 2026 (Inside Airbnb).
- Rhode Island had the highest saltwater share of detailed pool listings, 16.4%, on 177 detailed listings in its 2026-09-28 scrape (Inside Airbnb).
- Generator electricity costs $0.52 per lb of chlorine at the July 2026 US residential price of 18.31 cents per kWh, based on Pentair power ratings and EIA prices.
- 3-inch trichlor tablets cost $4.00 to $6.67 per lb of available chlorine at Leslie‘s in September and October 2026, and liquid chlorine $7.19 to $8.99 (PC&S calculation).
- The salt cell is the largest running cost in the model: $180 a year for an $899 cell replaced every 5 years, against $42 of electricity for a year-round 20,000-gallon US pool (PC&S calculation).
- In the 14 states DOE treats as year-round pool states, the 10-year salt-minus-tablet difference runs from -$31 (Louisiana) to $784 (Hawaii) at July 2026 electricity prices (PC&S calculation; DOE; EIA).
- Pentair’s IntelliChlor Plus warranty is 3 years or 10,000 hours, and Hayward’s AquaRite warranty is 3 years for US residential pools (Pentair; Hayward).
- EPA generally treats a generator sold alone as a device that needs no registration, but an apparatus sold with salt to generate a pesticide as a pesticide (U.S. EPA).
- Hayward’s AquaRite limited warranty excludes degradation of natural stone used in or immediately adjacent to a pool or spa (Hayward).
Questions owners ask
Is saltwater better than chlorine?
Neither wins on the data. Both disinfect with chlorine and share CDC’s targets (CDC). Over 10 years a year-round 20,000-gallon salt pool costs about the same as tablets ($4,204 vs $4,106) and less than liquid chlorine; in 4-month seasons tablets are cheaper by $1,795 or more (PC&S calculation).
How many pools are saltwater?
No current US count was found. In September 2026, 6.4% of detailed Airbnb pool listings and 13.9% of detailed private pools across 34 US markets were marked saltwater, a lower bound (Inside Airbnb). A 2009 trade estimate put salt systems on 40% to 70% of new pools (AQUA Magazine).
Is a saltwater pool cheaper to maintain?
Only in some cases. Generator electricity costs about $0.52 per lb of chlorine at July 2026 US prices, against $4.00 to $6.67 for tablets, but an $899 cell every 5 years adds $180 a year. Year-round and high-demand pools can save $2,112 over 10 years; seasonal pools do not (PC&S calculation).
Do saltwater pools still use chlorine?
Yes. A salt chlorine generator turns salt into chlorine, and salt pools are still sanitized using chlorine (Mahoning County Public Health). CDC’s free chlorine targets of at least 1 ppm, or 2 ppm with cyanuric acid, apply to both (CDC).
Does saltwater damage pool equipment?
Manufacturers set limits rather than report damage rates. Heaters list salt maximums of 5,000 ppm (Pentair; Hayward), Hayward’s warranty excludes natural stone degradation (Hayward), and Pentair says to wait 1 month on new plaster (Pentair). No study measuring equipment failure rates in salt pools was found.
How long does a salt cell last?
About 5 years on average, according to Mahoning County Public Health; a retailer cites 3 to 7 years (EZ Test Pools). Warranties are 3 years (Hayward) and 3 years or 10,000 hours (Pentair Plus) (Pentair). A cell meeting mid demand year-round reaches 10,000 hours in about 5.0 years (PC&S calculation).
Prices and rules used
- Leslie’s listed a 35 lb bucket of 3-inch trichlor tablets at $154.99 on sale, $169.99 regular in an October 9, 2026 capture.
- Inside Airbnb’s latest US scrapes (2026-09-14 to 2026-09-30) cover 34 markets and 285,261 listings; this report reads the saltwater, heated, infinity and indoor pool attributes in them (Inside Airbnb).
- Leslie’s listed the Hayward W3T-CELL-15 salt cell at $1,099 on September 16, 2026, up 22.2% from $899 in June 2024; the W3T-CELL-9 rose 28.6%, from $699 in July 2024 to $899 in June 2026, while a 40 lb bag of salt stayed at $11.99.
- EIA’s September 24, 2026 Electric Power Monthly put the July 2026 US residential electricity price at 18.31 cents per kWh; the next release is due October 23, 2026 (EIA).
- EPA accepted an updated master label for an HTH-family trichlor tablet product (EPA Reg. No. 1258-1338) on July 2, 2026, with a dose of one 6 to 8 oz tablet per 10,000 gallons a week (EPA).
More questions
How much does a salt chlorine generator cost in 2026?
Leslie’s listed Hayward AquaRite salt systems at $1,799 to $2,199 in June 2026, depending on the 15,000 to 40,000-gallon rating (Leslie‘s). Installation labour is extra and not covered here.
How much does a replacement salt cell cost?
Leslie’s listed the Hayward W3T-CELL-9 at $899 (June 2026), the W3T-CELL-15 at $1,099 and the Pentair IntelliChlor Plus40 at $1,819 (September 2026) (Leslie‘s).
How much salt does a saltwater pool need?
How salty is a saltwater pool compared with the ocean?
At 3,200 ppm, a salt pool has about 9.1% of the salt in seawater, which USGS puts at about 35,000 ppm (USGS; PC&S calculation).
How much electricity does a salt chlorine generator use?
Pentair rates its IntelliChlor Plus40 at 186 W for 1.4 lb of chlorine a day (Pentair). For a year-round 20,000-gallon pool at mid demand that is about $42 a year at the July 2026 US price of 18.31 cents per kWh (PC&S calculation).
Do saltwater pools need stabilizer (cyanuric acid)?
Hayward recommends 60 to 80 ppm stabilizer with its AquaRite systems (Hayward); Mahoning County Public Health cites 20 to 50 ppm (Mahoning County Public Health). Salt pools add it separately; trichlor tablets carry 0.56 lb per lb of tablet (PC&S calculation).
Why does pH rise in a saltwater pool?
Salt chlorination produces excess hydroxyl ions while releasing chlorine, which raises pH and calls for frequent acid additions, according to Mahoning County Public Health. CDC recommends keeping pH at 7.0 to 7.8 (CDC).
Are salt chlorine generators registered with the EPA?
Usually not when sold alone: EPA treats generators of a substance as devices, which need no registration unless sold with or containing a substance. An apparatus sold with salt to make a pesticide is generally a pesticide (U.S. EPA).
Can public pools use salt chlorine generators?
Yes. The 2024 MAHC permits in-line and brine generators, requires an EPA establishment number and requires salt testing at least weekly (CDC MAHC 2024).
How much chlorine does a 20,000-gallon pool use in a year?
Using EPA-accepted label doses of 1.14 to 2.0 oz of trichlor per 10,000 gallons a day and Leslie’s 3.2 oz guidance, a year-round 20,000-gallon pool uses 52.1 to 146.0 lb of tablets a year (EPA; PC&S calculation).
Inputs, formulas and caveats
- Saved Inside Airbnb’s Get the Data page on 2026-10-18 and downloaded the latest listings.csv.gz for all 34 US markets listed (scrapes 2026-09-14 to 2026-09-30).
- Kept only market, scrape date, room type, property type and amenity strings mentioning pool, salt or hot tub; deleted the full files. No listing IDs, names, hosts or coordinates were kept.
- Classified a listing as a pool listing when an amenity’s base name is Pool, Outdoor pool, Indoor pool, Private or Shared pool; read the host-entered attributes after the dash (saltwater, heated, infinity, lap pool and others).
- Computed saltwater, heated, infinity, lap and indoor shares by market and across the 34 markets, with three denominators: pool listings with detail, all pool listings and detailed private pools.
- Re-opened Wayback Machine captures of Leslie’s product pages (June to October 2026) from the PC&S equipment price panel to confirm salt system, cell, salt, tablet, stabilizer and liquid chlorine prices.
- Took chlorine demand from EPA-accepted trichlor labels and Leslie’s dosing guidance; generator power from Pentair ratings; electricity from EIA Table 5.6.A (July 2026); season length and pool volume from the DOE pool pump TSD.
- Built a 10-year sanitizer cost model (scripts/cost_model.py) for six season and demand scenarios, ran one-at-a-time sensitivity and set all inputs to each extreme for ranges, then ran it for every state.
- Read manufacturer manuals, CDC, EPA and academic sources on chemistry and wear, logged every fact in facts.csv with its URL, and ran a scripted check that every number on the page appears in facts.csv or derived.csv.
Included: Government and model-code documents (CDC, EPA, EIA, DOE, USGS, a county health department), EPA-accepted product labels, peer-reviewed papers, manufacturer manuals and SEC filings, retailer list prices captured by the Wayback Machine, and the Inside Airbnb listings files.
Excluded: Unsourced percentages on contractor and retailer pages (for example share-of-new-pool claims without a method), forum posts, AI-written roundups and any page that could not be opened. See excluded.md.
Conflicting numbers: Chlorine demand differs by label and retailer (1.14 to 3.2 oz per 10,000 gallons a day), so all three are shown as scenarios rather than one picked value. Cell life sources range from 3 to 7 years; the 5-year county figure is the base and the others bound the range. Retail prices are shown at both sale and regular levels where both were captured.
Derived metrics: All derived metrics are in derived.csv with formulas and input rows and are reproduced by scripts/analyze_listings.py, scripts/cost_model.py and scripts/build_derived.py.
Caveats
- Airbnb listings are short-term rentals concentrated in tourist and condo markets; they are not a sample of US residential pools, and saltwater is an optional attribute, so shares are lower bounds.
- Only 24.3% of pool listings carry any pool attribute, so the saltwater share depends on which hosts filled in pool details.
- The cost model is an illustration for one 20,000-gallon pool and covers sanitizer costs only; acid, shock, labour, water and repairs are excluded.
- Prices come from one national retailer’s list prices on specific capture dates; local, contractor and online marketplace prices differ.
- Salt and stabilizer top-up rates are not published by any manufacturer; the 10%, 25% and 50% scenarios are PC&S assumptions.
- The plaster and stone evidence is indirect or dated: one 2004 to 2005 test-pool protocol reported by trade press, and laboratory or deicing-salt studies.
- DOE season lengths are modeling assumptions, not observed pool use.
Method last reviewed October 18, 2026.
Press and citation
Quotable results
- In September 2026, 6.4% of Airbnb pool listings with pool details across 34 US markets were marked saltwater, and 13.9% of detailed private pools. (Inside Airbnb)
- A 20,000-gallon year-round US pool costs about $4,204 over 10 years with a salt chlorine generator and $4,106 with 3-inch chlorine tablets, at 2026 prices. (Leslie's)
- In a 4-month US pool season, a salt chlorine generator costs $1,795 to $3,071 more than chlorine tablets over 10 years. (U.S. Department of Energy)
- At the July 2026 US residential electricity price, a salt chlorine generator makes chlorine for about $0.52 a pound in electricity, against $4.00 to $6.67 for tablets. (U.S. Energy Information Administration)
- A year-round 20,000-gallon pool on chlorine tablets adds about 304 ppm of cyanuric acid a year before dilution, against a 90 ppm cap for US public pools in CDC’s 2024 model code. (Centers for Disease Control and Prevention)
- At 3,200 ppm, a saltwater pool holds about 9.1% of the salt in seawater. (U.S. Geological Survey)
- Heated pools made up 39.4% of detailed Airbnb pool listings across 34 US markets in September 2026, against 6.4% marked saltwater. (Inside Airbnb)
Primary inputs
- Get the Data: listings files for 34 US markets (CC BY 4.0), Inside Airbnb
- 2024 Model Aquatic Health Code, 5th edition, Centers for Disease Control and Prevention
- Electric Power Monthly, Table 5.6.A (July 2026), U.S. Energy Information Administration
- Dedicated-Purpose Pool Pumps Technical Support Document (2016), Tables 7.3.3 and 7.3.11, U.S. Department of Energy
- IntelliChlor Plus and LT salt chlorine generator manual, Pentair
- Product page captures: salt systems, cells, salt, tablets, stabilizer, liquid chlorine (Wayback Machine, June to October 2026), Leslie's
Media summary
Saltwater pools are chlorine pools, and over 10 years they cost about the same as chlorine tablets in year-round climates, according to a Pool Construction & Service analysis of 2026 prices and federal data. For a 20,000-gallon year-round pool, sanitizer costs total $4,204 with a salt chlorine generator and $4,106 with tablets; the gap spans -$1,829 to $4,981 depending on chlorine demand, prices and cell life. In states with 4-month pool seasons, salt costs $1,795 to $3,071 more. The salt cell, about $899 every 5 years, is the largest running cost; electricity is about $42 a year. Saltwater is still a minority feature in rentals: 6.4% of detailed Airbnb pool listings across 34 US markets, and 13.9% of detailed private pools, were marked saltwater in September 2026. Tablet pools add about 304 ppm of stabilizer a year before dilution, against a 90 ppm public-pool cap.
Possible headlines
- Salt pools cost about the same as chlorine tablets over 10 years in year-round climates
- In cold-state pool seasons, a salt system costs $1,795 to $3,071 more than tablets over a decade
- Only 6.4% of detailed Airbnb pool listings in 34 US markets say saltwater
- The salt cell, not electricity, decides whether a saltwater pool saves money
- Chlorine tablets add about 304 ppm of stabilizer a year to a year-round pool before dilution, more than three times the public-pool limit
Citation
Pool Construction & Service. "Saltwater Pool vs Chlorine: 10-Year Costs, Water Chemistry and How Common Salt Pools Are (2026 Data)." PC&S Research Desk, October 18, 2026. https://poolconstructionandservice.com/research/saltwater-pool-vs-chlorine/
License
The data tables and charts in this report are licensed under CC BY 4.0. Reuse them with this attribution: “Source: Pool Construction & Service (poolconstructionandservice.com), Saltwater Pool vs Chlorine: 10-Year Costs, Water Chemistry and How Common Salt Pools Are (2026 Data).” Figures from third-party sources remain subject to their publishers’ terms.
Comparison tables
- Saltwater, heated, indoor and infinity pool shares of Airbnb pool listings, 34 US markets, September 2026 CSV
- Saltwater vs chlorine pool: chemistry, regulation and wear matrix (2026 sources) CSV
- Cost per pound of available chlorine by source, 2026 CSV
- 10-year sanitizer cost by season and chlorine demand, 20,000-gallon pool CSV
- Sensitivity of the 10-year salt-minus-tablet difference by input CSV
- 10-year salt vs tablet cost by state, 50 states + DC CSV
- Full fact sheet with sources and limitations CSV
Evidence tiers
Tier 1: primary and government sources (15)
- Centers for Disease Control and Prevention: 2024 Model Aquatic Health Code, 5th edition
- Centers for Disease Control and Prevention: Home Pool and Hot Tub Water Treatment and Testing
- Centers for Disease Control and Prevention: Preventing Eye Irritation from Pool Chemicals
- U.S. Environmental Protection Agency: Pesticide Devices: A Guide for Consumers
- Mahoning County Public Health: Pools Equipped With a Chlorine Generator From Salt (fact sheet)
- U.S. EPA Pesticide Product Label System: Pesticide product label AW30, EPA Reg. No. 1258-1338 (accepted 2026-07-02)
- U.S. EPA Pesticide Product Label System: Master Olympic Chlorinated Tablets 3-inch label, EPA Reg. No. 42177-18
- U.S. Energy Information Administration: Electric Power Monthly, Table 5.6.A (July 2026)
- U.S. Energy Information Administration: Electric Power Monthly release schedule
- U.S. Department of Energy: Dedicated-Purpose Pool Pumps Technical Support Document (2016), Tables 7.3.3 and 7.3.11
- PubChem, National Library of Medicine: Compound properties: trichloroisocyanuric acid, cyanuric acid, chlorine, sodium chloride
- U.S. Geological Survey: Saline Water and Salinity
- Journal AWWA: Chlorinated Cyanurates: Review of Water Chemistry and Associated Drinking Water Implications (Wahman, 2018)
- Materials (MDPI): Salt Crystallization in Limestone: Materials Decay and Chemomechanical Approach (Cappai et al., 2024)
- Transportation Research Record 1250: Salt Weathering of Limestone Aggregate and Concrete Without Freeze-Thaw (Crumpton et al., 1989)
Tier 2: trade bodies, public companies, market research (11)
- Inside Airbnb: Get the Data: listings files for 34 US markets (CC BY 4.0)
- Hayward Holdings, Inc. (SEC EDGAR): Form 10-K for fiscal year 2025
- Hayward: Aqua Rite Electronic Chlorine Generator: operation and installation manual
- Hayward: AquaRite S3 manual
- Hayward: Heat pump owner's manual (51300122601)
- Hayward: How Much Salt Do You Add
- Pentair: IntelliChlor Plus and LT salt chlorine generator manual
- Pentair: IntelliChlor Plus and LT salt chlorine generators: product page and FAQ
- Pentair: IntelliChlor installation and user's guide (IC15, IC20, IC40, IC60)
- Pentair: Max-E-Therm heater installation and user's guide
- Leslie's: Product page captures: salt systems, cells, salt, tablets, stabilizer, liquid chlorine (Wayback Machine, June to October 2026)
Tier 3: journalism and expert commentary (3)
References
- Inside Airbnb. Get the Data: listings files for 34 US markets (CC BY 4.0). Accessed 2026-10-18.
- Centers for Disease Control and Prevention. 2024 Model Aquatic Health Code, 5th edition. Accessed 2026-10-18.
- Centers for Disease Control and Prevention. Home Pool and Hot Tub Water Treatment and Testing. Accessed 2026-10-18.
- Centers for Disease Control and Prevention. Preventing Eye Irritation from Pool Chemicals. Accessed 2026-10-18.
- U.S. Environmental Protection Agency. Pesticide Devices: A Guide for Consumers. Accessed 2026-10-18.
- Mahoning County Public Health. Pools Equipped With a Chlorine Generator From Salt (fact sheet). Accessed 2026-10-18.
- U.S. EPA Pesticide Product Label System. Pesticide product label AW30, EPA Reg. No. 1258-1338 (accepted 2026-07-02). Accessed 2026-10-18.
- U.S. EPA Pesticide Product Label System. Master Olympic Chlorinated Tablets 3-inch label, EPA Reg. No. 42177-18. Accessed 2026-10-18.
- U.S. Energy Information Administration. Electric Power Monthly, Table 5.6.A (July 2026). Accessed 2026-10-18.
- U.S. Energy Information Administration. Electric Power Monthly release schedule. Accessed 2026-10-18.
- U.S. Department of Energy. Dedicated-Purpose Pool Pumps Technical Support Document (2016), Tables 7.3.3 and 7.3.11. Accessed 2026-10-18.
- PubChem, National Library of Medicine. Compound properties: trichloroisocyanuric acid, cyanuric acid, chlorine, sodium chloride. Accessed 2026-10-18.
- U.S. Geological Survey. Saline Water and Salinity. Accessed 2026-10-18.
- Journal AWWA. Chlorinated Cyanurates: Review of Water Chemistry and Associated Drinking Water Implications (Wahman, 2018). Accessed 2026-10-18.
- Materials (MDPI). Salt Crystallization in Limestone: Materials Decay and Chemomechanical Approach (Cappai et al., 2024). Accessed 2026-10-18.
- Transportation Research Record 1250. Salt Weathering of Limestone Aggregate and Concrete Without Freeze-Thaw (Crumpton et al., 1989). Accessed 2026-10-18.
- Hayward Holdings, Inc. (SEC EDGAR). Form 10-K for fiscal year 2025. Accessed 2026-10-18.
- Hayward. Aqua Rite Electronic Chlorine Generator: operation and installation manual. Accessed 2026-10-18.
- Hayward. AquaRite S3 manual. Accessed 2026-10-18.
- Hayward. Heat pump owner's manual (51300122601). Accessed 2026-10-18.
- Hayward. How Much Salt Do You Add. Accessed 2026-10-18.
- Pentair. IntelliChlor Plus and LT salt chlorine generator manual. Accessed 2026-10-18.
- Pentair. IntelliChlor Plus and LT salt chlorine generators: product page and FAQ. Accessed 2026-10-18.
- Pentair. IntelliChlor installation and user's guide (IC15, IC20, IC40, IC60). Accessed 2026-10-18.
- Pentair. Max-E-Therm heater installation and user's guide. Accessed 2026-10-18.
- Leslie's. Product page captures: salt systems, cells, salt, tablets, stabilizer, liquid chlorine (Wayback Machine, June to October 2026). Accessed 2026-10-18.
- AQUA Magazine. Scratching The Surface (Cal Poly NPIRC plaster study report), 2006. Accessed 2026-10-18.
- AQUA Magazine. While chlorine generators have swept the industry, background knowledge still lacks, 2009. Accessed 2026-10-18.
- EZ Test Pools. Extending the Life of Your Hayward Salt System Cell. Accessed 2026-10-18.
Related pool research
Cost to Run a Pool Pump by State: July 2026 Electricity Prices, Single-Speed vs Variable-Speed
Cost to Heat a Pool: Gas Heater vs Heat Pump by State, 2026
Pool Chemical Prices: A Producer Price Index for Chlorine, Trichlor Inputs and Acid, 2019 to 2026
Pool Property Tax: How 18 Major Pool-Market Counties Assess a New Pool, 2026 Ledger
Average cost to build a pool: what 2025 building permits show in 11 US cities and counties
Does a Pool Add Value to a Home? US Pool Premium Estimates Reconciled
All pool industry research (48 reports)