Pool Drowning Statistics by State: Deaths and Rates, 2018 to 2024
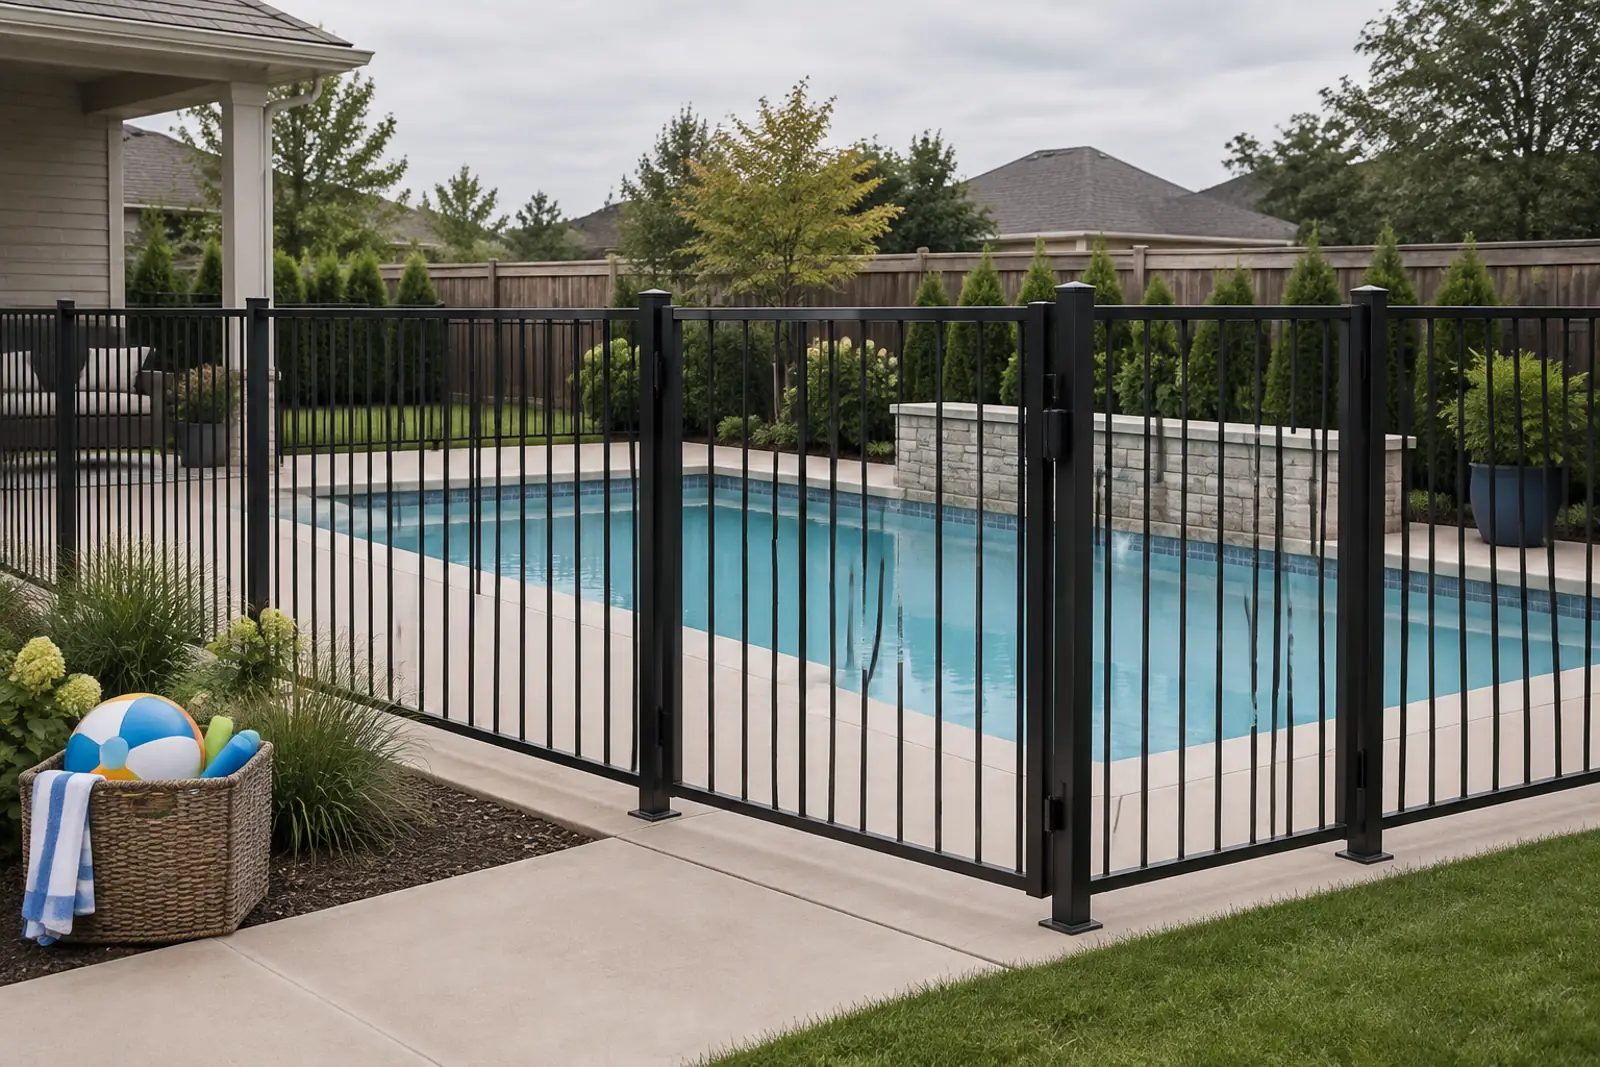
Pool drowning statistics by state, from CDC death records for 2018 to 2024, show 5,616 US residents died in swimming pools, about 802 a year, including 1,857 children ages 1 to 4. Florida had the most deaths (1,027) and the highest rate, 6.65 per million residents a year, followed by Arizona at 6.15.
Pool drowning statistics by state: deaths and rates, 2018 to 2024
Pool drowning deaths are concentrated in a handful of warm-weather states, but the ranking changes once population is taken into account. Florida leads on both counts, Arizona has almost the same rate with a third of Florida’s deaths, and 36 of 51 jurisdictions have enough deaths for a reliable rate.
Deaths by state of residence. US rate: 2.42.
Source: CDC WONDER, Underlying Cause of Death 2018-2024 (ICD-10 W67-W68); PC&S calculations. Download chart data (CSV)
Florida recorded 1,027 pool drowning deaths of state residents from 2018 to 2024, the most of any state and 18.3% of the US total, according to CDC WONDER.
Florida’s pool drowning rate of 6.65 deaths per 1 million residents per year (2018 to 2024) was the highest in the United States and 2.7 times the national rate of 2.42 (CDC WONDER).
Arizona had the second-highest rate, 6.15 per 1 million per year, from 317 deaths in 2018 to 2024. Nevada (4.58), Hawaii (3.90), Alabama (3.59) and Louisiana (3.40) followed (CDC WONDER).
California (805 deaths) and Texas (639 deaths) ranked second and third by count, but their rates of 2.93 and 3.07 per 1 million per year placed them ninth and eighth by rate in 2018 to 2024 (CDC WONDER).
Florida, California, Texas and Arizona together accounted for 2,788 pool drowning deaths, or 49.6% of the 2018 to 2024 US total (CDC WONDER).
The lowest reliable rate was in Massachusetts, at 0.86 deaths per 1 million per year in 2018 to 2024, so Florida’s rate was 7.7 times higher (CDC WONDER).
| State | Abbr | Census region | Sun Belt (PC&S grouping) | Pool drowning deaths 2018-2024 | Average per year | Rate per 1 million per year | 95% CI low | 95% CI high | Rate reliability | Rank (reliable rates only) | Under-5 pool drowning deaths 2018-2024 | Under-5 rate per 100,000 children per year | Under-5 rate reliability | All unintentional drowning deaths 2018-2024 (W65-W74) | Pool share of unintentional drownings (%) | Unspecified drowning deaths (W74) 2018-2024 | Pool drowning deaths 2025 (provisional) |
|---|---|---|---|---|---|---|---|---|---|---|---|---|---|---|---|---|---|
| Alabama | AL | South | Yes | 126 | 18.0 | 3.59 | 2.96 | 4.22 | reliable | 5 | 53 | 2.59 | reliable | 546 | 23.1 | 96 | 13 |
| Alaska | AK | West | No | suppressed | suppressed | suppressed | suppressed | suppressed | suppressed | suppressed | suppressed | suppressed | 139 | suppressed | 14 | 0 | |
| Arizona | AZ | West | Yes | 317 | 45.3 | 6.15 | 5.48 | 6.83 | reliable | 2 | 109 | 3.79 | reliable | 803 | 39.5 | 64 | 53 |
| Arkansas | AR | South | Yes | 59 | 8.4 | 2.77 | 2.11 | 3.57 | reliable | 11 | 27 | 2.1 | reliable | 348 | 17.0 | 21 | 11 |
| California | CA | West | Yes | 805 | 115.0 | 2.93 | 2.72 | 3.13 | reliable | 9 | 213 | 1.36 | reliable | 3141 | 25.6 | 235 | 130 |
| Colorado | CO | West | No | 50 | 7.1 | 1.23 | 0.91 | 1.62 | reliable | 31 | suppressed | suppressed | suppressed | 504 | 9.9 | 72 | suppressed |
| Connecticut | CT | Northeast | No | 27 | 3.9 | 1.07 | 0.71 | 1.56 | reliable | 33 | 10 | 0.79 | unreliable | 167 | 16.2 | 16 | suppressed |
| Delaware | DE | South | No | 14 | 2.0 | 1.99 | 1.09 | 3.34 | unreliable | suppressed | suppressed | suppressed | 59 | 23.7 | suppressed | suppressed | |
| District of Columbia | DC | South | No | suppressed | suppressed | suppressed | suppressed | suppressed | suppressed | suppressed | suppressed | suppressed | 41 | suppressed | suppressed | suppressed | |
| Florida | FL | South | Yes | 1027 | 146.7 | 6.65 | 6.24 | 7.05 | reliable | 1 | 304 | 3.84 | reliable | 3161 | 32.5 | 261 | 162 |
| Georgia | GA | South | Yes | 219 | 31.3 | 2.89 | 2.51 | 3.27 | reliable | 10 | 81 | 1.8 | reliable | 973 | 22.5 | 100 | 30 |
| Hawaii | HI | West | No | 39 | 5.6 | 3.9 | 2.77 | 5.33 | reliable | 4 | 13 | 2.27 | unreliable | 322 | 12.1 | 20 | suppressed |
| Idaho | ID | West | No | suppressed | suppressed | suppressed | suppressed | suppressed | suppressed | suppressed | suppressed | suppressed | 162 | suppressed | suppressed | suppressed | |
| Illinois | IL | Midwest | No | 112 | 16.0 | 1.27 | 1.03 | 1.5 | reliable | 29 | 40 | 0.81 | reliable | 837 | 13.4 | 82 | 21 |
| Indiana | IN | Midwest | No | 79 | 11.3 | 1.66 | 1.31 | 2.07 | reliable | 20 | 33 | 1.15 | reliable | 518 | 15.3 | 129 | 14 |
| Iowa | IA | Midwest | No | 21 | 3.0 | 0.94 | 0.58 | 1.44 | reliable | 35 | suppressed | suppressed | suppressed | 216 | 9.7 | 11 | suppressed |
| Kansas | KS | Midwest | No | 34 | 4.9 | 1.66 | 1.15 | 2.32 | reliable | 21 | suppressed | suppressed | suppressed | 225 | 15.1 | 44 | suppressed |
| Kentucky | KY | South | No | 61 | 8.7 | 1.93 | 1.48 | 2.48 | reliable | 17 | 38 | 2.03 | reliable | 395 | 15.4 | 112 | 11 |
| Louisiana | LA | South | Yes | 110 | 15.7 | 3.4 | 2.77 | 4.04 | reliable | 6 | 51 | 2.52 | reliable | 636 | 17.3 | 125 | 25 |
| Maine | ME | Northeast | No | suppressed | suppressed | suppressed | suppressed | suppressed | suppressed | suppressed | suppressed | suppressed | 130 | suppressed | suppressed | suppressed | |
| Maryland | MD | South | No | 59 | 8.4 | 1.37 | 1.05 | 1.77 | reliable | 26 | 17 | 0.68 | unreliable | 389 | 15.2 | 47 | suppressed |
| Massachusetts | MA | Northeast | No | 42 | 6.0 | 0.86 | 0.62 | 1.16 | reliable | 36 | suppressed | suppressed | suppressed | 380 | 11.1 | 74 | suppressed |
| Michigan | MI | Midwest | No | 90 | 12.9 | 1.28 | 1.03 | 1.58 | reliable | 28 | 28 | 0.73 | reliable | 766 | 11.7 | 81 | 19 |
| Minnesota | MN | Midwest | No | 49 | 7.0 | 1.23 | 0.91 | 1.63 | reliable | 30 | 12 | 0.51 | unreliable | 428 | 11.4 | 24 | suppressed |
| Mississippi | MS | South | Yes | 57 | 8.1 | 2.75 | 2.09 | 3.57 | reliable | 12 | 24 | 1.92 | reliable | 329 | 17.3 | 27 | 12 |
| Missouri | MO | Midwest | No | 94 | 13.4 | 2.18 | 1.76 | 2.66 | reliable | 15 | 31 | 1.23 | reliable | 518 | 18.1 | 60 | suppressed |
| Montana | MT | West | No | suppressed | suppressed | suppressed | suppressed | suppressed | suppressed | suppressed | suppressed | suppressed | 153 | suppressed | 26 | suppressed | |
| Nebraska | NE | Midwest | No | suppressed | suppressed | suppressed | suppressed | suppressed | suppressed | suppressed | suppressed | suppressed | 118 | suppressed | 12 | 0 | |
| Nevada | NV | West | Yes | 101 | 14.4 | 4.58 | 3.69 | 5.48 | reliable | 3 | 25 | 2.0 | reliable | 337 | 30.0 | 31 | 20 |
| New Hampshire | NH | Northeast | No | 12 | 1.7 | 1.24 | 0.64 | 2.17 | unreliable | suppressed | suppressed | suppressed | 114 | 10.5 | suppressed | suppressed | |
| New Jersey | NJ | Northeast | No | 124 | 17.7 | 1.94 | 1.6 | 2.28 | reliable | 16 | 41 | 1.13 | reliable | 467 | 26.6 | 72 | 13 |
| New Mexico | NM | West | Yes | 24 | 3.4 | 1.62 | 1.04 | 2.42 | reliable | 23 | suppressed | suppressed | suppressed | 226 | 10.6 | 12 | suppressed |
| New York | NY | Northeast | No | 181 | 25.9 | 1.32 | 1.13 | 1.51 | reliable | 27 | 43 | 0.56 | reliable | 933 | 19.4 | 106 | 31 |
| North Carolina | NC | South | Yes | 138 | 19.7 | 1.85 | 1.54 | 2.16 | reliable | 18 | 52 | 1.23 | reliable | 806 | 17.1 | 91 | 25 |
| North Dakota | ND | Midwest | No | suppressed | suppressed | suppressed | suppressed | suppressed | suppressed | 0 | 0.0 | unreliable | 56 | suppressed | suppressed | suppressed | |
| Ohio | OH | Midwest | No | 137 | 19.6 | 1.67 | 1.39 | 1.94 | reliable | 19 | 57 | 1.21 | reliable | 857 | 16.0 | 92 | 22 |
| Oklahoma | OK | South | Yes | 92 | 13.1 | 3.28 | 2.65 | 4.02 | reliable | 7 | 41 | 2.35 | reliable | 502 | 18.3 | 43 | suppressed |
| Oregon | OR | West | No | 19 | 2.7 | 0.64 | 0.39 | 1.0 | unreliable | suppressed | suppressed | suppressed | 391 | 4.9 | 10 | suppressed | |
| Pennsylvania | PA | Northeast | No | 134 | 19.1 | 1.48 | 1.23 | 1.73 | reliable | 24 | 44 | 0.92 | reliable | 718 | 18.7 | 104 | 16 |
| Rhode Island | RI | Northeast | No | 10 | 1.4 | 1.32 | 0.63 | 2.43 | unreliable | suppressed | suppressed | suppressed | 79 | 12.7 | 29 | 0 | |
| South Carolina | SC | South | Yes | 89 | 12.7 | 2.42 | 1.94 | 2.98 | reliable | 14 | 32 | 1.57 | reliable | 535 | 16.6 | 78 | 16 |
| South Dakota | SD | Midwest | No | suppressed | suppressed | suppressed | suppressed | suppressed | suppressed | suppressed | suppressed | suppressed | 82 | suppressed | suppressed | suppressed | |
| Tennessee | TN | South | Yes | 126 | 18.0 | 2.58 | 2.13 | 3.03 | reliable | 13 | 57 | 1.99 | reliable | 661 | 19.1 | 78 | 18 |
| Texas | TX | South | Yes | 639 | 91.3 | 3.07 | 2.83 | 3.3 | reliable | 8 | 246 | 1.79 | reliable | 2773 | 23.0 | 479 | 95 |
| Utah | UT | West | No | 38 | 5.4 | 1.63 | 1.16 | 2.24 | reliable | 22 | 13 | 0.78 | unreliable | 260 | 14.6 | 29 | suppressed |
| Vermont | VT | Northeast | No | suppressed | suppressed | suppressed | suppressed | suppressed | suppressed | suppressed | suppressed | suppressed | 49 | suppressed | suppressed | suppressed | |
| Virginia | VA | South | No | 87 | 12.4 | 1.44 | 1.15 | 1.77 | reliable | 25 | 29 | 0.84 | reliable | 626 | 13.9 | 66 | 25 |
| Washington | WA | West | No | 58 | 8.3 | 1.07 | 0.81 | 1.38 | reliable | 32 | 14 | 0.46 | unreliable | 724 | 8.0 | 28 | suppressed |
| West Virginia | WV | South | No | 18 | 2.6 | 1.44 | 0.85 | 2.28 | unreliable | 10 | 1.59 | unreliable | 175 | 10.3 | suppressed | suppressed | |
| Wisconsin | WI | Midwest | No | 43 | 6.1 | 1.05 | 0.76 | 1.41 | reliable | 34 | suppressed | suppressed | suppressed | 446 | 9.6 | 17 | suppressed |
| Wyoming | WY | West | No | suppressed | suppressed | suppressed | suppressed | suppressed | suppressed | 0 | 0.0 | unreliable | 47 | suppressed | suppressed | 0 |
Source: CDC WONDER, Underlying Cause of Death 2018-2024, ICD-10 W67-W68; PC&S calculations. 2025: CDC WONDER provisional data (as of 2026-09-27). Download CSV
95% confidence intervals are in the CSV. Florida's and Arizona's intervals overlap.
Source: CDC WONDER, Underlying Cause of Death 2018-2024 (ICD-10 W67-W68); PC&S calculations. Download chart data (CSV)
Child pool drowning rates by state: children under 5
Young children carry most of the pool drowning risk. Florida and Arizona have nearly identical under-5 rates, both about 2.7 times the national figure, and the pool share of toddler drownings is far higher than the pool share at other ages.
Across the United States, 1,871 children under 5 died in pool drownings from 2018 to 2024, a rate of 1.41 deaths per 100,000 children under 5 per year (CDC WONDER).
Florida’s under-5 pool drowning rate was 3.84 per 100,000 children per year in 2018 to 2024, and Arizona’s was 3.79, the two highest of the 24 states with a reliable under-5 rate (CDC WONDER).
Alabama (2.59), Louisiana (2.52) and Oklahoma (2.35) had the next-highest under-5 rates per 100,000 in 2018 to 2024 (CDC WONDER).
New York had the lowest reliable under-5 rate, 0.56 per 100,000, so Florida’s rate was 6.9 times New York’s in 2018 to 2024 (CDC WONDER).
US under-5 rate: 1.41.
Source: CDC WONDER, Underlying Cause of Death 2018-2024 (ICD-10 W67-W68); PC&S calculations. Download chart data (CSV)
In Arizona, 80.7% of unintentional drowning deaths among children ages 1 to 4 in 2018 to 2024 were coded as pool drownings (109 of 135). The share was 67.1% in Florida and 67.9% in California (CDC WONDER).
Regional patterns: Sun Belt states versus the rest of the US
The pool drowning burden is regional. The South holds just over half of US pool drowning deaths with under two-fifths of the population, and a 15-state Sun Belt grouping has a rate 2.6 times that of the remaining states. The gap narrows but holds without Florida.
The Census South region recorded 2,930 pool drowning deaths in 2018 to 2024, 52.2% of the US total, while holding 38.5% of the population (CDC WONDER; regions per the U.S. Census Bureau).
The South Atlantic division had the highest divisional rate, 3.54 per 1 million per year, and New England had the lowest, 0.94 (CDC WONDER).
The 15 Sun Belt states in this report recorded 3,929 pool drowning deaths in 2018 to 2024, 70.0% of the US total, with 47.3% of the population. Their rate of 3.57 per 1 million per year compares with 1.38 in the other 35 states and DC (CDC WONDER).
Excluding Florida, the Sun Belt rate was 3.07 per 1 million per year, still 2.2 times the rest of the US in 2018 to 2024 (CDC WONDER).
| Grouping | Area | Pool drowning deaths 2018-2024 | Population (person-years) | Rate per 1 million per year | Share of US pool drowning deaths (%) | Share of US population (%) |
|---|---|---|---|---|---|---|
| Census region | Census Region 1: Northeast | 538 | 396960447 | 1.36 | 9.6 | 17.1 |
| Census region | Census Region 2: Midwest | 678 | 481089398 | 1.41 | 12.1 | 20.7 |
| Census region | Census Region 3: South | 2930 | 895729654 | 3.27 | 52.2 | 38.5 |
| Census region | Census Region 4: West | 1470 | 551318766 | 2.67 | 26.2 | 23.7 |
| Census division | Division 1: New England | 99 | 105313970 | 0.94 | 1.8 | 4.5 |
| Census division | Division 2: Middle Atlantic | 439 | 291646477 | 1.51 | 7.8 | 12.5 |
| Census division | Division 3: East North Central | 461 | 329736403 | 1.4 | 8.2 | 14.2 |
| Census division | Division 4: West North Central | 217 | 151352995 | 1.43 | 3.9 | 6.5 |
| Census division | Division 5: South Atlantic | 1660 | 469441883 | 3.54 | 29.6 | 20.2 |
| Census division | Division 6: East South Central | 370 | 136211520 | 2.72 | 6.6 | 5.9 |
| Census division | Division 7: West South Central | 900 | 290076251 | 3.1 | 16.0 | 12.5 |
| Census division | Division 8: Mountain | 543 | 177289836 | 3.06 | 9.7 | 7.6 |
| Census division | Division 9: Pacific | 927 | 374028930 | 2.48 | 16.5 | 16.1 |
| PC&S grouping | Sun Belt (15 states) | 3929 | 1099838348 | 3.57 | 70.0 | 47.3 |
| PC&S grouping | Rest of US (35 states + DC) | 1687 | 1225259917 | 1.38 | 30.0 | 52.7 |
| PC&S grouping | Sun Belt excluding Florida (14 states) | 2902 | 945319082 | 3.07 | 51.7 | 40.7 |
Source: CDC WONDER, Underlying Cause of Death 2018-2024, ICD-10 W67-W68; PC&S calculations. Regions: U.S. Census Bureau. Download CSV
Which ages drown in pools: toddlers first, older adults second
Children ages 1 to 4 make up 4.6% of the population but one-third of pool drowning deaths. The rate falls to its lowest point in young adulthood, then rises steadily with age and passes the rate for ages 5 to 14 from age 65, a pattern that child-focused statistics tend to hide.
CDC reports that drowning kills more US children ages 1 to 4 than any other cause of death, and CDC states that most drownings at those ages happen in swimming pools.
Children ages 1 to 4 accounted for 1,857 of the 5,616 US pool drowning deaths in 2018 to 2024, or 33.1% (CDC WONDER).
The ages 1 to 4 pool drowning rate was 1.73 per 100,000 children per year (17.31 per 1 million), 7.2 times the all-ages rate, in 2018 to 2024 (CDC WONDER).
Age 2 was the peak single year of age: 719 two-year-olds died in pool drownings in 2018 to 2024, a rate of 2.70 per 100,000 per year and 38.7% of all deaths at ages 1 to 4 (CDC WONDER).
Adults 65 and older accounted for 1,338 pool drowning deaths, 23.8% of the 2018 to 2024 total. The rate reached 5.72 per 1 million per year at ages 85 and older (CDC WONDER).
Males accounted for 69.3% of pool drowning deaths in the United States in 2018 to 2024 (CDC WONDER).
Source: CDC WONDER, Underlying Cause of Death 2018-2024 (ICD-10 W67-W68); PC&S calculations. Download chart data (CSV)
| Age group | Pool drowning deaths 2018-2024 | Population (person-years) | Rate per 1 million per year | Share of all pool drowning deaths (%) | All unintentional drowning deaths (W65-W74) | Pool share of unintentional drownings (%) |
|---|---|---|---|---|---|---|
| < 1 year | 14 | 25878128 | 0.54 | 0.2 | 258 | 5.4 |
| 1-4 years | 1857 | 107286287 | 17.31 | 33.1 | 3120 | 59.5 |
| 5-14 years | 597 | 287785979 | 2.07 | 10.6 | 1580 | 37.8 |
| 15-24 years | 339 | 304328641 | 1.11 | 6.0 | 3205 | 10.6 |
| 25-34 years | 305 | 320700526 | 0.95 | 5.4 | 3461 | 8.8 |
| 35-44 years | 335 | 302102360 | 1.11 | 6.0 | 3384 | 9.9 |
| 45-54 years | 352 | 285266952 | 1.23 | 6.3 | 3175 | 11.1 |
| 55-64 years | 477 | 295529487 | 1.61 | 8.5 | 3694 | 12.9 |
| 65-74 years | 565 | 232109954 | 2.43 | 10.1 | 3370 | 16.8 |
| 75-84 years | 516 | 119210323 | 4.33 | 9.2 | 2145 | 24.1 |
| 85+ years | 257 | 44899628 | 5.72 | 4.6 | 866 | 29.7 |
Source: CDC WONDER, Underlying Cause of Death 2018-2024, ICD-10 W67-W68; PC&S calculations. Download CSV
Are pool drownings increasing? The national trend, 2018 to 2025
Recorded pool drowning deaths rose by about 13.8% between 2018 to 2020 and 2022 to 2024, and 2024 was the highest year in the series. Part of that rise coincides with fewer deaths coded as unspecified drowning, so the true increase is likely smaller than the raw counts suggest.
US pool drowning deaths rose from 746 in 2018 to 881 in 2024, an increase of 135 deaths or 18.1% (CDC WONDER).
The pool drowning rate rose from 2.28 to 2.59 deaths per 1 million between 2018 and 2024 (CDC WONDER).
Provisional data count 872 pool drowning deaths in 2025, a rate of 2.56 per 1 million, close to the 2024 level (CDC WONDER provisional data, as of 2026-09-27).
Over the same years, deaths coded as unspecified drowning (W74) fell from 541 to 370, a drop of 171 deaths, and the W74 share of unintentional drownings fell from 14.6% to 8.8% (CDC WONDER).
Pool drowning deaths among children ages 1 to 4 were 262 in 2018 and 289 in 2024, a rate of 1.64 and 1.93 per 100,000 children respectively. The provisional 2025 count is 267 (CDC WONDER provisional data).
CDC’s broader drowning series shows a similar post-2019 rise: unintentional drowning deaths including boating rose from 4,067 in 2019 to 4,509 in 2022, and the ages 1 to 4 rate rose 28.3%, from 2.4 to 3.1 per 100,000 (CDC MMWR).
2025 is provisional.
Source: CDC WONDER, Underlying Cause of Death 2018-2024 (ICD-10 W67-W68); PC&S calculations; 2025: CDC WONDER provisional (as of 2026-09-27). Download chart data (CSV)
| Year | Data status | Pool drowning deaths (W67-W68) | W67 in pool | W68 fall into pool | Rate per 1 million | Ages 1-4 pool drowning deaths | Ages 1-4 rate per 100,000 | All unintentional drowning deaths (W65-W74) | Pool share of unintentional drownings (%) | Unspecified drowning deaths (W74) | W74 share of unintentional drownings (%) |
|---|---|---|---|---|---|---|---|---|---|---|---|
| 2018 | final | 746 | 691 | 55 | 2.28 | 262 | 1.64 | 3710 | 20.1 | 541 | 14.6 |
| 2019 | final | 747 | 703 | 44 | 2.28 | 219 | 1.39 | 3692 | 20.2 | 408 | 11.1 |
| 2020 | final | 740 | 708 | 32 | 2.25 | 252 | 1.62 | 4177 | 17.7 | 496 | 11.9 |
| 2021 | final | 841 | 791 | 50 | 2.53 | 279 | 1.83 | 4337 | 19.4 | 521 | 12.0 |
| 2022 | final | 840 | 794 | 46 | 2.52 | 266 | 1.79 | 4168 | 20.2 | 447 | 10.7 |
| 2023 | final | 821 | 772 | 49 | 2.45 | 290 | 1.95 | 3983 | 20.6 | 391 | 9.8 |
| 2024 | final | 881 | 823 | 58 | 2.59 | 289 | 1.93 | 4201 | 21.0 | 370 | 8.8 |
| 2025 | provisional | 872 | 828 | 44 | 2.56 | 267 | 1.78 | 3998 | 21.8 | 371 | 9.3 |
Source: CDC WONDER, Underlying Cause of Death 2018-2024, ICD-10 W67-W68; PC&S calculations. 2025: CDC WONDER provisional data (as of 2026-09-27). Download CSV
What month do most pool drownings happen
Pool drowning deaths follow the swimming season closely. July is the peak month in every year of the series except 2024, when June was slightly higher, and the three summer months hold more than half of all deaths.
July accounted for 22.0% of US pool drowning deaths in 2018 to 2024, an average of 176.3 deaths per July, compared with 22.3 per January (CDC WONDER).
June, July and August together accounted for 55.6% of pool drowning deaths in 2018 to 2024, and May through September for 74.5% (CDC WONDER).
In the provisional 2025 data, June to August held 58.6% of pool drowning deaths (CDC WONDER provisional data).
Source: CDC WONDER, Underlying Cause of Death 2018-2024 (ICD-10 W67-W68); PC&S calculations. Download chart data (CSV)
Where child drownings happen: homes, backyard pools and visitors
For young children the risk sits mostly at home. CPSC case reports place most child pool and spa deaths at residences, Texas child fatality tracking points to backyard pools, and Florida, Arizona and Nevada record more pool drowning deaths by place of occurrence than by residence.
From 2021 to 2023, 71% of reported pool or spa drowning deaths of children under 15 occurred in residential settings, and 51% at the child’s own home (CPSC 2026 report).
For children under 5, 60% of reported pool or spa drowning deaths in 2021 to 2023 occurred at the child’s home and 19% at the home of family, friends or acquaintances (CPSC 2026 report).
For children 5 to 9, public, community or business locations accounted for 35% of reported pool or spa drowning deaths in 2021 to 2023 (CPSC 2026 report).
In-ground pools accounted for 52% of reported child pool or spa drowning deaths in 2021 to 2023 and above-ground pools for 15% (CPSC 2026 report).
In Texas, 49 of the 88 child drownings tracked by the state in 2025 (55.7%) happened in pools, 36 of them in backyard pools (Texas DFPS; PC&S count of the published incident list).
| Incident location | Under 5 (%) | Ages 5 to 9 (%) | Ages 10 to 14 (%) | All under 15 (%) |
|---|---|---|---|---|
| Home | 60 | 22 | 21 | 51 |
| Family, friend or acquaintance's home | 19 | 3 | 1 | 15 |
| Neighbor's home | 5 | 7 | 1 | 5 |
| Public, community or business location | 8 | 35 | 40 | 15 |
| Undisclosed location | 8 | 33 | 36 | 14 |
Source: CPSC, Pool or Spa Submersion 2026 Report, Table 10. Download CSV
Pool drowning deaths that occurred in Florida in 2018 to 2024 (1,178) exceeded deaths of Florida residents (1,027) by 151, or 14.7% (CDC WONDER, place of occurrence).
The reverse held for New York: 130 pool drowning deaths occurred in the state in 2018 to 2024, 51 fewer than the 181 deaths of New York residents (CDC WONDER, place of occurrence).
| State | Pool drowning deaths of state residents 2018-2024 | Pool drowning deaths occurring in the state 2018-2024 | Difference (occurrence minus residence) | Difference (%) |
|---|---|---|---|---|
| Florida | 1027 | 1178 | 151 | 14.7 |
| California | 805 | 801 | -4 | -0.5 |
| Texas | 639 | 636 | -3 | -0.5 |
| Arizona | 317 | 340 | 23 | 7.3 |
| Georgia | 219 | 209 | -10 | -4.6 |
| New York | 181 | 130 | -51 | -28.2 |
| North Carolina | 138 | 129 | -9 | -6.5 |
| Alabama | 126 | 127 | 1 | 0.8 |
| Tennessee | 126 | 125 | -1 | -0.8 |
| New Jersey | 124 | 124 | 0 | 0.0 |
| Pennsylvania | 134 | 124 | -10 | -7.5 |
| Ohio | 137 | 122 | -15 | -10.9 |
| Nevada | 101 | 117 | 16 | 15.8 |
| Louisiana | 110 | 111 | 1 | 0.9 |
| Illinois | 112 | 100 | -12 | -10.7 |
| Oklahoma | 92 | 99 | 7 | 7.6 |
| South Carolina | 89 | 95 | 6 | 6.7 |
| Missouri | 94 | 93 | -1 | -1.1 |
| Michigan | 90 | 77 | -13 | -14.4 |
| Virginia | 87 | 77 | -10 | -11.5 |
| Indiana | 79 | 72 | -7 | -8.9 |
| Arkansas | 59 | 53 | -6 | -10.2 |
| Maryland | 59 | 53 | -6 | -10.2 |
| Kentucky | 61 | 51 | -10 | -16.4 |
| Mississippi | 57 | 50 | -7 | -12.3 |
| Hawaii | 39 | 49 | 10 | 25.6 |
| Colorado | 50 | 48 | -2 | -4.0 |
| Washington | 58 | 45 | -13 | -22.4 |
| Minnesota | 49 | 42 | -7 | -14.3 |
| Massachusetts | 42 | 37 | -5 | -11.9 |
| Wisconsin | 43 | 36 | -7 | -16.3 |
| Utah | 38 | 35 | -3 | -7.9 |
| Kansas | 34 | 30 | -4 | -11.8 |
| Connecticut | 27 | 23 | -4 | -14.8 |
| New Mexico | 24 | 21 | -3 | -12.5 |
Source: CDC WONDER (D176), residence and occurrence state, final 2018-2024 data; PC&S calculations. Download CSV
State profiles: Florida, Arizona, Nevada, Texas and California
The five profiles cover the two highest-rate states, the third-highest rate, and the two largest states by deaths. Residential pool barrier law status is shown only where PC&S could read the statute on the state legislature’s website; other states’ laws were not verified and are not listed.
Florida. Florida recorded 1,027 resident pool drowning deaths in 2018 to 2024 (146.7 a year), a rate of 6.65 per 1 million per year (95% CI 6.24 to 7.05) (CDC WONDER).
Florida’s under-5 pool drowning rate was 3.84 per 100,000 children per year, and pool drownings were 32.5% of the state’s unintentional drowning deaths in 2018 to 2024 (CDC WONDER). Provisional data count 162 Florida pool drowning deaths in 2025 (CDC WONDER provisional data).
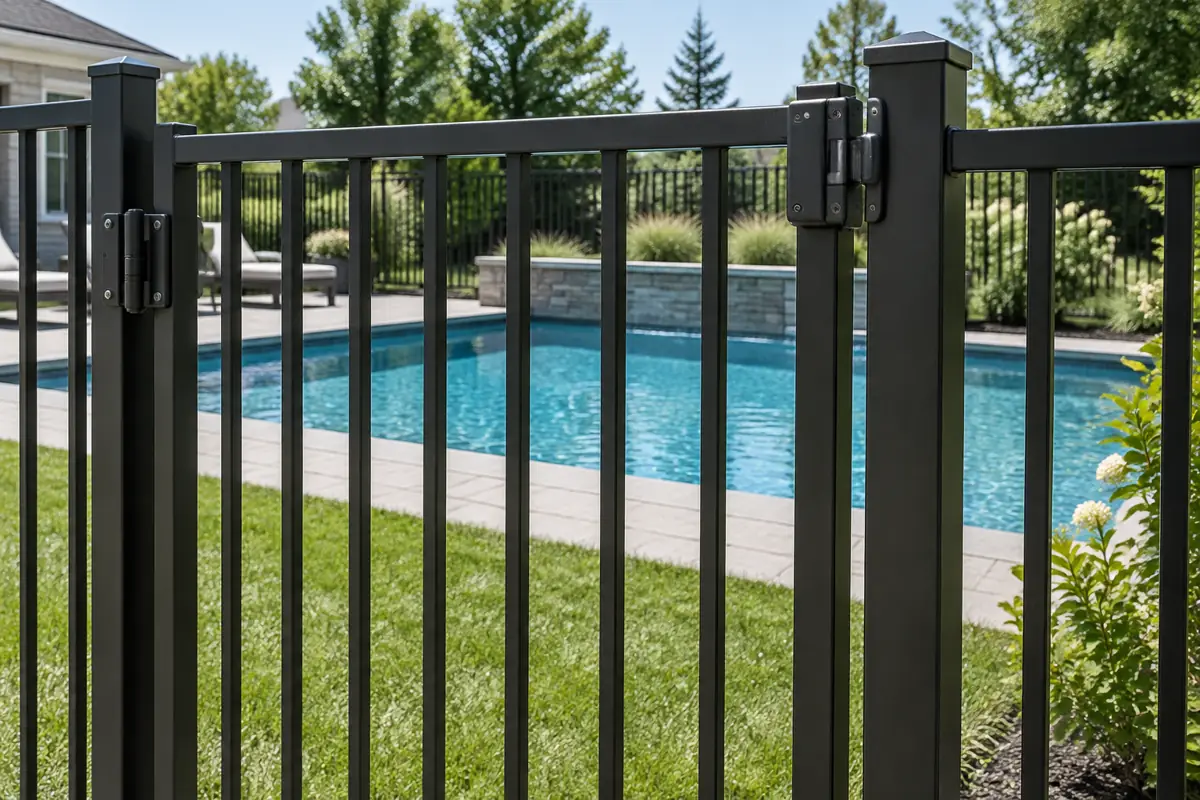
The Florida Department of Health reports that more than 500 Floridians died from unintentional drowning in 2023. Florida’s Residential Swimming Pool Safety Act requires a new residential pool to have at least one of five listed safety features, such as a barrier, an approved safety cover or door alarms, to pass final inspection (Florida Statutes s. 515.27).
Arizona. Arizona recorded 317 resident pool drowning deaths in 2018 to 2024, a rate of 6.15 per 1 million per year (95% CI 5.48 to 6.83), and an under-5 rate of 3.79 per 100,000 (CDC WONDER).
Arizona’s pool drowning deaths rose from 113 in 2018 to 2020 to 158 in 2022 to 2024, an increase of 39.8% (CDC WONDER). The Arizona Department of Health Services reports a 2023 drowning rate (all water types) of 4.6 per 100,000 children ages 0 to 4.
Arizona’s pool enclosure statute requires a barrier at least five feet high around a residential pool, with exemptions that include homes where all residents are at least six years old and areas with their own equal or stricter local ordinances (Arizona Revised Statutes s. 36-1681).
Nevada. Nevada recorded 101 resident pool drowning deaths in 2018 to 2024, a rate of 4.58 per 1 million per year, the third-highest. Pool drownings occurring in Nevada numbered 117, 15.8% more than resident deaths (CDC WONDER; occurrence data from CDC WONDER D176).
Texas. Texas recorded 639 resident pool drowning deaths in 2018 to 2024, the third-highest count, at a rate of 3.07 per 1 million per year (CDC WONDER). Texas also had 479 deaths coded as unspecified drowning, 17.3% of its unintentional drownings, above the national 11.2%, so the Texas pool count is likely an undercount (CDC WONDER).
Texas DFPS lists 68 child drownings in Texas for 2026 as of September 17, 2026 (Texas DFPS).
California. California recorded 805 resident pool drowning deaths in 2018 to 2024, the second-highest count, but a rate of 2.93 per 1 million per year and an under-5 rate of 1.36 per 100,000 (CDC WONDER).
California’s Swimming Pool Safety Act requires a new or remodeled pool or spa at a private single-family home to have at least two of seven drowning prevention safety features (California Health and Safety Code s. 115922).
Two federal counts of child pool drownings: CDC death records and CPSC reports
Journalists often quote the CPSC child count and the CDC death-certificate count side by side. They measure different things, and in 2021 to 2023 the CPSC count of child pool and spa deaths was slightly higher than the CDC count of coded pool drownings.
CPSC counted 1,128 reported pool- or spa-related drowning deaths of children under 15 in 2021 to 2023, an average of 376 a year (CPSC 2026 report).
CDC death certificates coded 1,091 pool drowning deaths (W67-W68) among children under 15 in the same three years, an average of 363.7 a year, 37 fewer than CPSC (CDC WONDER).
For children under 5, CPSC reported 872 pool or spa drowning deaths in 2021 to 2023, an average of 291 a year (CPSC 2026 report), and CDC data coded 840 pool drowning deaths under 5 over those three years (CDC WONDER).
CPSC reported 379 child pool or spa drowning deaths in 2023, up 6% from 359 in 2022 (CPSC).
CDC’s widely quoted figure of more than 4,000 unintentional drowning deaths a year counts boating-related drownings too: CDC’s MMWR analysis defines drowning as W65-W74 plus V90 and V92 (CDC MMWR), and adding those boating codes to W65-W74 reproduces CDC’s 2018 to 2021 average of 4,345 a year (4,344.5 in PC&S’s calculation; CDC; CDC WONDER).
Official pool safety guidance cited by CDC, CPSC and AAP
This report does not give safety advice. The points below restate published guidance from federal agencies and the American Academy of Pediatrics so readers can go to the source.
- The American Academy of Pediatrics lists 4-sided fencing of all residential pools, close supervision of young children and swim lessons when children are ready as key prevention measures.
- CDC states that a four-sided isolation fence reduces a child’s drowning risk by 83% compared with three-sided property-line fencing.
- Pool Safely (CPSC) advises designating an adult Water Watcher whenever children are in or near water.
- CPSC classified 59% of reported under-5 pool or spa drowning deaths in 2021 to 2023 as a lapse in adult supervision and 10% as a barrier problem or circumvented barrier (CPSC 2026 report).
The state picture in numbers
- Florida recorded 1,027 resident pool drowning deaths in 2018 to 2024, 18.3% of the US total (CDC WONDER).
- Florida, California, Texas and Arizona accounted for 49.6% of US pool drowning deaths in 2018 to 2024 (CDC WONDER).
- Massachusetts had the lowest reliable state pool drowning rate in 2018 to 2024, 0.86 per 1 million per year; Florida’s rate was 7.7 times higher (CDC WONDER).
- New York had the lowest reliable under-5 pool drowning rate in 2018 to 2024, 0.56 per 100,000 children under 5 per year (CDC WONDER).
- In Arizona, 80.7% of unintentional drowning deaths among children ages 1 to 4 in 2018 to 2024 were pool drownings (CDC WONDER).
- Pool drownings were 19.9% of the 28,268 unintentional drowning deaths of US residents in 2018 to 2024 (CDC WONDER).
- 719 two-year-olds died in US pool drownings in 2018 to 2024, a rate of 2.70 per 100,000 per year, the highest of any single year of age (CDC WONDER).
- Adults 65 and older accounted for 1,338 US pool drowning deaths in 2018 to 2024, or 23.8% (CDC WONDER).
- Males accounted for 69.3% of US pool drowning deaths in 2018 to 2024 (CDC WONDER).
- The Census South region had 52.2% of US pool drowning deaths in 2018 to 2024 and 38.5% of the population (CDC WONDER).
- 1,178 pool drowning deaths occurred in Florida in 2018 to 2024, 14.7% more than the 1,027 deaths of Florida residents (CDC WONDER).
- 49 of 88 child drownings tracked in Texas in 2025 (55.7%) happened in pools (Texas DFPS).
- CPSC received reports of an average of 376 pool or spa drowning deaths of US children under 15 a year in 2021 to 2023, 77% of them under age 5 (CPSC 2026 report).
- The share of US unintentional drownings coded as unspecified (W74) fell from 14.6% in 2018 to 8.8% in 2024 (CDC WONDER).
State rankings and comparisons we derived
State pool drowning rate ranking with confidence notes
Which states have the highest pool drowning rates once population is accounted for, and how certain is the order?
rate = pool drowning deaths (W67-W68, 2018-2024) / sum of annual populations x 1,000,000; ranked only where deaths >= 20Inputs: state deaths, populations and CIs: facts.csv rows #334 to #537; state rates and CIs per 1 million: rows #1284 to #1775
Limitations: Residence-based counts; W74 under-coding varies by state; seven-year pooling hides changes within the period.
Pool share of unintentional drownings, national and by state
What share of drowning deaths happen in pools?
pool share = W67-W68 deaths / W65-W74 deaths x 100 (2018-2024)Inputs: rows #70, #97; state rows #742 to #792; derived #1289 to #1776
Limitations: Boating drownings (V90, V92) excluded from the denominator; W74 deaths cannot be assigned to pools, so shares are lower bounds.
Child (ages 1 to 4) pool drowning share versus other ages
How much more pool-concentrated is toddler drowning than drowning at other ages?
share(1-4) = pool deaths 1-4 / all unintentional drowning deaths 1-4; share(other) = (all pool - pool 1-4) / (all unintentional - unintentional 1-4)Inputs: age rows #129 to #161; derived rows #1141, #1172, #1170
Limitations: Age groups are CDC ten-year groups; under-coding to W74 affects all ages.
Sun Belt versus the rest of the US
Is pool drowning risk concentrated in warm-weather states?
rate(group) = sum of group deaths / sum of group populations x 1,000,000; ratio = rate(Sun Belt) / rate(rest)Inputs: derived rows #1267 to #1283
Limitations: Sun Belt is an editorial grouping with no federal definition; Census regions give the same direction.
Coding shift behind the national increase
Is the rise in recorded pool drownings real or partly a coding effect?
change in W67-W68 deaths 2018 to 2024 compared with change in W74 deaths 2018 to 2024Inputs: rows #72, #84, #100, #118; derived #1129, #1131
Limitations: Death records do not show which W74 deaths occurred in pools; the size of the coding effect cannot be measured directly.
Residence versus occurrence
Do tourist states record more pool drownings than their residents’ figures show?
difference = deaths occurring in state - deaths of state residents (2018-2024)Inputs: occurrence rows #1048 to #1098; derived #1290 to #1778
Limitations: Occurrence counts come from the provisional WONDER database (final data for 2018-2024).
Questions searchers ask
Which state has the most pool drownings?
Florida. Florida recorded 1,027 resident pool drowning deaths in 2018 to 2024, more than California (805) and Texas (639), and also the highest rate, 6.65 per 1 million per year (CDC WONDER).
How many kids drown in pools each year?
CDC death records show an average of 353 US children under 15 died in pool drownings each year in 2018 to 2024, including 267 under age 5 (CDC WONDER). CPSC, which also counts spas and uses case reports, reports 376 a year for 2021 to 2023 (CPSC 2026 report).
Where do most child drownings happen?
For children ages 1 to 4, 59.5% of drowning deaths in 2018 to 2024 were in swimming pools (CDC WONDER). CPSC reports that 71% of child pool or spa drowning deaths in 2021 to 2023 happened in residential settings, 51% at the child’s own home (CPSC 2026 report).
Are pool drownings increasing?
Recorded deaths rose from 746 in 2018 to 881 in 2024, and the provisional 2025 count is 872 (CDC WONDER). Over the same period deaths coded as unspecified drowning fell by 171, so part of the rise may be better coding rather than more deaths.
What month do most pool drownings happen?
July. July accounted for 22.0% of US pool drowning deaths in 2018 to 2024, and June to August together for 55.6% (CDC WONDER).
Latest releases used
- CDC WONDER provisional mortality data (as of 2026-09-27) count 872 US pool drowning deaths in 2025 (CDC WONDER provisional data).
- Texas DFPS lists 68 child drownings in Texas in 2026 as of September 17 (Texas DFPS).
- CPSC reported 379 child pool or spa drowning deaths in 2023, up 6% from 2022 (CPSC, June 24, 2026).
- CPSC’s 2026 submersion report puts reported child pool or spa drowning deaths at 376 a year for 2021 to 2023 (CPSC 2026 report).
- Final 2024 mortality data reached CDC WONDER, showing 881 pool drowning deaths in 2024 (CDC WONDER; release date per CDC WONDER documentation).
Frequently asked questions
How many people drown in pools in the US each year?
An average of 802 US residents died in swimming pool drownings each year from 2018 to 2024, with 881 in 2024 (CDC WONDER).
Which state has the highest pool drowning rate?
Florida, at 6.65 deaths per 1 million residents per year in 2018 to 2024, with Arizona close behind at 6.15 (CDC WONDER).
Which states have the lowest pool drowning rates?
Among states with reliable rates, Massachusetts (0.86 per 1 million per year) and Iowa (0.94) were lowest in 2018 to 2024; 10 small jurisdictions had too few deaths to publish (CDC WONDER).
What percentage of drownings happen in swimming pools?
19.9% of US unintentional drowning deaths in 2018 to 2024 were coded to swimming pools, rising to 59.5% for children ages 1 to 4 (CDC WONDER).
At what age are children most likely to drown in a pool?
Age 2. Two-year-olds had a pool drowning death rate of 2.70 per 100,000 per year in 2018 to 2024, and age 2 accounted for 38.7% of pool drowning deaths at ages 1 to 4 (CDC WONDER).
How many children under 5 drown in pools each year?
An average of 267 US children under 5 died in pool drownings each year in 2018 to 2024, a rate of 1.41 per 100,000 (CDC WONDER).
How many pool drowning deaths were there in 2025?
Provisional CDC data count 872 US pool drowning deaths in 2025, including 267 children ages 1 to 4; final 2025 figures are not yet released (CDC WONDER provisional data, as of 2026-09-27).
Why do CDC and CPSC child pool drowning numbers differ?
CDC counts death certificates coded W67-W68 (1,091 children under 15 in 2021 to 2023), while CPSC counts case reports involving pools and spas (1,128 in the same years) (CDC WONDER; CPSC 2026 report).
How reliable are state pool drowning numbers?
36 of 51 jurisdictions had 20 or more pool drowning deaths in 2018 to 2024, enough for a reliable rate. Unspecified drownings (W74), which cannot be assigned to pools, were 11.2% of all unintentional drownings (CDC WONDER; CDC WONDER documentation).
Do state figures include tourists who drown on vacation?
No. The state table counts deaths by state of residence. By place of occurrence, Florida recorded 1,178 pool drowning deaths in 2018 to 2024 versus 1,027 among residents (CDC WONDER).
Cite and reuse
Numbers to quote
- 5,616 US residents died in swimming pool drownings from 2018 to 2024, according to CDC death records. (CDC, National Center for Health Statistics)
- Florida had the highest pool drowning death rate in the US in 2018 to 2024, 6.65 per 1 million residents per year, 2.7 times the national rate. (CDC, National Center for Health Statistics)
- 59.5% of unintentional drowning deaths of US children ages 1 to 4 in 2018 to 2024 happened in swimming pools. (CDC, National Center for Health Statistics)
- The 15 Sun Belt states had 70.0% of US pool drowning deaths in 2018 to 2024 with 47.3% of the population. (CDC, National Center for Health Statistics)
- July accounted for 22.0% of US pool drowning deaths in 2018 to 2024. (CDC, National Center for Health Statistics)
- CPSC received reports of 376 pool or spa drowning deaths of US children under 15 a year in 2021 to 2023. (U.S. Consumer Product Safety Commission)
Start with these sources
- Underlying Cause of Death, 2018-2024, Single Race (CDC WONDER online database; final data released 2026), CDC, National Center for Health Statistics
- Provisional Mortality Statistics, 2018 through Last Week (CDC WONDER; deaths through 2026-09-19, as of 2026-09-27), CDC, National Center for Health Statistics
- Pool or Spa Submersion: Estimated Nonfatal Drowning Injuries and Reported Drownings, 2026 Report (May 2026), U.S. Consumer Product Safety Commission
- Vital Signs: Drowning Death Rates, Self-Reported Swimming Skill, Swimming Lesson Participation, and Recreational Water Exposure, United States, 2019-2023 (MMWR 73(20), 2024), CDC
Newsroom summary
An analysis of CDC death records by Pool Construction & Service finds that 5,616 US residents died in swimming pool drownings from 2018 to 2024, an average of 802 a year. Florida recorded the most deaths (1,027) and the highest rate, 6.65 per million residents a year, with Arizona close behind at 6.15. For children under five, both states had rates about 2.7 times the national figure. Children ages 1 to 4 accounted for 33.1% of pool drowning deaths, and 59.5% of their drowning deaths happened in pools. Fifteen Sun Belt states had 70.0% of deaths. Recorded deaths reached 881 in 2024, and provisional data show 872 in 2025, although a drop in deaths coded as unspecified drowning suggests part of the rise reflects better coding. July is the peak month. State figures are by residence, so drownings of visitors count in their home states.
Headline options
- Florida and Arizona lead the US in pool drowning deaths per capita, CDC data show
- 59.5% of drowning deaths among US children ages 1 to 4 happen in swimming pools
- US pool drowning deaths reached 881 in 2024, the highest in seven years of CDC data
- 15 Sun Belt states account for 70.0% of US pool drowning deaths
- July is the deadliest month for pool drownings, with 22.0% of deaths
Suggested citation
Pool Construction & Service. "Pool Drowning Statistics by State: Deaths and Rates, 2018 to 2024." PC&S Research Desk, October 3, 2026. https://poolconstructionandservice.com/research/pool-drowning-statistics-by-state/
Reuse terms
The data tables and charts in this report are licensed under CC BY 4.0. Reuse them with this attribution: “Source: Pool Construction & Service (poolconstructionandservice.com), Pool Drowning Statistics by State: Deaths and Rates, 2018 to 2024.” Figures from third-party sources remain subject to their publishers’ terms.
State data files
- Pool drowning deaths and rates by state, 2018 to 2024 (with 2025 provisional) CSV
- US pool drowning deaths by year, 2018 to 2025 CSV
- US pool drowning deaths by age group, 2018 to 2024 CSV
- Pool drowning deaths by Census region, division and Sun Belt grouping, 2018 to 2024 CSV
- Pool drowning deaths by state of residence and occurrence, 2018 to 2024 CSV
- CPSC child pool or spa drowning deaths by location, 2021 to 2023 CSV
- Full fact sheet with sources and limitations CSV
How we measured it
- Queried CDC WONDER Underlying Cause of Death 2018-2024 (dataset D158) through its web request form, because the WONDER API does not allow grouping vital statistics by state. Each query is scripted in scripts/run_wonder_queries.py and the raw exports are kept in raw/.
- Defined pool drowning as underlying cause ICD-10 W67 or W68 and all unintentional drowning as W65-W74, excluding boating (V90, V92). Grouped by state of residence, age, year, month, sex and Census region.
- Pooled seven years (2018 to 2024) to reduce suppression, computed rates per 1 million residents per year (per 100,000 for children) from WONDER’s population denominators, and converted WONDER’s 95% confidence intervals to the same scale.
- Applied CDC suppression (1 to 9 deaths shown as suppressed) and the legacy CDC rule that rates on fewer than 20 deaths are unreliable; unreliable rates are shown but not ranked.
- Added 2025 provisional counts and place-of-occurrence counts from the CDC WONDER provisional database (dataset D176), which holds final data for 2018 to 2024.
- Read the CPSC 2026 submersion report, CDC drowning pages, the 2024 MMWR Vital Signs report, Texas DFPS child drowning lists and three state statutes, and reconciled their figures with the WONDER results.
Included: Official federal and state sources opened on 2026-10-03: CDC WONDER, CDC web pages and MMWR, CPSC, Texas DFPS, Florida DOH, Arizona DHS, the Census Bureau, AAP, and state legislature statute pages.
Excluded: Unsourced roundup pages, a user-made chart on Reddit, an outdated infographic and sources that could not be opened (the 2026 AAP policy statement and technical report returned an access block). See excluded.md.
Conflicting numbers: CDC and CPSC child counts differ because they measure different things; both are shown with their definitions (1,091 CDC-coded deaths versus 1,128 CPSC reports for children under 15 in 2021 to 2023). CDC’s figure of 4,345 drowning deaths a year matches the total including boating codes V90 and V92, which CDC also uses in its MMWR analysis; this report reproduced it as 4,344.5. The 2017 Pool Safely state comparison (40 child drownings each in Florida and Texas) uses 2016 data and is superseded here (Pool Safely (CPSC)).
Derived metrics: Every derived number has a row in facts.csv (source ‘PC&S calculation’) and in derived.csv, with its formula and input rows. Scripts in scripts/ rebuild all tables, charts and derived values from raw/. Related PC&S data reports are listed on the PC&S research hub.
Caveats
- Counts are by state of residence; deaths of visitors are attributed to their home state.
- Pool deaths certified as unspecified drowning (W74) are missed, and the W74 share varies widely by state.
- Only the underlying cause of death is used; deaths where drowning was a contributing cause are not counted.
- Rates are per resident, not per pool. Pool ownership differs by state; see the PC&S report on the number of swimming pools in the US.
- Seven-year pooling stabilizes state rates but hides year-to-year change; 2025 data are provisional.
- This report covers deaths only. Nonfatal pool injuries are covered in the PC&S report on pool injury statistics.
- Residential pool barrier law status was verified only for Florida, Arizona and California.
Method last reviewed October 3, 2026.
Source weighting
Tier 1: primary and government sources (20)
- CDC, National Center for Health Statistics: Underlying Cause of Death, 2018-2024, Single Race (CDC WONDER online database; final data released 2026)
- CDC, National Center for Health Statistics: Provisional Mortality Statistics, 2018 through Last Week (CDC WONDER; deaths through 2026-09-19, as of 2026-09-27)
- CDC, National Center for Health Statistics: Underlying Cause of Death documentation: suppression and unreliable rates
- U.S. Consumer Product Safety Commission: Pool or Spa Submersion: Estimated Nonfatal Drowning Injuries and Reported Drownings, 2026 Report (May 2026)
- U.S. Consumer Product Safety Commission: CPSC Report Highlights Persistent Risk of Childhood Drowning (news release, June 24, 2026)
- CDC, National Center for Injury Prevention and Control: Drowning Data (updated Jan. 27, 2026)
- CDC, National Center for Injury Prevention and Control: Drowning Facts (updated Jan. 27, 2026)
- CDC, National Center for Injury Prevention and Control: Drowning Risk Factors
- CDC: Vital Signs: Drowning Death Rates, Self-Reported Swimming Skill, Swimming Lesson Participation, and Recreational Water Exposure, United States, 2019-2023 (MMWR 73(20), 2024)
- Texas Department of Family and Protective Services: 2025 Child Drownings
- Texas Department of Family and Protective Services: 2026 Child Drownings (updated 09/17/26)
- Florida Department of Health: Drowning Prevention
- Florida Legislature: Florida Statutes s. 515.27, Residential swimming pool safety feature options
- Arizona Legislature: Arizona Revised Statutes s. 36-1681, Pool enclosures
- California Legislature: California Health and Safety Code s. 115922 (Swimming Pool Safety Act)
- Arizona Department of Health Services: Table 9-3, Total and age-specific drowning rates by year, Arizona residents, 2013-2023
- American Academy of Pediatrics: Drowning Prevention and Water Safety
- U.S. Consumer Product Safety Commission: Pool Safely: Simple Steps Save Lives (home page)
- U.S. Census Bureau: Census Regions and Divisions of the United States
- U.S. Consumer Product Safety Commission (Pool Safely): Know the Facts: Fatal Child Drownings by State (Oct. 2, 2017)
Works cited
- CDC, National Center for Health Statistics. Underlying Cause of Death, 2018-2024, Single Race (CDC WONDER online database; final data released 2026). Accessed 2026-10-03.
- CDC, National Center for Health Statistics. Provisional Mortality Statistics, 2018 through Last Week (CDC WONDER; deaths through 2026-09-19, as of 2026-09-27). Accessed 2026-10-03.
- CDC, National Center for Health Statistics. Underlying Cause of Death documentation: suppression and unreliable rates. Accessed 2026-10-03.
- U.S. Consumer Product Safety Commission. Pool or Spa Submersion: Estimated Nonfatal Drowning Injuries and Reported Drownings, 2026 Report (May 2026). Accessed 2026-10-03.
- U.S. Consumer Product Safety Commission. CPSC Report Highlights Persistent Risk of Childhood Drowning (news release, June 24, 2026). Accessed 2026-10-03.
- CDC, National Center for Injury Prevention and Control. Drowning Data (updated Jan. 27, 2026). Accessed 2026-10-03.
- CDC, National Center for Injury Prevention and Control. Drowning Facts (updated Jan. 27, 2026). Accessed 2026-10-03.
- CDC, National Center for Injury Prevention and Control. Drowning Risk Factors. Accessed 2026-10-03.
- CDC. Vital Signs: Drowning Death Rates, Self-Reported Swimming Skill, Swimming Lesson Participation, and Recreational Water Exposure, United States, 2019-2023 (MMWR 73(20), 2024). Accessed 2026-10-03.
- Texas Department of Family and Protective Services. 2025 Child Drownings. Accessed 2026-10-03.
- Texas Department of Family and Protective Services. 2026 Child Drownings (updated 09/17/26). Accessed 2026-10-03.
- Florida Department of Health. Drowning Prevention. Accessed 2026-10-03.
- Florida Legislature. Florida Statutes s. 515.27, Residential swimming pool safety feature options. Accessed 2026-10-03.
- Arizona Legislature. Arizona Revised Statutes s. 36-1681, Pool enclosures. Accessed 2026-10-03.
- California Legislature. California Health and Safety Code s. 115922 (Swimming Pool Safety Act). Accessed 2026-10-03.
- Arizona Department of Health Services. Table 9-3, Total and age-specific drowning rates by year, Arizona residents, 2013-2023. Accessed 2026-10-03.
- American Academy of Pediatrics. Drowning Prevention and Water Safety. Accessed 2026-10-03.
- U.S. Consumer Product Safety Commission. Pool Safely: Simple Steps Save Lives (home page). Accessed 2026-10-03.
- U.S. Census Bureau. Census Regions and Divisions of the United States. Accessed 2026-10-03.
- U.S. Consumer Product Safety Commission (Pool Safely). Know the Facts: Fatal Child Drownings by State (Oct. 2, 2017). Accessed 2026-10-03.
Related pool research
Pool Injury Statistics: U.S. Emergency Room Visits by Product, Age and Month, 2015 to 2024
Pool Product Recalls: A Registry of U.S. CPSC Recalls of Pool and Spa Products, 2001 to 2026
Pool Fence Laws by State: Residential Pool Barrier Rules in All 50 States and DC, 2026
Swimming Pool Illness Outbreaks: U.S. Registry of CDC-Reported Outbreaks, 2009 to 2023
Pool Electrocution Statistics: U.S. Deaths, Shock Injuries and the Equipment Involved
How Many Americans Can't Swim: National Estimates Reconciled, 2014 to 2023
All pool industry research (43 reports)