Percentage of Homes With Pools by Metro and State: Backyard Pool Prevalence Index
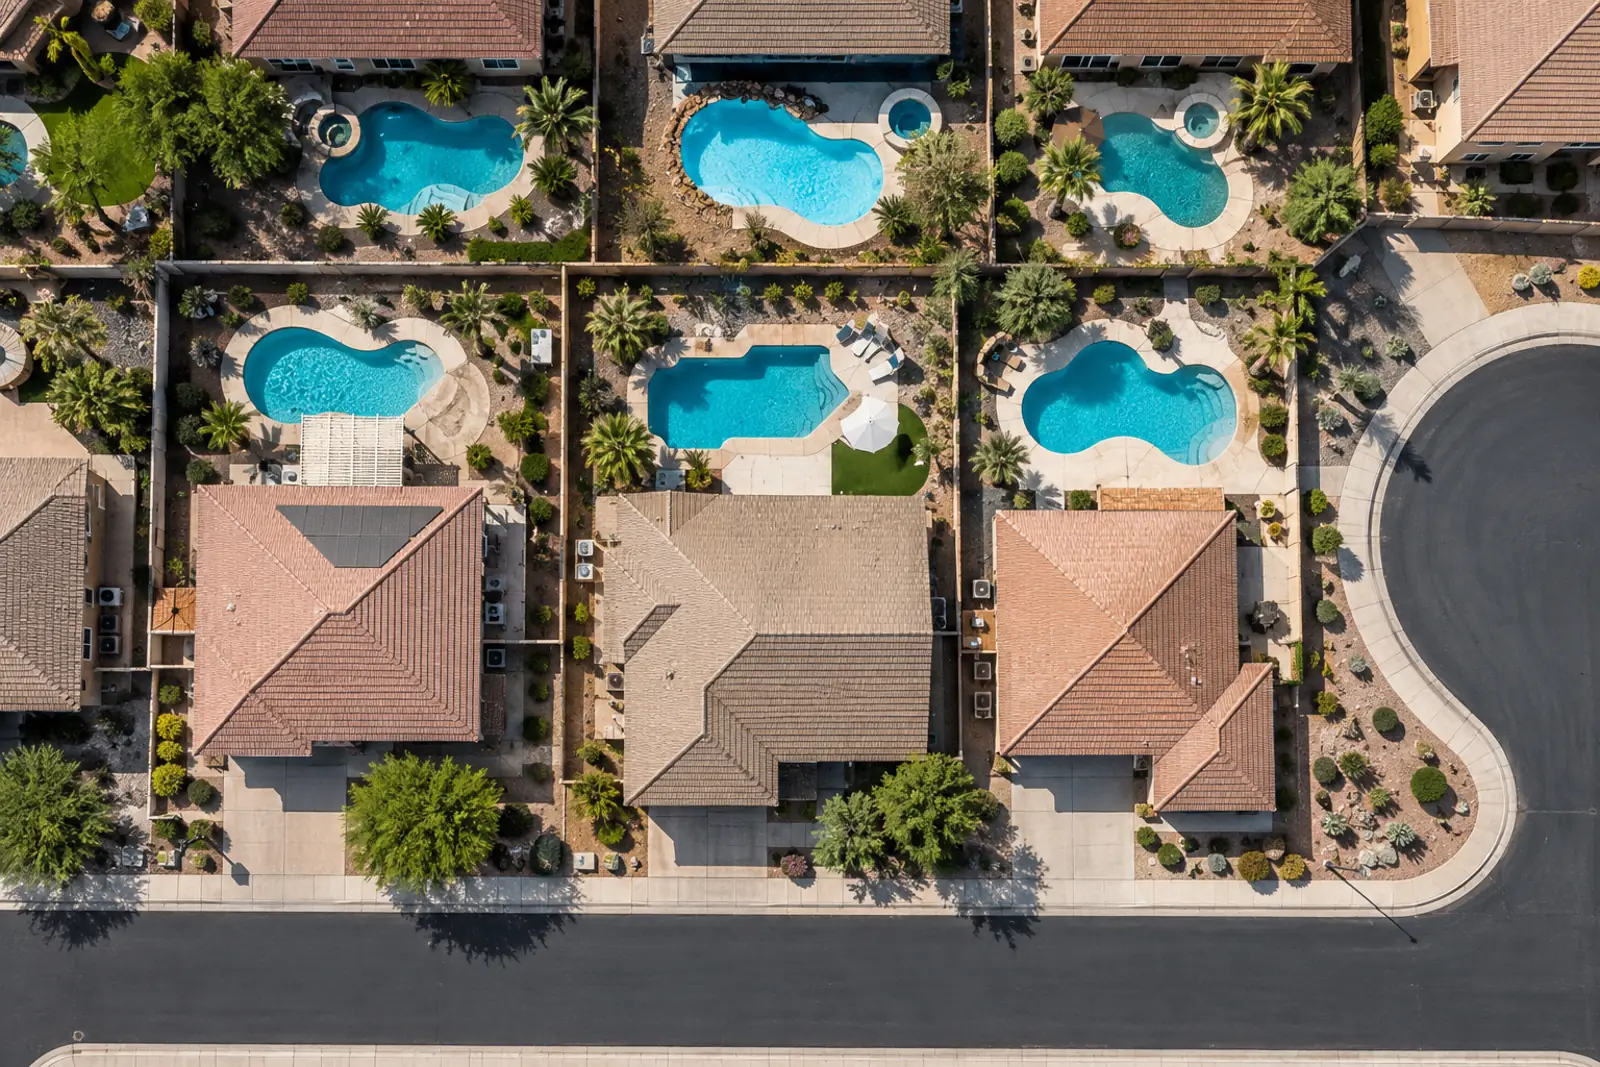
The percentage of homes with pools in the United States was 7.2% in 2024, or 9.8% of houses, according to EIA's preliminary RECS. Florida (27.5% of houses) and Arizona (23.7%) lead the states. Among 25 metros in the Census American Housing Survey (2015, latest all-household data), Phoenix ranks first: 36.8% of single-family homes had a pool.
How the index is built
- Downloaded the AHS 2015 and 2023 national and metropolitan public use files (household.csv) from census.gov and the 2015 and 2023 table specifications.
- Tabulated POOLSAFE (has an outdoor pool on the property) for occupied units in split-sample group 2 using SP2WEIGHT and 160 Fay replicate weights (variance = 4/160 x sum of squared deviations); validated against published national totals (2015: 19,664 thousand, MOE 535; 2023 young-child: 5,240 thousand, MOE 317).
- Computed each metro’s share of all occupied homes and of single-family and mobile homes, the Backyard Pool Prevalence Index (single-family share relative to the US share x 100) and 90% margins of error.
- Repeated the 2023 universe (households with children under 7 living in or regularly visiting) on the 2015 file to measure change for 20 metros.
- Tabulated SWIMPOOL from the EIA RECS 2020 (v7) and 2024 (preliminary v1) microdata by state and RECS Census division with 60 jackknife replicate weights; validated against Table HC2.1 national totals (8.52 and 9.60 million homes).
- Counted OpenStreetMap leisure=swimming_pool features in each metro’s 2013 CBSA counties through the Overpass API on October 6, 2026, one query at a time, and divided by ACS 2020-2024 housing counts for the matched counties.
- Matched the 25 AHS metros to the PC&S Swim Season Index (NOAA 1991-2020 normals) and computed Pearson and Spearman correlations and a least-squares slope.
- Opened the pages that rank for ‘percentage of homes with pools by state’ and ‘city with most pools per capita’ and logged their figures and sources for comparison.
Included: Federal survey microdata with published replicate weights (AHS, RECS), Census housing counts (ACS), NOAA-based climate normals, OpenStreetMap counts (clearly labelled as incomplete mapping) and one property-record study (LendingTree 2019) with its stated method.
Excluded: Unsourced state ranges on blog pages, figures from pages that blocked access (a Reddit map thread), market-research estimates and any statistic without a stated data year. Details are in excluded.md.
Conflicting numbers: Sources are never mixed in one ranking. The metro ranking uses AHS only; the state table uses RECS only; the sensitivity table puts every source in its own labelled column. Differences are explained by definition (pool on the property vs own pool vs property-record flag) rather than averaged away.
Derived metrics: Shares, indexes, changes, completeness ratios and correlations were computed with the Python scripts in the package (scripts/) and are listed in derived.csv with formulas and input rows. Changes use z = difference / sqrt(se1^2 + se2^2) and are called significant at |z| > 1.645.
Caveats
- The metro index uses 2015 data, the latest all-household AHS pool item; pools built since then are not reflected.
- AHS counts shared complex pools and possibly some HOA pools; RECS counts only a home’s own pool, so the two are not directly comparable.
- 2024 RECS estimates are preliminary and may be revised in the spring 2027 release; 19 state estimates (including DC) are suppressed.
- The 2023 AHS pool item covers only households with young children; 5 metros were dropped from the 2023 sample.
- OpenStreetMap coverage is volunteer-driven and uneven; several counties, including the New York City boroughs, could not be matched.
- The swim-season association is cross-sectional across 25 metros and does not control for income or housing type.
Method last reviewed October 6, 2026.
How the Backyard Pool Prevalence Index is built
No federal survey has asked every US household about a pool since 2015, so the index combines two federal surveys that measure different things and labels each number with its source. Metro rankings come from the Census Bureau and HUD American Housing Survey (AHS); state and division shares come from the EIA Residential Energy Consumption Survey (RECS).
- Metro index: PC&S tabulated the AHS 2015 national and metropolitan public use files for the 25 metros AHS sampled that year, using the survey’s split-sample weight and 160 replicate weights. The code reproduces the published US total of 19,664 thousand homes with a pool and its 535 thousand margin of error (Census AHS 2015 table specifications).
- Index value: a metro’s single-family pool share divided by the US single-family share (11.9% in 2015) times 100. Phoenix at 309 means about three times the national rate.
- Latest AHS reading: in 2023 AHS asked the pool question only of households with children under 7 living in or regularly visiting the home (2023 AHS Definitions). PC&S applied the same restriction to 2015 to get a like-for-like change for 20 metros.
- States and divisions: PC&S tabulated the 2020 (final) and 2024 (preliminary) RECS microdata with 60 jackknife replicate weights (EIA RECS 2024). Estimates with fewer than 10 sample pool homes or a relative standard error above 50% are shown as suppressed.
- Cross-checks: OpenStreetMap pool features counted per metro (OpenStreetMap via Overpass), divided by ACS 2020-2024 housing counts, and swim-season days from the PC&S Swim Season Index.
Percentage of homes with pools by metro area: the ranked index
Phoenix and Miami stand well above every other large metro, with roughly a third of single-family homes owning a pool in 2015. A second tier of Southern California and Texas metros follows, and the lowest shares are in the Pacific Northwest and the Upper Midwest.
| Rank | Metro area (2013 CBSA) | Backyard Pool Prevalence Index (US = 100) | Single-family and mobile homes with a pool (%) | 90% MOE, single-family (+/- pts) | All occupied homes with a pool on the property (%) | 90% MOE, all homes (+/- pts) | Homes with a pool on the property (thousands) | Pool homes that are single-family (%) | Sample households with a pool | Reliability | Source |
|---|---|---|---|---|---|---|---|---|---|---|---|
| 1 | Phoenix-Mesa-Scottsdale, AZ | 309 | 36.8 | 3.4 | 45.0 | 2.9 | 731 | 67.5 | 481 | Reliable | Census/HUD AHS 2015 PUF, PC&S tabulation |
| 2 | Miami-Fort Lauderdale-West Palm Beach, FL | 280 | 33.3 | 2.7 | 40.2 | 2.8 | 795 | 52.2 | 388 | Reliable | Census/HUD AHS 2015 PUF, PC&S tabulation |
| 3 | Riverside-San Bernardino-Ontario, CA | 186 | 22.1 | 2.2 | 27.4 | 2.1 | 361 | 69.4 | 306 | Reliable | Census/HUD AHS 2015 PUF, PC&S tabulation |
| 4 | Los Angeles-Long Beach-Anaheim, CA | 169 | 20.1 | 2.7 | 25.5 | 2.5 | 1107 | 49.4 | 310 | Reliable | Census/HUD AHS 2015 PUF, PC&S tabulation |
| 5 | Houston-The Woodlands-Sugar Land, TX | 147 | 17.5 | 2.2 | 31.8 | 2.1 | 714 | 41.8 | 371 | Reliable | Census/HUD AHS 2015 PUF, PC&S tabulation |
| 6 | Dallas-Fort Worth-Arlington, TX | 129 | 15.3 | 2.1 | 31.4 | 2.1 | 773 | 35.5 | 378 | Reliable | Census/HUD AHS 2015 PUF, PC&S tabulation |
| 7 | Atlanta-Sandy Springs-Roswell, GA | 119 | 14.2 | 1.8 | 24.2 | 2.0 | 484 | 47.4 | 254 | Reliable | Census/HUD AHS 2015 PUF, PC&S tabulation |
| 8 | New York-Newark-Jersey City, NY-NJ-PA | 119 | 14.2 | 2.5 | 11.5 | 1.7 | 853 | 63.5 | 114 | Reliable | Census/HUD AHS 2015 PUF, PC&S tabulation |
| 9 | San Francisco-Oakland-Hayward, CA | 114 | 13.6 | 2.0 | 18.6 | 2.0 | 312 | 44.4 | 214 | Reliable | Census/HUD AHS 2015 PUF, PC&S tabulation |
| 10 | Cincinnati, OH-KY-IN | 105 | 12.5 | 2.2 | 17.3 | 2.1 | 144 | 54.6 | 183 | Reliable | Census/HUD AHS 2015 PUF, PC&S tabulation |
| 11 | Washington-Arlington-Alexandria, DC-VA-MD-WV | 104 | 12.4 | 2.0 | 26.0 | 2.1 | 557 | 32.8 | 312 | Reliable | Census/HUD AHS 2015 PUF, PC&S tabulation |
| 12 | Raleigh, NC | 100 | 11.9 | 1.8 | 22.6 | 2.0 | 105 | 41.8 | 273 | Reliable | Census/HUD AHS 2015 PUF, PC&S tabulation |
| 13 | Memphis, TN-MS-AR | 99 | 11.8 | 1.6 | 17.8 | 1.7 | 88 | 55.9 | 200 | Reliable | Census/HUD AHS 2015 PUF, PC&S tabulation |
| 14 | Pittsburgh, PA | 98 | 11.7 | 1.8 | 11.7 | 1.8 | 116 | 80.5 | 111 | Reliable | Census/HUD AHS 2015 PUF, PC&S tabulation |
| 15 | New Orleans-Metairie, LA | 96 | 11.4 | 2.0 | 16.2 | 1.8 | 79 | 55.4 | 161 | Reliable | Census/HUD AHS 2015 PUF, PC&S tabulation |
| 16 | Philadelphia-Camden-Wilmington, PA-NJ-DE-MD | 92 | 11.0 | 1.6 | 15.0 | 1.6 | 334 | 59.8 | 158 | Reliable | Census/HUD AHS 2015 PUF, PC&S tabulation |
| 17 | Boston-Cambridge-Newton, MA-NH | 82 | 9.8 | 2.0 | 10.2 | 1.5 | 186 | 55.2 | 102 | Reliable | Census/HUD AHS 2015 PUF, PC&S tabulation |
| 18 | Detroit-Warren-Dearborn, MI | 75 | 8.9 | 1.4 | 13.8 | 1.6 | 236 | 54.0 | 147 | Reliable | Census/HUD AHS 2015 PUF, PC&S tabulation |
| 19 | Cleveland-Elyria, OH | 69 | 8.2 | 1.6 | 11.7 | 1.7 | 101 | 54.9 | 121 | Reliable | Census/HUD AHS 2015 PUF, PC&S tabulation |
| 20 | Kansas City, MO-KS | 66 | 7.8 | 1.4 | 15.6 | 1.5 | 126 | 39.9 | 168 | Reliable | Census/HUD AHS 2015 PUF, PC&S tabulation |
| 21 | Chicago-Naperville-Elgin, IL-IN-WI | 61 | 7.2 | 1.7 | 10.3 | 1.8 | 360 | 46.4 | 112 | Reliable | Census/HUD AHS 2015 PUF, PC&S tabulation |
| 22 | Denver-Aurora-Lakewood, CO | 60 | 7.1 | 1.5 | 21.2 | 2.0 | 226 | 23.9 | 247 | Reliable | Census/HUD AHS 2015 PUF, PC&S tabulation |
| 23 | Portland-Vancouver-Hillsboro, OR-WA | 49 | 5.8 | 1.3 | 12.9 | 1.5 | 116 | 33.1 | 135 | Reliable | Census/HUD AHS 2015 PUF, PC&S tabulation |
| 24 | Milwaukee-Waukesha-West Allis, WI | 45 | 5.4 | 1.3 | 7.7 | 1.3 | 48 | 44.9 | 92 | Reliable | Census/HUD AHS 2015 PUF, PC&S tabulation |
| 25 | Seattle-Tacoma-Bellevue, WA | 44 | 5.2 | 1.3 | 13.0 | 1.9 | 189 | 27.6 | 147 | Reliable | Census/HUD AHS 2015 PUF, PC&S tabulation |
| United States (all areas) | 100 | 11.9 | 0.5 | 16.6 | 0.4 | 19664 | 54.3 | 5626 | Reliable | Census/HUD AHS 2015 PUF, PC&S tabulation |
Source: Census/HUD AHS 2015 and Census/HUD AHS 2015 metro file public use files, PC&S tabulation with 160 replicate weights. Download CSV
Sorted by the single-family share. 90% margins of error are 1.3 to 3.4 points; see the table.
Source: U.S. Census Bureau and HUD, American Housing Survey 2015 public use files; PC&S tabulation with replicate weights. Download chart data (CSV)
Phoenix-Mesa-Scottsdale had the highest single-family share in 2015 at 36.8%, with a 90% margin of error of 3.4 points (Census/HUD AHS 2015).
Miami-Fort Lauderdale-West Palm Beach was second at 33.3%. The 3.5-point gap between Phoenix and Miami on the single-family measure is not statistically significant at 90%; the 4.8-point gap on the all-homes measure (45.0% vs 40.2%) is.
Riverside-San Bernardino (22.1%) and Los Angeles (20.1%) ranked third and fourth on the single-family measure in 2015.
Seattle (5.2%), Milwaukee (5.4%) and Portland (5.8%) had the lowest single-family shares of the 25 metros in 2015.
Los Angeles had the most homes with a pool on the property in 2015, 1,107 thousand, because of its size; Miami had 795 thousand and Phoenix 731 thousand.
The newest AHS reading: pools in households with young children, 2015 vs 2023
The 2023 AHS kept the pool question but asked it only of households with children under 7 living in or regularly visiting the home. On that like-for-like basis the national share edged up and the metro order barely moved.
| Metro area (2013 CBSA) | 2015: young-child households with a pool (%) | 2015 90% MOE (+/- pts) | 2023: young-child households with a pool (%) | 2023 90% MOE (+/- pts) | Change (pts) | Change significant at 90% | Sample with pool 2015 / 2023 | Source |
|---|---|---|---|---|---|---|---|---|
| Phoenix-Mesa-Scottsdale, AZ | 41.5 | 4.6 | 38.5 | 6.4 | -3.0 | No | 137 / 62 | Census/HUD AHS 2015 and 2023 PUFs, PC&S tabulation |
| Miami-Fort Lauderdale-West Palm Beach, FL | 37.1 | 4.8 | 34.1 | 7.3 | -3.0 | No | 90 / 48 | Census/HUD AHS 2015 and 2023 PUFs, PC&S tabulation |
| Dallas-Fort Worth-Arlington, TX | 25.3 | 3.8 | 32.2 | 5.5 | 6.9 | Yes | 93 / 77 | Census/HUD AHS 2015 and 2023 PUFs, PC&S tabulation |
| Houston-The Woodlands-Sugar Land, TX | 29.2 | 3.7 | 31.8 | 5.2 | 2.6 | No | 115 / 69 | Census/HUD AHS 2015 and 2023 PUFs, PC&S tabulation |
| Los Angeles-Long Beach-Anaheim, CA | 20.3 | 3.4 | 25.5 | 5.2 | 5.2 | No | 66 / 51 | Census/HUD AHS 2015 and 2023 PUFs, PC&S tabulation |
| Riverside-San Bernardino-Ontario, CA | 26.5 | 4.0 | 25.4 | 4.7 | -1.1 | No | 96 / 53 | Census/HUD AHS 2015 and 2023 PUFs, PC&S tabulation |
| Washington-Arlington-Alexandria, DC-VA-MD-WV | 22.5 | 3.9 | 18.8 | 4.8 | -3.7 | No | 75 / 43 | Census/HUD AHS 2015 and 2023 PUFs, PC&S tabulation |
| San Francisco-Oakland-Hayward, CA | 19.1 | 3.9 | 18.4 | 5.4 | -0.7 | No | 57 / 31 | Census/HUD AHS 2015 and 2023 PUFs, PC&S tabulation |
| Philadelphia-Camden-Wilmington, PA-NJ-DE-MD | 14.9 | 3.4 | 17.7 | 5.8 | 2.8 | No | 46 / 27 | Census/HUD AHS 2015 and 2023 PUFs, PC&S tabulation |
| United States (all areas) | 15.1 | 0.7 | 16.3 | 1.0 | 1.2 | Yes | 1561 / 946 | Census/HUD AHS 2015 and 2023 PUFs, PC&S tabulation |
| Atlanta-Sandy Springs-Roswell, GA | 20.1 | 3.5 | 14.8 | 4.9 | -5.3 | No | 67 / 22 | Census/HUD AHS 2015 and 2023 PUFs, PC&S tabulation |
| New Orleans-Metairie, LA | 15.4 | 3.1 | 14.7 | 4.7 | -0.7 | No | 47 / 20 | Census/HUD AHS 2015 and 2023 PUFs, PC&S tabulation |
| Denver-Aurora-Lakewood, CO | 20.0 | 3.7 | 13.5 | 3.9 | -6.5 | Yes | 70 / 28 | Census/HUD AHS 2015 and 2023 PUFs, PC&S tabulation |
| Seattle-Tacoma-Bellevue, WA | 13.2 | 3.3 | 12.6 | 4.2 | -0.6 | No | 41 / 22 | Census/HUD AHS 2015 and 2023 PUFs, PC&S tabulation |
| Cincinnati, OH-KY-IN | 14.7 | 3.4 | 12.4 | 4.2 | -2.3 | No | 48 / 23 | Census/HUD AHS 2015 and 2023 PUFs, PC&S tabulation |
| New York-Newark-Jersey City, NY-NJ-PA | 10.4 | 3.3 | 12.0 | 4.4 | 1.6 | No | 28 / 28 | Census/HUD AHS 2015 and 2023 PUFs, PC&S tabulation |
| Cleveland-Elyria, OH | 9.5 | 2.8 | 12.0 | 4.2 | 2.5 | No | 26 / 20 | Census/HUD AHS 2015 and 2023 PUFs, PC&S tabulation |
| Boston-Cambridge-Newton, MA-NH | 11.8 | 3.5 | 11.7 | 4.3 | -0.1 | No | 27 / 20 | Census/HUD AHS 2015 and 2023 PUFs, PC&S tabulation |
| Chicago-Naperville-Elgin, IL-IN-WI | 7.2 | 2.3 | 10.8 | 3.7 | 3.6 | No | 23 / 24 | Census/HUD AHS 2015 and 2023 PUFs, PC&S tabulation |
| Detroit-Warren-Dearborn, MI | 15.3 | 2.9 | 9.0 | 3.3 | -6.3 | Yes | 47 / 19 | Census/HUD AHS 2015 and 2023 PUFs, PC&S tabulation |
| Milwaukee-Waukesha-West Allis, WI | 6.3 | 2.2 | 8.4 | 3.2 | 2.1 | No | 24 / 18 | Census/HUD AHS 2015 and 2023 PUFs, PC&S tabulation |
| Raleigh, NC | 19.3 | 3.8 | Not sampled in 2023 | 66 / n.a. | Census/HUD AHS 2015 and 2023 PUFs, PC&S tabulation | |||
| Pittsburgh, PA | 15.1 | 3.8 | Not sampled in 2023 | 36 / n.a. | Census/HUD AHS 2015 and 2023 PUFs, PC&S tabulation | |||
| Memphis, TN-MS-AR | 14.4 | 2.9 | Not sampled in 2023 | 57 / n.a. | Census/HUD AHS 2015 and 2023 PUFs, PC&S tabulation | |||
| Kansas City, MO-KS | 12.4 | 2.8 | Not sampled in 2023 | 46 / n.a. | Census/HUD AHS 2015 and 2023 PUFs, PC&S tabulation | |||
| Portland-Vancouver-Hillsboro, OR-WA | 11.9 | 3.0 | Not sampled in 2023 | 40 / n.a. | Census/HUD AHS 2015 and 2023 PUFs, PC&S tabulation |
Source: Census/HUD AHS 2015 and Census/HUD AHS 2023 public use files, PC&S tabulation. The 2023 national total reproduces the published 5,240 thousand (Census AHS 2023 table specifications). Download CSV
Nationally, 16.3% of young-child households had a pool on the property in 2023, compared with 15.1% in 2015 (Census/HUD AHS 2023).
Phoenix led again in 2023 at 38.5%, followed by Miami at 34.1% and Dallas-Fort Worth at 32.2% (Census/HUD AHS 2023).
Three of 20 metros changed between 2015 and 2023 by a margin significant at 90%: Dallas-Fort Worth rose 6.9 points, while Denver fell 6.5 points and Detroit fell 6.3 points.
The metro rank order was stable: the Spearman rank correlation between 2015 and 2023 shares across 20 metros was 0.92.
Percentage of homes with pools by state and Census division, 2020 vs 2024
RECS gives the newest geographic detail: 7.2% of all US homes and 9.8% of houses had their own pool in 2024. The Mountain South and South Atlantic divisions lead, and most state and division shares did not change significantly from 2020.
| Census division (RECS) | States | 2020: all homes with own pool (%) | 2020 SE (pts) | 2024: all homes with own pool (%) | 2024 SE (pts) | Change 2020 to 2024 (pts) | Change status | 2024: houses with own pool (%) | 2024 sample pool homes | 2024 reliability | Source |
|---|---|---|---|---|---|---|---|---|---|---|---|
| Mountain South | AZ NM NV | 14.8 | 0.93 | 14.3 | 1.1 | -0.5 | Not significant | 18.1 | 130 | Reliable | EIA RECS 2020 (final) and 2024 (preliminary) microdata, PC&S tabulation |
| South Atlantic | DC DE FL GA MD NC SC VA WV | 9.7 | 0.46 | 9.6 | 0.66 | -0.1 | Not significant | 12.5 | 203 | Reliable | EIA RECS 2020 (final) and 2024 (preliminary) microdata, PC&S tabulation |
| Middle Atlantic | NJ NY PA | 7.2 | 0.51 | 7.2 | 0.47 | 0.0 | Not significant | 11.6 | 168 | Reliable | EIA RECS 2020 (final) and 2024 (preliminary) microdata, PC&S tabulation |
| New England | CT MA ME NH RI VT | 6.4 | 0.5 | 7.2 | 0.71 | 0.8 | Not significant | 11.2 | 145 | Reliable | EIA RECS 2020 (final) and 2024 (preliminary) microdata, PC&S tabulation |
| Pacific | AK CA HI OR WA | 6.0 | 0.53 | 7.6 | 0.71 | 1.6 | Significant (90%) | 11.0 | 124 | Reliable | EIA RECS 2020 (final) and 2024 (preliminary) microdata, PC&S tabulation |
| West South Central | AR LA OK TX | 6.7 | 0.65 | 7.9 | 0.68 | 1.2 | Not significant | 10.3 | 144 | Reliable | EIA RECS 2020 (final) and 2024 (preliminary) microdata, PC&S tabulation |
| East South Central | AL KY MS TN | 7.8 | 0.78 | 6.7 | 0.62 | -1.1 | Not significant | 8.1 | 97 | Reliable | EIA RECS 2020 (final) and 2024 (preliminary) microdata, PC&S tabulation |
| East North Central | IL IN MI OH WI | 4.9 | 0.55 | 5.1 | 0.45 | 0.2 | Not significant | 6.6 | 83 | Reliable | EIA RECS 2020 (final) and 2024 (preliminary) microdata, PC&S tabulation |
| West North Central | IA KS MN MO ND NE SD | 2.9 | 0.46 | 3.0 | 0.55 | 0.1 | Not significant | 3.9 | 41 | Reliable | EIA RECS 2020 (final) and 2024 (preliminary) microdata, PC&S tabulation |
| Mountain North | CO ID MT UT WY | 1.9 | 0.44 | 1.0 | 0.35 | -0.9 | Not significant | 1.3 | 11 | Use with caution | EIA RECS 2020 (final) and 2024 (preliminary) microdata, PC&S tabulation |
Source: EIA RECS 2020 and EIA RECS 2024 (preliminary) public use microdata, PC&S tabulation with 60 jackknife replicate weights. Download CSV
2024 RECS values are preliminary; final release expected spring 2027.
Source: U.S. EIA, Residential Energy Consumption Survey 2020 and 2024 (preliminary) microdata; PC&S tabulation. Download chart data (CSV)
The Mountain South division (Arizona, Nevada, New Mexico) had 14.3% of all homes with their own pool in 2024 and 18.1% of houses (EIA RECS 2024).
The Pacific division rose from 6.0% in 2020 to 7.6% in 2024, the only division change significant at 90% (EIA RECS 2024).
In 2024 the West North Central division had 3.0% of all homes with a pool and Mountain North had 1.0% (use with caution) (EIA RECS 2024).
| State | Code | 2024: houses with own pool (%) | 2024: all homes with own pool (%) | 2024 SE (pts) | 2020: all homes with own pool (%) | Change 2020 to 2024 (pts) | Change status | 2024 sample pool homes | 2024 reliability | Source |
|---|---|---|---|---|---|---|---|---|---|---|
| Florida | FL | 27.5 | 19.9 | 1.67 | 18.8 | 1.1 | Not significant | 110 | Reliable | EIA RECS 2020 and 2024 (preliminary) microdata, PC&S tabulation |
| Arizona | AZ | 23.7 | 18.9 | 1.78 | 19.2 | -0.3 | Not significant | 92 | Reliable | EIA RECS 2020 and 2024 (preliminary) microdata, PC&S tabulation |
| Nevada | NV | 16.1 | 11.8 | 1.9 | 12.0 | -0.2 | Not significant | 34 | Reliable | EIA RECS 2020 and 2024 (preliminary) microdata, PC&S tabulation |
| New York | NY | 14.8 | 7.2 | 0.64 | 5.3 | 1.9 | Significant (90%) | 86 | Reliable | EIA RECS 2020 and 2024 (preliminary) microdata, PC&S tabulation |
| Connecticut | CT | 14.7 | 9.8 | 1.58 | 6.6 | 3.2 | Not significant | 41 | Reliable | EIA RECS 2020 and 2024 (preliminary) microdata, PC&S tabulation |
| California | CA | 14.3 | 9.8 | 0.98 | 7.8 | 2.0 | Not significant | 97 | Reliable | EIA RECS 2020 and 2024 (preliminary) microdata, PC&S tabulation |
| Rhode Island | RI | 14.2 | 8.7 | 1.8 | 7.4 | 1.3 | Not significant | 21 | Reliable | EIA RECS 2020 and 2024 (preliminary) microdata, PC&S tabulation |
| New Jersey | NJ | 13.3 | 8.4 | 1.26 | 8.9 | -0.5 | Not significant | 41 | Reliable | EIA RECS 2020 and 2024 (preliminary) microdata, PC&S tabulation |
| Kentucky | KY | 11.5 | 9.4 | 1.4 | 8.8 | 0.6 | Not significant | 32 | Reliable | EIA RECS 2020 and 2024 (preliminary) microdata, PC&S tabulation |
| Louisiana | LA | 11.5 | 9.5 | 1.36 | 7.7 | 1.8 | Not significant | 28 | Reliable | EIA RECS 2020 and 2024 (preliminary) microdata, PC&S tabulation |
| New Hampshire | NH | 11.3 | 8.3 | 1.48 | 7.1 | 1.2 | Not significant | 23 | Reliable | EIA RECS 2020 and 2024 (preliminary) microdata, PC&S tabulation |
| Texas | TX | 10.9 | 8.1 | 0.89 | 6.9 | 1.2 | Not significant | 83 | Reliable | EIA RECS 2020 and 2024 (preliminary) microdata, PC&S tabulation |
| Vermont | VT | 10.3 | 8.0 | 2.08 | 6.0 | 2.0 | Not significant | 15 | Reliable | EIA RECS 2020 and 2024 (preliminary) microdata, PC&S tabulation |
| Massachusetts | MA | 10.1 | 5.8 | 1.02 | 6.1 | -0.3 | Not significant | 34 | Reliable | EIA RECS 2020 and 2024 (preliminary) microdata, PC&S tabulation |
| Ohio | OH | 9.7 | 7.6 | 1.44 | 4.9 | 2.7 | Not significant | 26 | Reliable | EIA RECS 2020 and 2024 (preliminary) microdata, PC&S tabulation |
| Oklahoma | OK | 8.7 | 7.3 | 1.55 | 7.0 | 0.3 | Not significant | 22 | Reliable | EIA RECS 2020 and 2024 (preliminary) microdata, PC&S tabulation |
| South Carolina | SC | 8.7 | 7.4 | 1.93 | 7.0 | 0.4 | Not significant | 15 | Reliable | EIA RECS 2020 and 2024 (preliminary) microdata, PC&S tabulation |
| Tennessee | TN | 8.4 | 6.8 | 1.21 | 7.2 | -0.4 | Not significant | 35 | Reliable | EIA RECS 2020 and 2024 (preliminary) microdata, PC&S tabulation |
| Pennsylvania | PA | 7.8 | 6.2 | 1.13 | 8.7 | -2.5 | Not significant | 41 | Reliable | EIA RECS 2020 and 2024 (preliminary) microdata, PC&S tabulation |
| Georgia | GA | 7.5 | 6.0 | 1.39 | 7.6 | -1.6 | Not significant | 20 | Reliable | EIA RECS 2020 and 2024 (preliminary) microdata, PC&S tabulation |
| Indiana | IN | 6.8 | 5.6 | 1.31 | 7.8 | -2.2 | Not significant | 17 | Reliable | EIA RECS 2020 and 2024 (preliminary) microdata, PC&S tabulation |
| Delaware | DE | 6.6 | 5.5 | 1.64 | Suppressed | Suppressed in a year | 10 | Use with caution | EIA RECS 2020 and 2024 (preliminary) microdata, PC&S tabulation | |
| Maine | ME | 6.5 | 5.1 | 1.41 | 6.4 | -1.3 | Not significant | 11 | Reliable | EIA RECS 2020 and 2024 (preliminary) microdata, PC&S tabulation |
| Michigan | MI | 6.3 | 5.2 | 1.1 | 4.6 | 0.6 | Not significant | 20 | Reliable | EIA RECS 2020 and 2024 (preliminary) microdata, PC&S tabulation |
| Mississippi | MS | 6.1 | 5.3 | 1.42 | 5.8 | -0.5 | Not significant | 14 | Reliable | EIA RECS 2020 and 2024 (preliminary) microdata, PC&S tabulation |
| Alabama | AL | 5.9 | 5.0 | 1.23 | 8.7 | -3.7 | Significant (90%) | 16 | Reliable | EIA RECS 2020 and 2024 (preliminary) microdata, PC&S tabulation |
| North Carolina | NC | 5.8 | 4.7 | 1.14 | 2.6 | 2.1 | Not significant | 18 | Reliable | EIA RECS 2020 and 2024 (preliminary) microdata, PC&S tabulation |
| Arkansas | AR | 5.7 | 4.8 | 1.5 | Suppressed | Suppressed in a year | 11 | Use with caution | EIA RECS 2020 and 2024 (preliminary) microdata, PC&S tabulation | |
| Hawaii | HI | 5.5 | 3.6 | 1.08 | 4.3 | -0.7 | Not significant | 10 | Reliable | EIA RECS 2020 and 2024 (preliminary) microdata, PC&S tabulation |
| Illinois | IL | 5.2 | 3.5 | 0.99 | 4.2 | -0.7 | Not significant | 14 | Reliable | EIA RECS 2020 and 2024 (preliminary) microdata, PC&S tabulation |
| Missouri | MO | 5.1 | 4.1 | 1.45 | 4.7 | -0.6 | Not significant | 11 | Use with caution | EIA RECS 2020 and 2024 (preliminary) microdata, PC&S tabulation |
| Maryland | MD | 4.0 | 3.0 | 0.86 | 5.7 | -2.7 | Significant (90%) | 12 | Reliable | EIA RECS 2020 and 2024 (preliminary) microdata, PC&S tabulation |
| Alaska | AK | Suppressed | Suppressed | Suppressed | Suppressed in a year | 1 | Suppressed | EIA RECS 2020 and 2024 (preliminary) microdata, PC&S tabulation | ||
| Colorado | CO | Suppressed | Suppressed | Suppressed | Suppressed in a year | 2 | Suppressed | EIA RECS 2020 and 2024 (preliminary) microdata, PC&S tabulation | ||
| District of Columbia | DC | Suppressed | Suppressed | Suppressed | Suppressed in a year | 4 | Suppressed | EIA RECS 2020 and 2024 (preliminary) microdata, PC&S tabulation | ||
| Iowa | IA | Suppressed | Suppressed | Suppressed | Suppressed in a year | 5 | Suppressed | EIA RECS 2020 and 2024 (preliminary) microdata, PC&S tabulation | ||
| Idaho | ID | Suppressed | Suppressed | Suppressed | Suppressed in a year | 2 | Suppressed | EIA RECS 2020 and 2024 (preliminary) microdata, PC&S tabulation | ||
| Kansas | KS | Suppressed | Suppressed | 4.5 | Suppressed in a year | 6 | Suppressed | EIA RECS 2020 and 2024 (preliminary) microdata, PC&S tabulation | ||
| Minnesota | MN | Suppressed | Suppressed | Suppressed | Suppressed in a year | 4 | Suppressed | EIA RECS 2020 and 2024 (preliminary) microdata, PC&S tabulation | ||
| Montana | MT | Suppressed | Suppressed | Suppressed | Suppressed in a year | 1 | Suppressed | EIA RECS 2020 and 2024 (preliminary) microdata, PC&S tabulation | ||
| North Dakota | ND | Suppressed | Suppressed | Suppressed | Suppressed in a year | 4 | Suppressed | EIA RECS 2020 and 2024 (preliminary) microdata, PC&S tabulation | ||
| Nebraska | NE | Suppressed | Suppressed | Suppressed | Suppressed in a year | 9 | Suppressed | EIA RECS 2020 and 2024 (preliminary) microdata, PC&S tabulation | ||
| New Mexico | NM | Suppressed | Suppressed | Suppressed | Suppressed in a year | 4 | Suppressed | EIA RECS 2020 and 2024 (preliminary) microdata, PC&S tabulation | ||
| Oregon | OR | Suppressed | Suppressed | Suppressed | Suppressed in a year | 7 | Suppressed | EIA RECS 2020 and 2024 (preliminary) microdata, PC&S tabulation | ||
| South Dakota | SD | Suppressed | Suppressed | Suppressed | Suppressed in a year | 2 | Suppressed | EIA RECS 2020 and 2024 (preliminary) microdata, PC&S tabulation | ||
| Utah | UT | Suppressed | Suppressed | Suppressed | Suppressed in a year | 5 | Suppressed | EIA RECS 2020 and 2024 (preliminary) microdata, PC&S tabulation | ||
| Virginia | VA | Suppressed | Suppressed | 4.6 | Suppressed in a year | 6 | Suppressed | EIA RECS 2020 and 2024 (preliminary) microdata, PC&S tabulation | ||
| Washington | WA | Suppressed | Suppressed | Suppressed | Suppressed in a year | 9 | Suppressed | EIA RECS 2020 and 2024 (preliminary) microdata, PC&S tabulation | ||
| Wisconsin | WI | Suppressed | Suppressed | 3.8 | Suppressed in a year | 6 | Suppressed | EIA RECS 2020 and 2024 (preliminary) microdata, PC&S tabulation | ||
| West Virginia | WV | Suppressed | Suppressed | 7.5 | Suppressed in a year | 8 | Suppressed | EIA RECS 2020 and 2024 (preliminary) microdata, PC&S tabulation | ||
| Wyoming | WY | Suppressed | Suppressed | Suppressed | Suppressed in a year | 1 | Suppressed | EIA RECS 2020 and 2024 (preliminary) microdata, PC&S tabulation |
Source: EIA RECS 2020 and EIA RECS 2024 (preliminary) microdata, PC&S tabulation. ‘Suppressed’ means fewer than 10 sample pool homes or a relative standard error above 50%. Download CSV
Blank tiles: estimate suppressed (fewer than 10 sample pool homes or RSE over 50%).
Source: U.S. EIA, 2024 RECS preliminary microdata; PC&S tabulation. Download chart data (CSV)
Florida had the highest share of houses with their own pool in 2024 at 27.5%, followed by Arizona at 23.7% and Nevada at 16.1% (EIA RECS 2024).
Three state changes from 2020 to 2024 were significant at 90%: New York rose 1.9 points, Alabama fell 3.7 points and Maryland fell 2.7 points (EIA RECS 2024).
How much the answer depends on the source
The same metro can differ by 20 points or more depending on the source: Phoenix ranges from 23.7% (RECS 2024, Arizona houses) to 45.0% (AHS 2015, all homes). Property-record and survey sources agree on the order of metros more than on the level.
| Metro area | AHS 2015: all homes, pool on property (%) | AHS 2015: single-family homes (%) | AHS 2023: young-child households (%) | RECS 2024: home-state houses with own pool (%) | RECS state | LendingTree 2019 property records (%) | LendingTree figure via | OSM 2026: mapped pools per 100 houses |
|---|---|---|---|---|---|---|---|---|
| Phoenix | 45.0 | 36.8 | 38.5 | 23.7 | Arizona | 32.7 | LendingTree | 9.82 |
| Miami | 40.2 | 33.3 | 34.1 | 27.5 | Florida | 30.6 | LendingTree | 0.52 |
| Las Vegas | Not in AHS | Not in AHS | Not sampled | 16.1 | Nevada | 23.8 | Pool Magazine relay | 0.4 |
| Houston | 31.8 | 17.5 | 31.8 | 10.9 | Texas | Not published in text | 0.47 | |
| Dallas-Fort Worth | 31.4 | 15.3 | 32.2 | 10.9 | Texas | 13.8 | Pool Magazine relay | 0.24 |
| Riverside-San Bernardino | 27.4 | 22.1 | 25.4 | 14.3 | California | 18.3 | Pool Magazine relay | 0.75 |
| Los Angeles | 25.5 | 20.1 | 25.5 | 14.3 | California | 19 | Pool Magazine relay | 1.29 |
| San Francisco | 18.6 | 13.6 | 18.4 | 14.3 | California | Not published in text | 0.88 | |
| Atlanta | 24.2 | 14.2 | 14.8 | 7.5 | Georgia | Not published in text | 0.25 | |
| Denver | 21.2 | 7.1 | 13.5 | Suppressed | Colorado | Not published in text | 0.28 | |
| New York | 11.5 | 14.2 | 12.0 | 14.8 | New York | Not published in text | 0.96 | |
| Chicago | 10.3 | 7.2 | 10.8 | 5.2 | Illinois | Not published in text | 0.4 | |
| Kansas City | 15.6 | 7.8 | Not sampled | 5.1 | Missouri | 1.2 | LendingTree | 0.38 |
| Seattle | 13.0 | 5.2 | 12.6 | Suppressed | Washington | 1.3 | LendingTree | 0.21 |
| Portland | 12.9 | 5.8 | Not sampled | Suppressed | Oregon | 1.0 | LendingTree | 0.63 |
Sources: Census/HUD AHS 2015; Census/HUD AHS 2023; EIA RECS 2024; LendingTree (Aug 2019) and Pool Magazine (Apr 2022, relaying LendingTree); OpenStreetMap via Overpass. Download CSV
Sources measure different things: pool on the property (AHS), own pool (RECS), property-record pool flag (LendingTree).
Source: Census/HUD AHS 2015 and 2023; EIA RECS 2024; LendingTree (Aug 2019) and Pool Magazine relay (Apr 2022); PC&S tabulation. Download chart data (CSV)
LendingTree’s August 2019 analysis of property records put Phoenix at 32.7% of homes with a pool, Miami at 30.6% and Tampa at 27.7% (LendingTree).
The same LendingTree study put Portland at 1.0%, Kansas City at 1.2% and Seattle at 1.3%, far below the AHS 2015 single-family shares of 5.8%, 7.8% and 5.2% (LendingTree).
OpenStreetMap as a pool counter: a mapping completeness check
Mapped pools in OpenStreetMap are far too sparse to estimate the share of homes with a pool. Only Phoenix, where a large set of pools tagged as private has been added, reaches a quarter of the AHS-implied backyard pool stock.
| Metro area (2013 CBSA) | Counties matched in OSM | Occupied units covered (%) | OSM pool features | Tagged access=private (%) | ACS houses (2020-2024) | OSM pools per 100 houses | AHS 2015 single-family pool share (%) | AHS-implied single-family pool homes | OSM-to-AHS completeness ratio | Source |
|---|---|---|---|---|---|---|---|---|---|---|
| Phoenix-Mesa-Scottsdale, AZ | 2 of 2 | 100.0 | 154754 | 96.9 | 1576083 | 9.82 | 36.8 | 579999 | 0.27 | OpenStreetMap via Overpass API (Oct 6, 2026); ACS 2020-2024 B25024; AHS 2015 |
| Portland-Vancouver-Hillsboro, OR-WA | 7 of 7 | 100.0 | 4636 | 17.4 | 740061 | 0.63 | 5.8 | 42924 | 0.11 | OpenStreetMap via Overpass API (Oct 6, 2026); ACS 2020-2024 B25024; AHS 2015 |
| Cincinnati, OH-KY-IN | 15 of 15 | 100.0 | 7263 | 81.6 | 706531 | 1.03 | 12.5 | 88316 | 0.08 | OpenStreetMap via Overpass API (Oct 6, 2026); ACS 2020-2024 B25024; AHS 2015 |
| Memphis, TN-MS-AR | 9 of 9 | 100.0 | 3847 | 89.8 | 446943 | 0.86 | 11.8 | 52739 | 0.07 | OpenStreetMap via Overpass API (Oct 6, 2026); ACS 2020-2024 B25024; AHS 2015 |
| New York-Newark-Jersey City, NY-NJ-PA | 20 of 25 | 60.8 | 25608 | 60.8 | 2680129 | 0.96 | 14.2 | 380578 | 0.07 | OpenStreetMap via Overpass API (Oct 6, 2026); ACS 2020-2024 B25024; AHS 2015 |
| Chicago-Naperville-Elgin, IL-IN-WI | 14 of 14 | 100.0 | 9642 | 76.3 | 2395866 | 0.4 | 7.2 | 172502 | 0.06 | OpenStreetMap via Overpass API (Oct 6, 2026); ACS 2020-2024 B25024; AHS 2015 |
| Philadelphia-Camden-Wilmington, PA-NJ-DE-MD | 11 of 11 | 100.0 | 12414 | 75.0 | 1939869 | 0.64 | 11.0 | 213386 | 0.06 | OpenStreetMap via Overpass API (Oct 6, 2026); ACS 2020-2024 B25024; AHS 2015 |
| San Francisco-Oakland-Hayward, CA | 4 of 5 | 84.8 | 8183 | 55.2 | 930259 | 0.88 | 13.6 | 126515 | 0.06 | OpenStreetMap via Overpass API (Oct 6, 2026); ACS 2020-2024 B25024; AHS 2015 |
| Los Angeles-Long Beach-Anaheim, CA | 2 of 2 | 100.0 | 35736 | 48.9 | 2770721 | 1.29 | 20.1 | 556915 | 0.06 | OpenStreetMap via Overpass API (Oct 6, 2026); ACS 2020-2024 B25024; AHS 2015 |
| Kansas City, MO-KS | 14 of 14 | 100.0 | 2808 | 41.6 | 736414 | 0.38 | 7.8 | 57440 | 0.05 | OpenStreetMap via Overpass API (Oct 6, 2026); ACS 2020-2024 B25024; AHS 2015 |
| Boston-Cambridge-Newton, MA-NH | 7 of 7 | 100.0 | 5863 | 37.1 | 1113437 | 0.53 | 9.8 | 109117 | 0.05 | OpenStreetMap via Overpass API (Oct 6, 2026); ACS 2020-2024 B25024; AHS 2015 |
| Seattle-Tacoma-Bellevue, WA | 3 of 3 | 100.0 | 2259 | 47.6 | 1091042 | 0.21 | 5.2 | 56734 | 0.04 | OpenStreetMap via Overpass API (Oct 6, 2026); ACS 2020-2024 B25024; AHS 2015 |
| Cleveland-Elyria, OH | 5 of 5 | 100.0 | 2121 | 47.9 | 704585 | 0.3 | 8.2 | 57776 | 0.04 | OpenStreetMap via Overpass API (Oct 6, 2026); ACS 2020-2024 B25024; AHS 2015 |
| Denver-Aurora-Lakewood, CO | 8 of 10 | 69.9 | 1888 | 39.3 | 664903 | 0.28 | 7.1 | 47208 | 0.04 | OpenStreetMap via Overpass API (Oct 6, 2026); ACS 2020-2024 B25024; AHS 2015 |
| Washington-Arlington-Alexandria, DC-VA-MD-WV | 18 of 24 | 81.9 | 7158 | 48.2 | 1478505 | 0.48 | 12.4 | 183335 | 0.04 | OpenStreetMap via Overpass API (Oct 6, 2026); ACS 2020-2024 B25024; AHS 2015 |
| Houston-The Woodlands-Sugar Land, TX | 9 of 9 | 100.0 | 9430 | 33.3 | 2023169 | 0.47 | 17.5 | 354055 | 0.03 | OpenStreetMap via Overpass API (Oct 6, 2026); ACS 2020-2024 B25024; AHS 2015 |
| Riverside-San Bernardino-Ontario, CA | 2 of 2 | 100.0 | 9857 | 40.2 | 1321414 | 0.75 | 22.1 | 292032 | 0.03 | OpenStreetMap via Overpass API (Oct 6, 2026); ACS 2020-2024 B25024; AHS 2015 |
| Pittsburgh, PA | 7 of 7 | 100.0 | 3043 | 58.7 | 897444 | 0.34 | 11.7 | 105001 | 0.03 | OpenStreetMap via Overpass API (Oct 6, 2026); ACS 2020-2024 B25024; AHS 2015 |
| Raleigh, NC | 3 of 3 | 100.0 | 1165 | 27.6 | 473448 | 0.25 | 11.9 | 56340 | 0.02 | OpenStreetMap via Overpass API (Oct 6, 2026); ACS 2020-2024 B25024; AHS 2015 |
| Atlanta-Sandy Springs-Roswell, GA | 29 of 29 | 100.0 | 4714 | 35.9 | 1862932 | 0.25 | 14.2 | 264536 | 0.02 | OpenStreetMap via Overpass API (Oct 6, 2026); ACS 2020-2024 B25024; AHS 2015 |
| Milwaukee-Waukesha-West Allis, WI | 4 of 4 | 100.0 | 455 | 53.4 | 422914 | 0.11 | 5.4 | 22837 | 0.02 | OpenStreetMap via Overpass API (Oct 6, 2026); ACS 2020-2024 B25024; AHS 2015 |
| Detroit-Warren-Dearborn, MI | 6 of 6 | 100.0 | 3178 | 60.5 | 1526576 | 0.21 | 8.9 | 135865 | 0.02 | OpenStreetMap via Overpass API (Oct 6, 2026); ACS 2020-2024 B25024; AHS 2015 |
| Dallas-Fort Worth-Arlington, TX | 13 of 13 | 100.0 | 5208 | 48.6 | 2165883 | 0.24 | 15.3 | 331380 | 0.02 | OpenStreetMap via Overpass API (Oct 6, 2026); ACS 2020-2024 B25024; AHS 2015 |
| Miami-Fort Lauderdale-West Palm Beach, FL | 3 of 3 | 100.0 | 7362 | 47.2 | 1422509 | 0.52 | 33.3 | 473695 | 0.02 | OpenStreetMap via Overpass API (Oct 6, 2026); ACS 2020-2024 B25024; AHS 2015 |
| New Orleans-Metairie, LA | 8 of 8 | 100.0 | 321 | 37.4 | 414236 | 0.08 | 11.4 | 47223 | 0.01 | OpenStreetMap via Overpass API (Oct 6, 2026); ACS 2020-2024 B25024; AHS 2015 |
| Las Vegas-Henderson-Paradise, NV | 1 of 1 | 100.0 | 2585 | 55.5 | 651389 | 0.4 | Not in AHS | OpenStreetMap via Overpass API (Oct 6, 2026); ACS 2020-2024 B25024; AHS 2015 |
Sources: OpenStreetMap via Overpass (counts as of October 6, 2026); ACS 2020-2024; Census/HUD AHS 2015. PC&S calculation. Download CSV
A ratio of 1.0 would mean OSM has as many pool features as AHS-implied backyard pool homes.
Source: OpenStreetMap contributors via Overpass API (Oct 6, 2026); ACS 2020-2024 B25024; AHS 2015; PC&S calculation. Download chart data (CSV)
OpenStreetMap held 154,754 pool features in the Phoenix metro on October 6, 2026, 9.82 per 100 houses (OpenStreetMap via Overpass).
In the Miami metro, OpenStreetMap held 7,362 pool features on October 6, 2026, a completeness ratio of 0.02 against AHS (OpenStreetMap via Overpass).
The median completeness ratio across the 25 AHS metros was 0.04 (OSM in October 2026 against AHS 2015), and 23 of 25 metros were below 0.10.
Mapping density and survey shares still move together loosely: the Spearman rank correlation between OSM pools per 100 houses (2026) and the AHS 2015 single-family share across 25 metros was 0.52.
Swim season length and the share of homes with a pool
Metros with more warm days have more home pools, but climate explains under half of the variation. Los Angeles and San Francisco have more pools than their coastal airport stations’ climate would suggest.
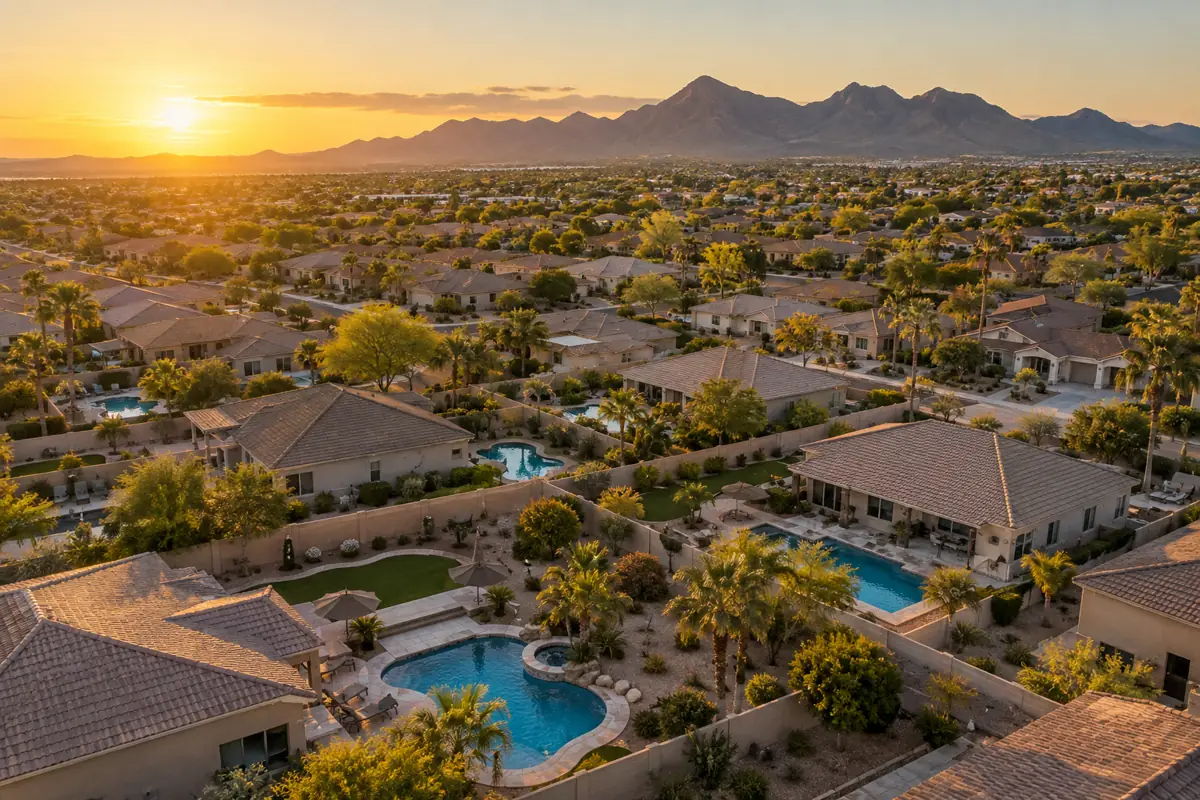
Across 25 metros, the Pearson correlation between average days per year with a high of at least 80F and the 2015 share of all homes with a pool was 0.77 (PC&S Swim Season Index; Census/HUD AHS 2015).
Using swim-season days (normal daily high at least 80F) across the same 25 metros, the correlation with 2015 shares was 0.72 for all homes and 0.67 for single-family homes.
A least-squares fit implies 2.33 more percentage points of single-family homes with a pool for every 30 additional swim-season days, with an R-squared of 0.45.
Miami has 265 swim-season days and Phoenix 232; Los Angeles scores 0 at its coastal airport station yet 20.1% of its single-family homes had a pool in 2015 (PC&S Swim Season Index).
Index results
- Phoenix-Mesa-Scottsdale: 45.0% of occupied homes had an outdoor pool on the property in 2015 (90% margin of error 2.9 points) (Census/HUD AHS 2015).
- Phoenix-Mesa-Scottsdale: 36.8% of single-family and mobile homes had a pool in 2015, an index of 309 against the US single-family share (Census/HUD AHS 2015).
- Miami-Fort Lauderdale-West Palm Beach: 33.3% of single-family homes had a pool in 2015, an index of 280 (Census/HUD AHS 2015).
- Seattle-Tacoma-Bellevue had the lowest single-family share of the 25 AHS metros in 2015 at 5.2% (Census/HUD AHS 2015).
- Milwaukee-Waukesha-West Allis had the lowest all-homes share in 2015 at 7.7%, so the Phoenix share was 5.8 times the Milwaukee share (Census/HUD AHS 2015 metro file).
- Los Angeles-Long Beach-Anaheim had the largest number of homes with a pool on the property among the 25 metros in 2015: 1,107 thousand (Census/HUD AHS 2015).
- 13 of the 25 AHS metros were above the 2015 US all-homes share of 16.6% (Census/HUD AHS 2015).
- In Denver-Aurora-Lakewood, 21.2% of all homes but only 7.1% of single-family homes had a pool in 2015; 23.9% of Denver’s pool homes were single-family (Census/HUD AHS 2015 metro file).
- Among US households with children under 7 living in or visiting, 16.3% had an outdoor pool on the property in 2023, up from 15.1% in 2015 (Census/HUD AHS 2023).
- Dallas-Fort Worth young-child households with a pool rose 6.9 points from 2015 to 2023, to 32.2% (Census/HUD AHS 2023).
- United States: 7.2% of all homes had their own pool in 2024, compared with 6.9% in 2020 (EIA RECS 2024 Table HC2.1).
- New York State’s share of all homes with their own pool rose from 5.3% in 2020 to 7.2% in 2024, a change significant at 90% (EIA RECS 2024).
- Texas: 8.1% of all homes and 10.9% of houses had their own pool in 2024 (EIA RECS 2024).
- Phoenix has the most complete OpenStreetMap pool layer of the 25 metros: 154,754 mapped pool features, a completeness ratio of 0.27 (October 6, 2026) (OpenStreetMap via Overpass).
- Each additional 30 swim-season days is associated with 2.33 more percentage points of single-family homes with a pool across 25 metros (R-squared 0.45) (PC&S Swim Season Index).
Scores, ranks and sensitivity
Backyard Pool Prevalence Index (metro ranking)
Which large US metros have the highest share of single-family homes with a pool?
Index = metro single-family pool share / US single-family pool share x 100 (AHS 2015)Inputs: fact rows #51, #39, #63, #7 and the other AHS single-family rows; derived rows #490, #487
Limitations: 2015 data; 90% margins of error of 1.3 to 3.4 points; may include some HOA pools reported by single-family respondents.
State and division shares, 2024 vs 2020
Where are home pools most common by state and region now, and did that change since 2020?
Share = weighted homes with own pool / weighted homes; change = 2024 share - 2020 share; z = change / sqrt(se2020^2 + se2024^2)Inputs: fact rows #191, #192, #305, #306, #232, #214; derived rows #536, #561, #540, #552
Limitations: 2024 RECS preliminary; 19 state estimates (including DC) suppressed for 2024; multiple comparisons.
OSM-to-AHS mapping completeness ratio
Can OpenStreetMap stand in for a survey of home pools?
Ratio = OSM pool features / (AHS 2015 single-family pool share x ACS 2020-2024 houses)Inputs: fact rows #359, #358, #51 and the equivalent rows for each metro; derived rows #575, #625, #626
Limitations: Different years (2015 survey vs 2026 map); OSM includes shared pools; some counties unmatched.
Swim season association
Do metros with longer swim seasons have more home pools?
Pearson r between days with a normal high of at least 80F and AHS 2015 pool shares; OLS slope of single-family share on swim-season daysInputs: swim-season rows (e.g. #434, #435) and AHS rows; derived rows #628, #629, #630, #632
Limitations: Association only; one airport station per metro; 25 observations.
Young-child household change, 2015 to 2023
Has the share of homes with a pool changed since the 2015 AHS?
Change = 2023 share - 2015 share among households with children under 7; z from replicate-weight standard errorsInputs: fact rows #115, #141, #119, #145; derived rows #529, #514, #634
Limitations: Covers only households with young children; independent-sample variance approximation.
Takeaways
- Phoenix had the highest share of homes with a pool among 25 large US metros in 2015: 45.0% of all occupied homes and 36.8% of single-family homes (Census/HUD AHS 2015).
- Miami ranked second in 2015 with 40.2% of all homes and 33.3% of single-family homes; the Phoenix lead is statistically clear on the all-homes measure but not on the single-family measure (Census/HUD AHS 2015).
- Across the United States, 16.6% of occupied homes had a pool somewhere on the property in 2015, and 11.9% of single-family and mobile homes did (Census/HUD AHS 2015).
- Florida had the highest state share in 2024: 27.5% of houses and 19.9% of all homes had their own pool (EIA RECS 2024, preliminary).
- Arizona followed in 2024 with 23.7% of houses, then Nevada with 16.1% (EIA RECS 2024).
- The Mountain South division (Arizona, Nevada, New Mexico) had the highest division share in 2024 at 14.3% of all homes; only the Pacific division changed significantly from 2020, rising from 6.0% to 7.6% (EIA RECS 2024).
- OpenStreetMap is not a usable pool census: in 23 of 25 metros it maps fewer than 10% of the backyard pools implied by AHS, as of October 6, 2026 (OpenStreetMap via Overpass).
- Swim season length tracks pool prevalence: across 25 metros the correlation between days with a high of at least 80F and the 2015 share of homes with a pool is 0.77 (PC&S Swim Season Index).
Questions this index answers
What percentage of homes in Florida have a pool?
In 2024, 19.9% of all Florida homes and 27.5% of Florida houses had their own swimming pool, the highest state shares in the EIA survey (EIA RECS 2024, preliminary). In the Miami metro, 40.2% of homes had a pool on the property in 2015, counting complex pools (Census/HUD AHS 2015).
Which city has the most backyard pools?
Phoenix has the highest share: 36.8% of single-family homes in the Phoenix metro had a pool in 2015, the top value among 25 metros (Census/HUD AHS 2015). By number, Los Angeles had the most homes with a pool on the property, 1,107 thousand in 2015.
What percentage of homes in Arizona have pools?
In 2024, 18.9% of all Arizona homes and 23.7% of Arizona houses had their own pool (EIA RECS 2024, preliminary). In the Phoenix metro, 45.0% of all homes had a pool on the property in 2015 (Census/HUD AHS 2015).
How common are pools in Texas homes?
In 2024, 8.1% of all Texas homes and 10.9% of Texas houses had their own pool (EIA RECS 2024). In 2015, 17.5% of single-family homes in Houston and 15.3% in Dallas-Fort Worth had a pool (Census/HUD AHS 2015).
Do most homes in Las Vegas have pools?
No. In 2024, 16.1% of Nevada houses and 11.8% of all Nevada homes had their own pool (EIA RECS 2024); Clark County holds 71.7% of Nevada’s occupied homes (ACS 2020-2024). LendingTree’s 2019 property-record study, as relayed by Pool Magazine, put the Las Vegas metro at 23.8%. AHS did not sample Las Vegas for its pool item.
Data vintage
- PC&S counted OpenStreetMap pool features in 26 metros through the Overpass API and matched them to ACS 2020-2024 housing counts.
- EIA published 2024 RECS highlights and said the full 2024 data set will follow in spring 2027; the 2024 shares in this report are preliminary.
- EIA released the preliminary 2024 RECS housing characteristics microdata used for the 2024 state and division shares.
- The Census Bureau released ACS 2020-2024 5-year data, used here for county housing counts.
- The Census Bureau announced that the AHS will move to continuous collection, delayed until January 2026 or later; the listed topics do not include the pool safety module.
FAQ
What percentage of US homes have a swimming pool?
In 2024, 7.2% of all US homes had their own pool, according to EIA RECS 2024 Table HC2.1. Counting shared apartment and condo pools, 16.6% of occupied homes had a pool on the property in 2015 (Census/HUD AHS 2015).
What share of single-family homes have a pool?
In 2024, 9.8% of US houses (single-family and mobile homes) had their own pool (EIA RECS 2024). The AHS figure for 2015 was 11.9% of single-family and mobile homes (Census/HUD AHS 2015).
Which state has the highest percentage of homes with pools?
Florida, at 27.5% of houses in 2024, followed by Arizona at 23.7% (EIA RECS 2024, preliminary).
What percentage of homes in California have a pool?
In 2024, 9.8% of all California homes and 14.3% of California houses had their own pool (EIA RECS 2024). In 2015, 20.1% of single-family homes in the Los Angeles metro had a pool (Census/HUD AHS 2015).
Which large metro has the fewest home pools?
Among 25 AHS metros in 2015, Seattle had the lowest single-family share at 5.2% and Milwaukee the lowest all-homes share at 7.7% (Census/HUD AHS 2015).
Has the share of homes with a pool increased?
Not by a clear margin. The US share of all homes with their own pool was 6.9% in 2020 and 7.2% in 2024, a difference that is not statistically significant at 90% (EIA RECS 2024 Table HC2.1). Among households with young children, the AHS share rose from 15.1% in 2015 to 16.3% in 2023, a change just significant at 90% (Census/HUD AHS 2023).
Why do sources disagree on the share of homes with pools?
They count different things. AHS counts a pool anywhere on the grounds, so Phoenix reaches 45.0% of all homes in 2015; RECS counts a home’s own pool, so Arizona houses reach 23.7% in 2024 (2015 AHS Definitions; RECS questionnaire).
Is there newer metro-level data than 2015?
Only for households with children under 7: in 2023, 38.5% of such households in Phoenix had a pool on the property (Census/HUD AHS 2023). The next AHS moves to continuous collection starting January 2026 or later (Census Bureau).
Can satellite or map data count backyard pools?
Not from OpenStreetMap today: in 23 of 25 metros it maps fewer than 10% of the backyard pools implied by AHS, as of October 6, 2026 (OpenStreetMap via Overpass).
Does climate explain where pools are common?
Partly. Across 25 metros, days with a high of at least 80F correlate at 0.77 with the 2015 share of homes with a pool (PC&S Swim Season Index); the single-family fit has an R-squared of 0.45.
Using and citing the index
Index figures to quote
- In 2015, 36.8% of single-family homes in the Phoenix metro had a swimming pool, the highest share of 25 large US metros (Census/HUD AHS). (U.S. Census Bureau and HUD)
- In 2024, 27.5% of Florida houses had their own swimming pool, the highest share of any state (EIA RECS, preliminary). (U.S. Energy Information Administration)
- In 2024, 7.2% of all US homes had their own swimming pool (EIA RECS). (U.S. Energy Information Administration)
- In 2015, 16.6% of US occupied homes had a pool somewhere on the property, counting shared apartment and condo pools (Census/HUD AHS). (U.S. Census Bureau)
- In 2023, 16.3% of US households with children under 7 had an outdoor pool on the property (Census/HUD AHS). (U.S. Census Bureau and HUD)
- As of October 2026, OpenStreetMap mapped fewer than 10% of the backyard pools implied by AHS in 23 of 25 large US metros (PC&S calculation). (OpenStreetMap contributors (ODbL))
Underlying datasets
- AHS 2015 National Public Use File (PUF) v3.1, CSV download, U.S. Census Bureau and HUD
- 2015 AHS Table Specifications (Table S-01-AO, Metros sheet), U.S. Census Bureau
- 2024 RECS public use microdata file (preliminary, v1), U.S. Energy Information Administration
- 2024 RECS Table HC2.1, Structural and geographic characteristics, U.S. Energy Information Administration
- AHS 2023 National Public Use File (PUF) v1.1, CSV download, U.S. Census Bureau and HUD
- AHS 2023 Table Specifications and PUF Estimates for User Verification, U.S. Census Bureau
Index brief
Phoenix is the large US metro where home swimming pools are most common, according to a PC&S index built from Census Bureau and HUD American Housing Survey microdata. In 2015, the latest year the survey asked every household about pools, 36.8% of single-family homes in the Phoenix metro had one, against 11.9% nationally. Miami was second at 33.3%, and Seattle was lowest at 5.2%. Counting shared apartment and condo pools, 45.0% of Phoenix homes had a pool on the property. Newer state data from the Energy Information Administration show 27.5% of Florida houses and 23.7% of Arizona houses had their own pool in 2024. Nationally, 7.2% of all homes had one. Swim season length explains part of the pattern: metros with more days above 80F have higher pool shares. OpenStreetMap counts cannot fill the gap, since in 23 of 25 metros the map holds fewer than 10% of the pools the survey implies.
Headlines the index supports
- Phoenix tops US metros for home pools: 36.8% of single-family homes have one
- Florida leads the states as 27.5% of houses have their own pool
- Only 7.2% of US homes have a private swimming pool, federal survey shows
- Longer swim seasons, more backyard pools: the metro data lines up
- Online maps miss more than 90% of backyard pools in most big US metros
Cite the index
Pool Construction & Service. "Percentage of Homes With Pools by Metro and State: Backyard Pool Prevalence Index." PC&S Research Desk, October 6, 2026. https://poolconstructionandservice.com/research/percentage-of-homes-with-pools/
Reuse terms
The data tables and charts in this report are licensed under CC BY 4.0. Reuse them with this attribution: “Source: Pool Construction & Service (poolconstructionandservice.com), Percentage of Homes With Pools by Metro and State: Backyard Pool Prevalence Index.” Figures from third-party sources remain subject to their publishers’ terms.
Index data
- Backyard Pool Prevalence Index, 25 US metros, 2015 (AHS) CSV
- Young-child households with a pool by metro, 2015 and 2023 (AHS) CSV
- Homes with their own pool by Census division, 2020 and 2024 (RECS) CSV
- Homes with their own pool by state, 2020 and 2024 (RECS) CSV
- Pool share by metro across five sources CSV
- OpenStreetMap pool mapping completeness by metro, 2026 CSV
- Full fact sheet with sources and limitations CSV
Source grading
Tier 1: primary and government sources (24)
- U.S. Census Bureau and HUD: AHS 2015 National Public Use File (PUF) v3.1, CSV download
- U.S. Census Bureau and HUD: AHS 2015 Metropolitan Public Use File (PUF) v3.1, CSV download
- U.S. Census Bureau: 2015 AHS Table Specifications (Table S-01-AO, Metros sheet)
- U.S. Census Bureau and HUD: 2015 AHS Definitions
- U.S. Census Bureau and HUD: AHS 2023 National Public Use File (PUF) v1.1, CSV download
- U.S. Census Bureau and HUD: AHS 2023 Metropolitan Public Use File (PUF) v1.1, CSV download
- U.S. Census Bureau: AHS 2023 Table Specifications and PUF Estimates for User Verification
- U.S. Census Bureau and HUD: 2023 AHS Definitions
- U.S. Energy Information Administration: 2024 RECS public use microdata file (preliminary, v1)
- U.S. Energy Information Administration: 2020 RECS public use microdata file (v7)
- U.S. Energy Information Administration: 2024 RECS Table HC2.1, Structural and geographic characteristics
- U.S. Energy Information Administration: 2020 RECS Table HC2.1
- U.S. Energy Information Administration: Residential Energy Consumption Survey (RECS) home page and release notes
- U.S. Energy Information Administration: How to Use the RECS 2024 Microdata File
- U.S. Energy Information Administration: RECS Form EIA-457A Questionnaire Content
- U.S. Census Bureau: American Housing Survey to Adopt New Data Collection Model
- U.S. Census Bureau: ACS 2020-2024 5-year summary file, Table B25024 (units in structure)
- U.S. Census Bureau: ACS 2020-2024 5-year summary file, Table B25002 (occupancy status)
- U.S. Census Bureau: ACS 2024 data release schedule
- U.S. Census Bureau / OMB: Core based statistical area delineation file, February 2013 (list 1)
- NOAA National Centers for Environmental Information: U.S. Climate Normals 1991-2020
- Pool Construction & Service: Pool Season Length by City: Swim Season Index for 60 US Metros
- U.S. Energy Information Administration: Using the Microdata File to Compute Estimates and Standard Errors (2020 RECS)
- U.S. Census Bureau: American Housing Survey (AHS) Data
Tier 2: trade bodies, public companies, market research (3)
- OpenStreetMap contributors (ODbL): Overpass API queries of OpenStreetMap data (leisure=swimming_pool), October 6, 2026
- OpenStreetMap Wiki: Tag:leisure=swimming_pool
- LendingTree: Swimming Pools Are a Highly Prized Amenity Amid the Summer Heat (Aug 20, 2019)
Tier 3: journalism and expert commentary (2)
Data sources
- U.S. Census Bureau and HUD. AHS 2015 National Public Use File (PUF) v3.1, CSV download. Accessed 2026-10-06.
- U.S. Census Bureau and HUD. AHS 2015 Metropolitan Public Use File (PUF) v3.1, CSV download. Accessed 2026-10-06.
- U.S. Census Bureau. 2015 AHS Table Specifications (Table S-01-AO, Metros sheet). Accessed 2026-10-06.
- U.S. Census Bureau and HUD. 2015 AHS Definitions. Accessed 2026-10-06.
- U.S. Census Bureau and HUD. AHS 2023 National Public Use File (PUF) v1.1, CSV download. Accessed 2026-10-06.
- U.S. Census Bureau and HUD. AHS 2023 Metropolitan Public Use File (PUF) v1.1, CSV download. Accessed 2026-10-06.
- U.S. Census Bureau. AHS 2023 Table Specifications and PUF Estimates for User Verification. Accessed 2026-10-06.
- U.S. Census Bureau and HUD. 2023 AHS Definitions. Accessed 2026-10-06.
- U.S. Energy Information Administration. 2024 RECS public use microdata file (preliminary, v1). Accessed 2026-10-06.
- U.S. Energy Information Administration. 2020 RECS public use microdata file (v7). Accessed 2026-10-06.
- U.S. Energy Information Administration. 2024 RECS Table HC2.1, Structural and geographic characteristics. Accessed 2026-10-06.
- U.S. Energy Information Administration. 2020 RECS Table HC2.1. Accessed 2026-10-06.
- U.S. Energy Information Administration. Residential Energy Consumption Survey (RECS) home page and release notes. Accessed 2026-10-06.
- U.S. Energy Information Administration. How to Use the RECS 2024 Microdata File. Accessed 2026-10-06.
- U.S. Energy Information Administration. RECS Form EIA-457A Questionnaire Content. Accessed 2026-10-06.
- U.S. Census Bureau. American Housing Survey to Adopt New Data Collection Model. Accessed 2026-10-06.
- OpenStreetMap contributors (ODbL). Overpass API queries of OpenStreetMap data (leisure=swimming_pool), October 6, 2026. Accessed 2026-10-06.
- OpenStreetMap Wiki. Tag:leisure=swimming_pool. Accessed 2026-10-06.
- U.S. Census Bureau. ACS 2020-2024 5-year summary file, Table B25024 (units in structure). Accessed 2026-10-06.
- U.S. Census Bureau. ACS 2020-2024 5-year summary file, Table B25002 (occupancy status). Accessed 2026-10-06.
- U.S. Census Bureau. ACS 2024 data release schedule. Accessed 2026-10-06.
- U.S. Census Bureau / OMB. Core based statistical area delineation file, February 2013 (list 1). Accessed 2026-10-06.
- NOAA National Centers for Environmental Information. U.S. Climate Normals 1991-2020. Accessed 2026-10-06.
- Pool Construction & Service. Pool Season Length by City: Swim Season Index for 60 US Metros. Accessed 2026-10-06.
- LendingTree. Swimming Pools Are a Highly Prized Amenity Amid the Summer Heat (Aug 20, 2019). Accessed 2026-10-06.
- Pool Magazine. U.S. Cities With The Most Residential Swimming Pools (Apr 2022). Accessed 2026-10-06.
- PoolGuard USA. What State Has The Most Pools? (2026 Rankings). Accessed 2026-10-06.
- U.S. Energy Information Administration. Using the Microdata File to Compute Estimates and Standard Errors (2020 RECS). Accessed 2026-10-06.
- U.S. Census Bureau. American Housing Survey (AHS) Data. Accessed 2026-10-06.
Related pool research
Pool Construction Statistics: New Pool Permits in 14 US Markets, 2015 to 2026
Number of Swimming Pools in the US: Published Estimates Reconciled

Pool Permit Processing Time: Days From Application to Issue in 12 US Cities, 2019 to 2026
Pool Removal Statistics: Permit Counts for US Cities, 2015 to 2026
How Many Homes Have a Hot Tub? US State Atlas of Hot Tub and Spa Ownership, 2024

Pool Industry Market Size: US Revenue Estimates Reconciled, 2017 to 2026
All pool industry research (40 reports)