Cities With the Most Pools: A 2022 to 2023 Satellite Census of 25 US Metros
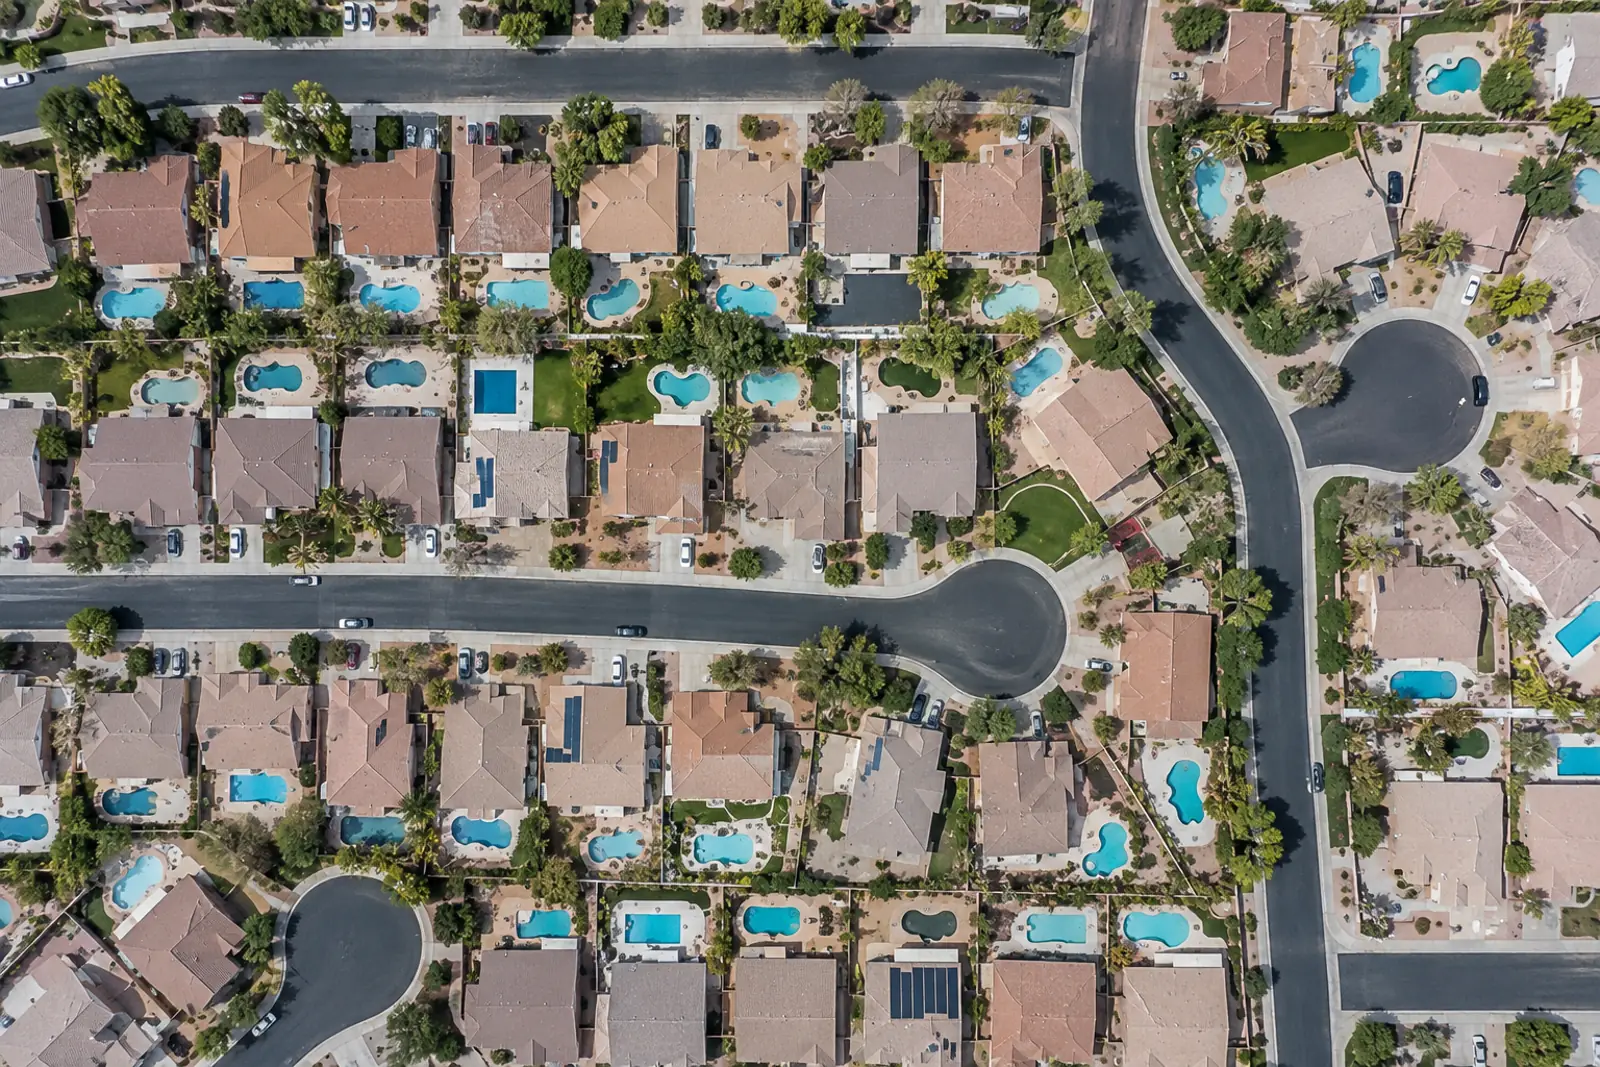
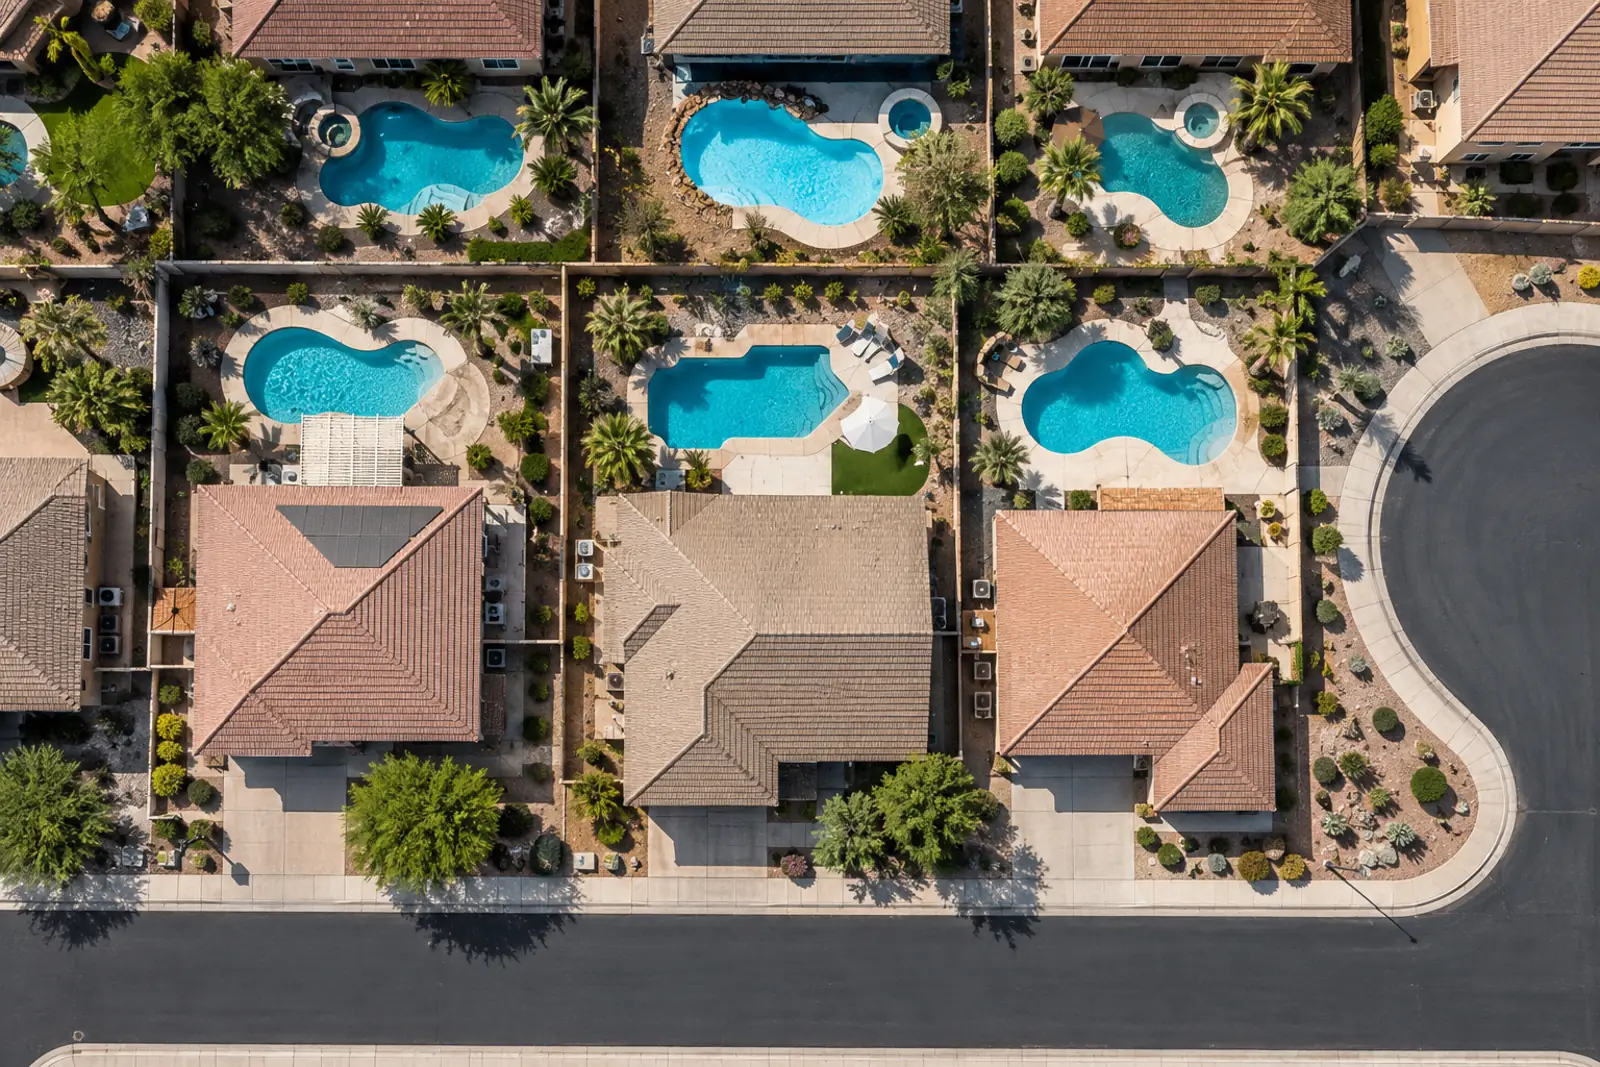
Among 25 US metros we counted from 2022 to 2023 USDA aerial imagery, the cities with the most pools are Phoenix (239 backyard pools per 1,000 housing units), Cape Coral-Fort Myers (202) and North Port-Sarasota (183). These are sampled estimates with wide intervals, likely conservative, and cover only the metros tested; Atlanta, Washington and Seattle could not be measured.
Cities with the most pools: metro ranking from 2022 to 2023 aerial imagery
Phoenix has the highest density of backyard pools of the 22 metros we could measure. All five top-ranked metros are in Arizona or Florida. Intervals are wide, so neighbouring ranks are not statistically distinct.
The Phoenix metro has 239 pools per 1,000 housing units (95% CI 168 to 320), based on NAIP imagery flown in 2023 (PC&S satellite census).
Cape Coral-Fort Myers, FL has 202 pools per 1,000 housing units (95% CI 141 to 272). North Port-Sarasota, FL has 183 pools per 1,000 housing units (95% CI 122 to 251). Both were imaged in January 2023 (PC&S satellite census).
Miami has 154 pools per 1,000 housing units (95% CI 104 to 206), and Tucson has 150 pools per 1,000 housing units (95% CI 88 to 221) (PC&S satellite census).
| Rank | Metro (2023 CBSA) | Pools per 1,000 housing units | 95% CI low | 95% CI high | Estimated pools | Pools CI low | Pools CI high | Pools per 100 houses (indicative) | NAIP imagery | Detector precision | Status |
|---|---|---|---|---|---|---|---|---|---|---|---|
| 1 | Phoenix | 239 | 168 | 320 | 475500 | 332800 | 636400 | 31.5 | AZ 2023, mostly Sep 2023 | 100% | Ranked |
| 2 | Cape Coral-Fort Myers | 202 | 141 | 272 | 84300 | 58600 | 113100 | 27.9 | FL 2023, mostly Jan 2023 | 93% | Ranked |
| 3 | North Port-Sarasota | 183 | 122 | 251 | 84100 | 56000 | 115500 | 24.0 | FL 2023, mostly Jan 2023 | 90% | Ranked |
| 4 | Miami | 154 | 104 | 206 | 405600 | 275100 | 544800 | 28.8 | FL 2022 and 2023, mostly Jan 2023 | 88% | Ranked |
| 5 | Tucson | 150 | 88 | 221 | 70600 | 41200 | 104100 | 19.5 | AZ 2023, mostly Oct 2023 | 100% | Ranked |
| 6 | Fresno | 146 | 105 | 188 | 56500 | 40900 | 73100 | 19.2 | CA 2022, mostly Jun 2022 | 95% | Ranked |
| 7 | Riverside-San Bernardino | 139 | 94 | 189 | 219500 | 149300 | 298500 | 17.0 | CA 2022, mostly May 2022 | 88% | Ranked |
| 8 | Sacramento | 123 | 87 | 163 | 114600 | 81000 | 151900 | 16.0 | CA, NV 2022, mostly Jun 2022 | 93% | Ranked |
| 9 | Tampa | 118 | 58 | 206 | 173100 | 85700 | 301700 | 16.4 | FL 2023, mostly Jan 2023 | 80% | Ranked |
| 10 | Orlando | 109 | 66 | 159 | 118900 | 72200 | 172900 | 15.5 | FL 2023, mostly Jan 2023 | 80% | Ranked |
| 11 | Jacksonville | 106 | 64 | 161 | 73400 | 44100 | 111200 | 14.3 | FL, GA 2023, mostly Jan 2023 | 80% | Ranked |
| 12 | Las Vegas | 99 | 59 | 146 | 90900 | 53800 | 134300 | 14.4 | AZ, NV 2022 and 2023, mostly Jun 2022 | 100% | Ranked |
| 13 | Dallas-Fort Worth | 84 | 54 | 141 | 246200 | 157800 | 414300 | 12.2 | TX 2022, mostly Jul 2022 | 98% | Ranked |
| 14 | San Diego | 72 | 43 | 109 | 88600 | 52600 | 134400 | 11.5 | CA 2022, mostly Apr 2022 | 88% | Ranked |
| 15 | Los Angeles | 71 | 44 | 102 | 336000 | 209200 | 481300 | 12.4 | CA 2022, mostly May 2022 | 88% | Ranked |
| 16 | Houston | 57 | 37 | 93 | 156200 | 101100 | 257100 | 8.1 | TX 2022, mostly Sep 2022 | 95% | Ranked |
| 17 | Philadelphia | 53 | 31 | 95 | 136000 | 79700 | 245500 | 7.2 | DE, MD, NJ, PA 2022 and 2023, mostly Jul 2023 | 100% | Ranked |
| 18 | New York | 47 | 26 | 84 | 370000 | 207200 | 667600 | 11.1 | NJ, NY 2022 and 2023, mostly Aug 2023 | 88% | Ranked |
| 19 | Austin | 38 | 23 | 65 | 35700 | 21600 | 61400 | 5.8 | TX 2022, mostly Jun 2022 | 90% | Ranked |
| 20 | Chicago | 36 | 20 | 66 | 138200 | 79000 | 255900 | 6.0 | IL, IN 2022 and 2023, mostly Jul 2023 | 65% | Ranked, lower confidence |
| 21 | San Antonio | 29 | 18 | 50 | 29600 | 17900 | 50400 | 4.0 | TX 2022, mostly Jun 2022 | 98% | Ranked |
| 22 | Denver | 2 | 1 | 3 | 1900 | 900 | 3800 | 0.2 | CO 2023, mostly Sep 2023 | 72% | Ranked, lower confidence |
| Seattle | 24 | 9 | 58 | 40100 | 14600 | 96400 | 3.9 | WA 2023, mostly Oct 2023 | 35% | Not estimable | |
| Atlanta | 10 | 1 | 42 | 23500 | 3200 | 102600 | 1.3 | GA 2023, mostly Oct 2023 | 8% | Not estimable | |
| Washington DC | 1 | 0 | 6 | 1800 | 100 | 14500 | 0.1 | MD, VA, WV 2022 and 2023, mostly Oct 2023 | 3% | Not estimable |
Source: PC&S satellite census of USDA NAIP imagery via Planetary Computer NAIP; housing units from Census TIGERweb (2020) and ACS 2024 (B25001). Download CSV
Atlanta, Washington DC and Seattle are excluded: detector precision below 50% in October 2023 imagery.
Source: PC&S satellite pool census of USDA NAIP imagery (2022 to 2023), 96 sampled 500 m cells per metro. Download chart data (CSV)
The lowest ranked rates are San Antonio at 29 and Austin at 38 pools per 1,000 housing units, both 2022 imagery (PC&S satellite census). Denver shows 2 per 1,000 in imagery flown on September 25, 2023, late in the outdoor swimming season; see pool season length by city.
For survey-based shares of homes with pools by state and metro, see percentage of homes with pools. For public pools rather than backyard pools, see public pools by city.
Estimated backyard pools by metro, 2022 to 2023
Totals combine pool density with metro size. Phoenix ranks first in total pools as well as per home, and the large coastal metros follow despite lower densities.
The Phoenix metro has an estimated 475,500 backyard pools (95% CI 332,800 to 636,400) in 2023 (PC&S satellite census).
The Miami metro has an estimated 405,600 backyard pools (95% CI 275,100 to 544,800) in 2022 and 2023 imagery (PC&S satellite census).
The New York metro has an estimated 370,000 backyard pools (95% CI 207,200 to 667,600), and the Los Angeles metro has an estimated 336,000 backyard pools (95% CI 209,200 to 481,300) (PC&S satellite census).
Dallas-Fort Worth has an estimated 246,200 backyard pools (95% CI 157,800 to 414,300) in 2022 imagery (PC&S satellite census).
Totals carry wide intervals; see the ranking table.
Source: PC&S satellite pool census of USDA NAIP imagery (2022 to 2023), 96 sampled 500 m cells per metro. Download chart data (CSV)
Sampled neighborhoods: the 500 m cell atlas
The census rests on 2,400 random draws of 500 m cells, 96 per metro, covering 2,366 unique cells. Cells were drawn in proportion to their 2020 Census housing units, so every home in a metro had the same chance of putting its neighborhood in the sample.
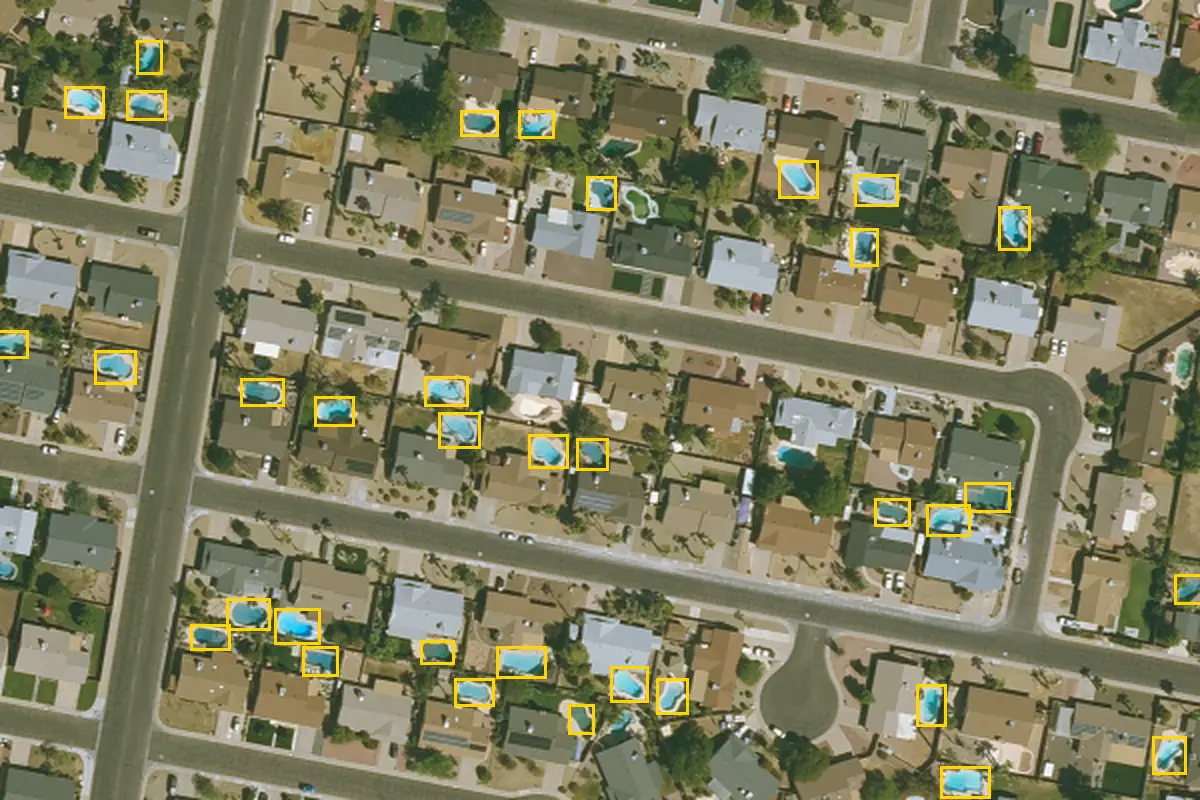
Each draw picks one 2020 Census housing unit at random from the metro (Census TIGERweb) and takes the 500 m grid cell that holds its census block’s internal point. The draws came in two independent waves of 48 per metro.
In Phoenix, 4 of 96 draws contained no detected pool. In Chicago, 12 of 96 draws contained none (PC&S satellite census).
| Metro | Cell draws | Unique 500 m cells | Draws with no pool detected | Pools detected (raw) | Raw pools per 1,000 housing units | Frame coverage | Housing units, 2020 Census | Housing units, ACS 2024 | First image date | Last image date |
|---|---|---|---|---|---|---|---|---|---|---|
| Atlanta | 96 | 96 | 23 | 524 | 56.5 | 74.2% | 2419737 | 2573295 | 2023-10-03 | 2023-10-22 |
| Austin | 96 | 95 | 24 | 356 | 27.8 | 84.8% | 946764 | 1127379 | 2022-06-08 | 2022-07-06 |
| Cape Coral-Fort Myers | 96 | 93 | 6 | 2318 | 156.6 | 84.7% | 416332 | 465172 | 2023-01-16 | 2023-02-14 |
| Chicago | 96 | 96 | 12 | 774 | 30.6 | 94.8% | 3871494 | 3924020 | 2022-06-16 | 2023-08-24 |
| Dallas-Fort Worth | 96 | 96 | 13 | 822 | 57.7 | 86.0% | 2947189 | 3235415 | 2022-07-03 | 2022-07-19 |
| Denver | 96 | 94 | 70 | 43 | 1.2 | 95.1% | 1242492 | 1328534 | 2023-08-21 | 2023-09-25 |
| Fresno | 96 | 91 | 11 | 1602 | 90.4 | 87.6% | 388013 | 403273 | 2022-06-10 | 2022-08-07 |
| Houston | 96 | 96 | 13 | 787 | 41.0 | 87.7% | 2753960 | 3044006 | 2022-07-11 | 2022-09-22 |
| Jacksonville | 96 | 94 | 14 | 1034 | 88.8 | 79.1% | 690609 | 773093 | 2023-01-17 | 2023-10-21 |
| Las Vegas | 96 | 95 | 10 | 979 | 65.4 | 95.2% | 917656 | 975834 | 2022-06-10 | 2023-07-08 |
| Los Angeles | 96 | 96 | 6 | 1547 | 52.6 | 96.1% | 4721766 | 4870148 | 2022-04-24 | 2022-05-12 |
| Miami | 96 | 95 | 3 | 3170 | 141.6 | 95.5% | 2641002 | 2714779 | 2022-01-18 | 2023-02-28 |
| New York | 96 | 96 | 18 | 739 | 30.5 | 97.4% | 7942708 | 8129556 | 2022-07-19 | 2023-09-01 |
| North Port-Sarasota | 96 | 92 | 5 | 1912 | 140.1 | 81.6% | 459864 | 517068 | 2023-01-06 | 2023-02-07 |
| Orlando | 96 | 95 | 5 | 1406 | 101.1 | 87.6% | 1087949 | 1197348 | 2023-01-06 | 2023-02-14 |
| Philadelphia | 96 | 95 | 30 | 292 | 26.9 | 87.0% | 2586947 | 2652016 | 2022-04-29 | 2023-08-20 |
| Phoenix | 96 | 95 | 4 | 2631 | 160.4 | 96.5% | 1985705 | 2149005 | 2023-06-15 | 2023-09-17 |
| Riverside-San Bernardino | 96 | 96 | 10 | 1699 | 97.2 | 91.0% | 1580448 | 1643386 | 2022-04-15 | 2022-05-31 |
| Sacramento | 96 | 95 | 3 | 1500 | 83.6 | 93.5% | 933562 | 973650 | 2022-05-20 | 2022-08-13 |
| San Antonio | 96 | 93 | 28 | 283 | 18.8 | 80.4% | 1015678 | 1096723 | 2022-05-14 | 2022-06-08 |
| San Diego | 96 | 95 | 9 | 899 | 50.0 | 90.0% | 1228505 | 1271828 | 2022-04-18 | 2022-05-30 |
| Seattle | 96 | 95 | 22 | 672 | 36.0 | 88.0% | 1650246 | 1752673 | 2023-08-02 | 2023-10-07 |
| Tampa | 96 | 95 | 5 | 1392 | 104.9 | 84.0% | 1465158 | 1563786 | 2023-01-06 | 2023-02-07 |
| Tucson | 96 | 91 | 10 | 899 | 92.2 | 88.5% | 470132 | 490150 | 2023-09-03 | 2023-10-18 |
| Washington DC | 96 | 96 | 45 | 455 | 15.0 | 84.7% | 2458414 | 2550314 | 2022-07-22 | 2023-11-13 |
Source: PC&S satellite census; Census TIGERweb; ACS 2024 (B25001); Planetary Computer NAIP. Download CSV
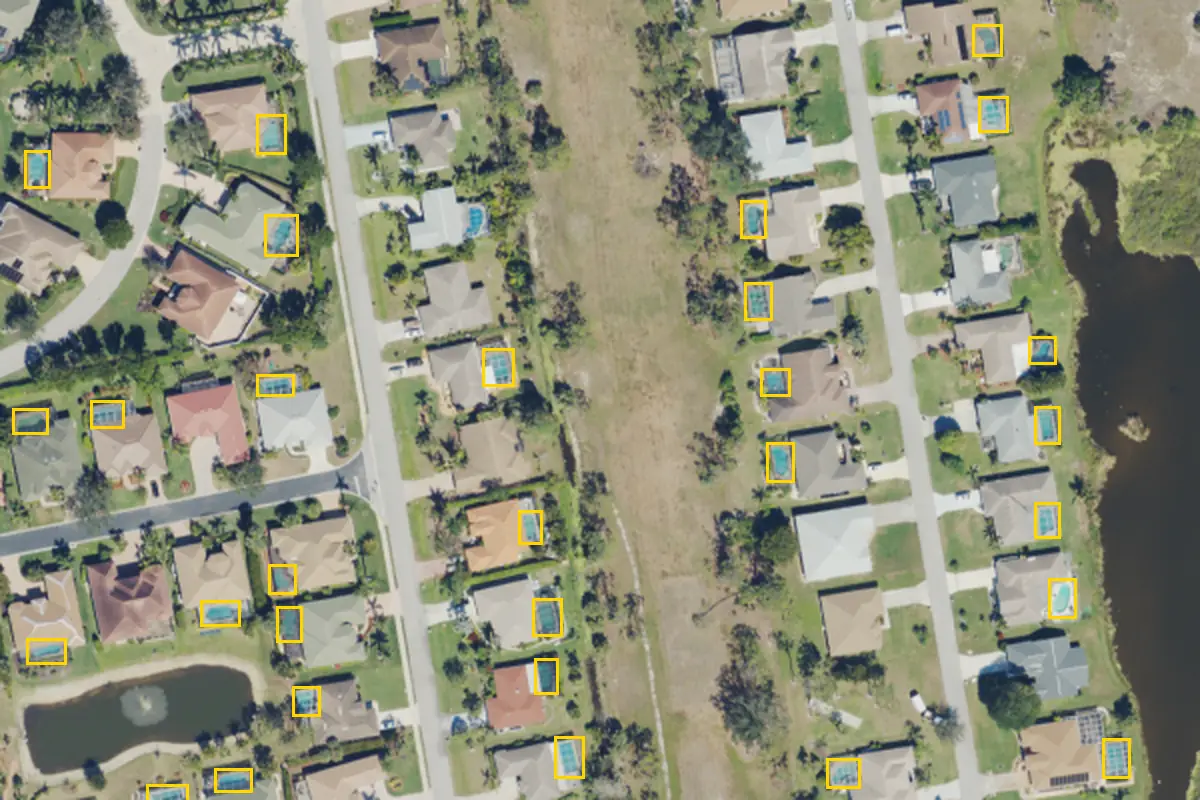
The full list of 2,400 draws is in the downloads at 500 m grid level, with each cell’s 2020 housing units, detected pools and image date. It contains no addresses, parcel numbers or pool locations.
How the satellite pool detector works
The detector is a published set of colour, water-index and shape rules applied to 4-band NAIP pixels at 0.6 m. Its parameters were set on 12 cells and frozen before any validation.
NAIP has been flown at 0.6 m ground resolution since 2018, during the agricultural growing season (USGS EROS (NAIP)). States flown at 0.3 m in 2023 were averaged to 0.6 m so every metro is measured the same way.
A pixel counts as pool water when its normalized difference water index is at least 0.15, both green and blue exceed red by at least 15 brightness steps, its hue falls between 145 and 200 degrees, and its mean brightness is at least 80. The water index follows McFeeters (1996).
| Parameter | Value | Purpose |
|---|---|---|
| Imagery | USDA NAIP, 4 bands (red, green, blue, near-infrared), 8-bit | Public domain aerial imagery |
| Working resolution | 0.6 m per pixel | 0.3 m (2023) states averaged to 0.6 m so all metros are comparable |
| Sample cell | 500 m x 500 m, EPSG:5070 grid | Unit of sampling and counting |
| NDWI minimum | 0.15 | (G minus NIR) / (G plus NIR); water absorbs near-infrared |
| Cyan minimum | 15 DN | min(G, B) minus R; pool water is cyan, roofs and shadows are not |
| Hue band | 145 to 200 degrees | Cyan to blue; above 200 was shadow and blue-grey roof in tuning |
| Brightness minimum | 80 DN | Mean of R, G, B; drops dark ponds, canals and shade |
| Pool size | 10 to 200 m2 | Backyard scale; excludes spas and most community pools |
| Solidity minimum | 0.7 | Blob area / convex hull area; drops ragged water edges |
| Elongation maximum | 5.0 | Major / minor axis; drops canals and strips |
| Connectivity | 8-connected pixels | Pixels grouped into one candidate pool |
Source: PC&S satellite census; band definitions from Planetary Computer NAIP. Download CSV
Validation: how often the satellite detector is right
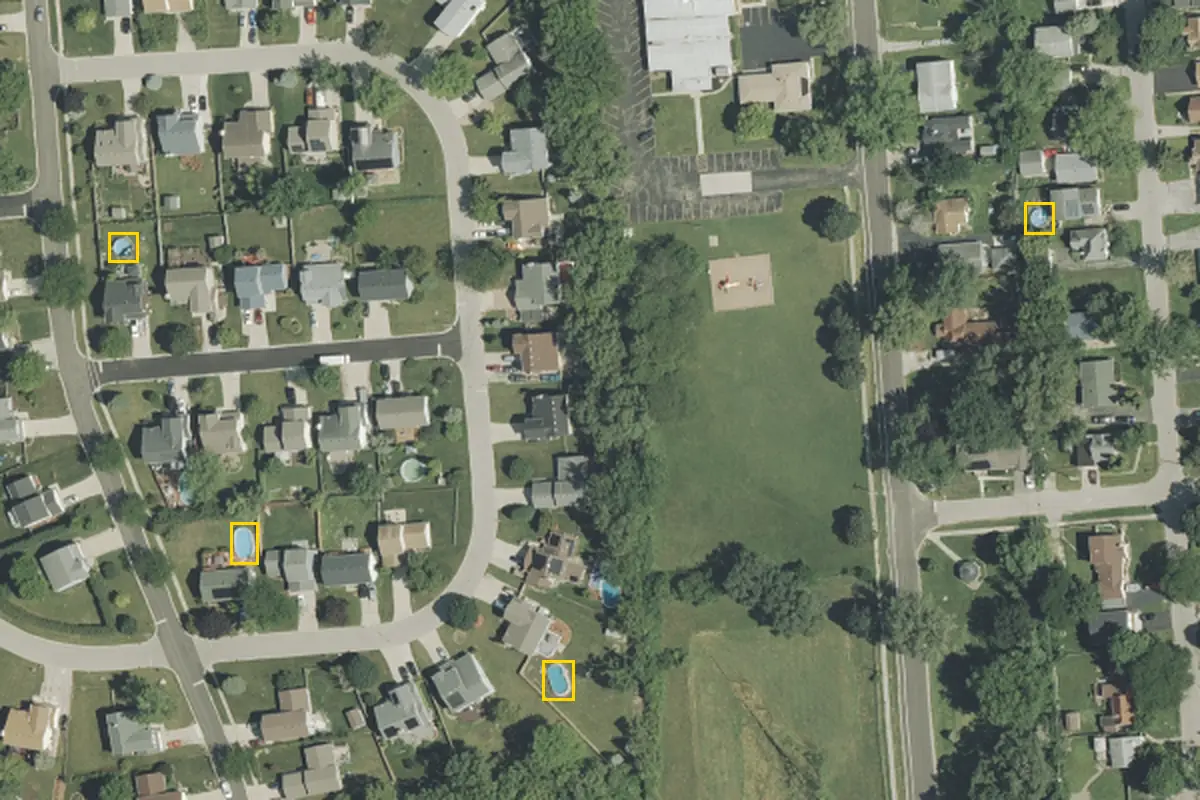
Hand checks of 496 random detections and 25 fully audited cells show the detector is precise in Sun Belt imagery and finds most, but not all, visible pools. Late-season imagery broke it in 3 metros.
Across the 22 measurable metros, 89% of 436 randomly chosen detections were real pools when viewed by eye (PC&S satellite census).
In 25 fully audited cells, one per metro, the detector found 72% of the visible pools (95% CI 67% to 77%), with 51 clear misses and 60 probable misses (PC&S satellite census).
Recall was 84% in Florida, where many audited pools sat under screen enclosures, 69% in the Desert Southwest and 67% in California (PC&S satellite census).
| Metro | Imagery month | Detections labelled | Pool | Not pool | Unsure | Precision | Precision 95% CI | Audit cell: boxes | Audit: true pools | Audit: false boxes | Audit: missed pools | Audit: probable misses |
|---|---|---|---|---|---|---|---|---|---|---|---|---|
| Atlanta | Oct 2023 | 20 | 1 | 18 | 1 | 8% | 1 to 25% | 19 | 3 | 14 | 1 | 2 |
| Austin | Jun 2022 | 20 | 17 | 1 | 2 | 90% | 72 to 98% | 0 | 0 | 0 | 0 | 0 |
| Cape Coral-Fort Myers | Jan 2023 | 20 | 18 | 1 | 1 | 93% | 75 to 99% | 19 | 19 | 0 | 2 | 0 |
| Chicago | Jul 2023 | 20 | 13 | 7 | 0 | 65% | 43 to 83% | 28 | 2 | 26 | 0 | 1 |
| Dallas-Fort Worth | Jul 2022 | 20 | 19 | 0 | 1 | 98% | 83 to 100% | 2 | 2 | 0 | 0 | 0 |
| Denver | Sep 2023 | 16 | 11 | 4 | 1 | 72% | 48 to 89% | 0 | 0 | 0 | 0 | 0 |
| Fresno | Jun 2022 | 20 | 18 | 0 | 2 | 95% | 79 to 99% | 7 | 7 | 0 | 2 | 9 |
| Houston | Sep 2022 | 20 | 18 | 0 | 2 | 95% | 79 to 99% | 5 | 4 | 0 | 0 | 2 |
| Jacksonville | Jan 2023 | 20 | 15 | 3 | 2 | 80% | 59 to 93% | 2 | 2 | 0 | 0 | 1 |
| Las Vegas | Jun 2022 | 20 | 20 | 0 | 0 | 100% | 88 to 100% | 11 | 11 | 0 | 8 | 8 |
| Los Angeles | May 2022 | 20 | 17 | 2 | 1 | 88% | 68 to 97% | 3 | 2 | 1 | 0 | 1 |
| Miami | Jan 2023 | 20 | 17 | 2 | 1 | 88% | 68 to 97% | 10 | 3 | 7 | 0 | 0 |
| New York | Aug 2023 | 20 | 17 | 2 | 1 | 88% | 68 to 97% | 1 | 1 | 0 | 1 | 3 |
| North Port-Sarasota | Jan 2023 | 20 | 17 | 1 | 2 | 90% | 72 to 98% | 20 | 19 | 0 | 4 | 3 |
| Orlando | Jan 2023 | 20 | 15 | 3 | 2 | 80% | 59 to 93% | 7 | 7 | 0 | 1 | 1 |
| Philadelphia | Jul 2023 | 20 | 20 | 0 | 0 | 100% | 88 to 100% | 0 | 0 | 0 | 0 | 0 |
| Phoenix | Sep 2023 | 20 | 20 | 0 | 0 | 100% | 88 to 100% | 63 | 63 | 0 | 19 | 8 |
| Riverside-San Bernardino | May 2022 | 20 | 17 | 2 | 1 | 88% | 68 to 97% | 15 | 15 | 0 | 2 | 1 |
| Sacramento | Jun 2022 | 20 | 17 | 0 | 3 | 93% | 75 to 99% | 11 | 9 | 1 | 0 | 5 |
| San Antonio | Jun 2022 | 20 | 19 | 0 | 1 | 98% | 83 to 100% | 3 | 2 | 0 | 1 | 1 |
| San Diego | Apr 2022 | 20 | 17 | 2 | 1 | 88% | 68 to 97% | 16 | 16 | 0 | 9 | 6 |
| Seattle | Oct 2023 | 20 | 6 | 12 | 2 | 35% | 17 to 57% | 7 | 1 | 4 | 0 | 2 |
| Tampa | Jan 2023 | 20 | 14 | 2 | 4 | 80% | 59 to 93% | 4 | 4 | 0 | 0 | 1 |
| Tucson | Oct 2023 | 20 | 20 | 0 | 0 | 100% | 88 to 100% | 11 | 11 | 0 | 1 | 3 |
| Washington DC | Oct 2023 | 20 | 0 | 19 | 1 | 3% | 0 to 17% | 3 | 1 | 2 | 0 | 2 |
Source: PC&S satellite census; label files raw/validation/precision_labels.csv and recall_labels.csv. Download CSV
Source: PC&S hand validation of NAIP detections. Download chart data (CSV)
| Imagery region | Audited cells | Boxes | True pools boxed | False boxes | Boxes not judgeable | Missed pools | Probable misses | Recall | Recall 95% CI | Recall range (probables as misses / as non-pools) |
|---|---|---|---|---|---|---|---|---|---|---|
| California | 5 | 52 | 49 | 2 | 1 | 13 | 22 | 67% | 56 to 77% | 59 to 79% |
| Desert Southwest | 3 | 85 | 85 | 0 | 0 | 28 | 19 | 69% | 61 to 77% | 64 to 75% |
| Florida | 6 | 62 | 54 | 7 | 1 | 7 | 6 | 84% | 74 to 92% | 81 to 89% |
| North and East | 7 | 58 | 8 | 46 | 4 | 2 | 10 | 59% | 36 to 79% | 45 to 83% |
| Texas | 4 | 10 | 8 | 0 | 2 | 1 | 3 | 78% | 50 to 94% | 69 to 90% |
| All audited cells | 25 | 267 | 204 | 55 | 8 | 51 | 60 | 72% | 67 to 77% | 65 to 80% |
Source: PC&S satellite census. Download CSV
Ground truth: satellite pool count vs the Lee County assessor roll
Lee County, Florida, which is the whole Cape Coral-Fort Myers metro, publishes a pool flag for every parcel. The comparison shows the detector tracks real pools closely at cell level, while the sample design misses some pools, leaving the satellite total 23% below the roll.
- 111,827 of 282,476 single-family parcels in Lee County (39.6%) carry a pool flag (Lee County Parcels layer; codes from Florida DOR codes).
- 114,479 non-condominium parcels carry a pool flag, and 109,499 of them have buildings completed by 2022 (Lee County Parcels layer).
- 68,579 condominium units also carry the flag, because it records the shared complex pool, so condominiums were left out of the comparison (Lee County Parcels layer).
- In the 93 sampled cells the detector found 2,318 pools against 2,765 pool parcels, a ratio of 0.84 with a correlation of 0.96; after precision and recall corrections the cell count is 8% below the roll (PC&S satellite census).
- 81% of the pool parcels built by 2022 (88,501) lie in 500 m cells the sample can reach; the rest sit in parts of large census blocks (PC&S satellite census).
- The sample’s own estimate of assessor pools in reachable cells is 78,900 (95% CI 58,200 to 102,300), consistent with the 88,501 counted (PC&S satellite census).
- The final satellite estimate for the metro is 84,300 backyard pools (95% CI 58,600 to 113,100), 23% below the 109,499 pool parcels built by 2022 (PC&S satellite census).
Source: Lee County Parcels layer (Lee County Property Appraiser attributes), accessed 2026-10-14; PC&S calculation. Download chart data (CSV)
Satellite pool count vs the 2015 American Housing Survey
The two sources rank the same 10 metros in almost the same order, but satellite levels are a median 4.8 points lower. Most of the gap is definitional, so any change since 2015 is indicative only.
The American Housing Survey counts ‘a swimming pool anywhere on the grounds’, which includes shared complex pools (2015 AHS Definitions). The satellite census counts pool surfaces of 10 to 200 m2 visible from the air.
In Phoenix, 36.8% of houses had a pool in 2015 (Census/HUD AHS 2015), against 31.5 pools per 100 houses in the 2023 satellite count (PC&S satellite census).
In Miami, 33.3% of houses had a pool in 2015 (Census/HUD AHS 2015), against 28.8 pools per 100 houses in 2023 imagery (PC&S satellite census).
| Metro | AHS 2015: houses with a pool (%) | AHS 2015 90% MOE (pts) | Satellite 2022 to 2023: pools per 100 houses | Difference (pts, indicative) | Satellite status |
|---|---|---|---|---|---|
| Phoenix | 36.8 | 3.4 | 31.5 | -5.3 | Ranked |
| Miami | 33.3 | 2.7 | 28.8 | -4.5 | Ranked |
| Riverside-San Bernardino | 22.1 | 2.2 | 17.0 | -5.1 | Ranked |
| Los Angeles | 20.1 | 2.7 | 12.4 | -7.7 | Ranked |
| Houston | 17.5 | 2.2 | 8.1 | -9.4 | Ranked |
| Dallas-Fort Worth | 15.3 | 2.1 | 12.2 | -3.1 | Ranked |
| Atlanta | 14.2 | 1.8 | 1.3 | -12.9 | Not estimable |
| New York | 14.2 | 2.5 | 11.1 | -3.1 | Ranked |
| Washington DC | 12.4 | 2.0 | 0.1 | -12.3 | Not estimable |
| Philadelphia | 11.0 | 1.6 | 7.2 | -3.8 | Ranked |
| Chicago | 7.2 | 1.7 | 6.0 | -1.2 | Ranked, lower confidence |
| Denver | 7.1 | 1.5 | 0.2 | -6.9 | Ranked, lower confidence |
| Seattle | 5.2 | 1.3 | 3.9 | -1.3 | Not estimable |
Source: Census/HUD AHS 2015 PUF, PC&S tabulation; PC&S satellite census; ACS 2024 (B25024) for the share of houses. Download CSV
Definitions differ: AHS counts any pool on the grounds, including shared pools.
Source: Census/HUD AHS 2015 PUF (PC&S tabulation); PC&S satellite pool census. Download chart data (CSV)
Which state has the most backyard pools
This census measures metros, not states. EIA’s 2024 household energy survey puts Florida first by both number and share of houses with their own pool.
Florida had 1.82 million houses with their own pool in 2024, 27.5% of houses (EIA RECS 2024 microdata, PC&S tabulation).
California had 1.34 million (14.3%) and Texas 0.92 million (10.9%) in 2024 (EIA RECS 2024 microdata).
Arizona ranks second by share at 23.7% of houses in 2024 (point estimate) (EIA RECS 2024 microdata). Nationally, 9.6 million homes had a swimming pool in 2024 (EIA RECS 2024, Table HC2.1).
The state picture in numbers
- Phoenix, AZ: 239 pools per 1,000 housing units (95% CI 168 to 320), NAIP imagery from 2023 (PC&S satellite census).
- Cape Coral-Fort Myers, FL: 202 pools per 1,000 housing units (95% CI 141 to 272), NAIP 2023 (PC&S satellite census).
- North Port-Sarasota, FL: 183 pools per 1,000 housing units (95% CI 122 to 251), NAIP 2023 (PC&S satellite census).
- Miami-Fort Lauderdale-West Palm Beach, FL: 154 pools per 1,000 housing units (95% CI 104 to 206), NAIP 2022 and 2023 (PC&S satellite census).
- Tucson, AZ: 150 pools per 1,000 housing units (95% CI 88 to 221), NAIP 2023 (PC&S satellite census).
- Fresno, CA: 146 pools per 1,000 housing units (95% CI 105 to 188), NAIP 2022 (PC&S satellite census).
- Las Vegas, NV: 99 pools per 1,000 housing units (95% CI 59 to 146), NAIP 2022 (PC&S satellite census).
- Los Angeles, CA: 71 pools per 1,000 housing units (95% CI 44 to 102), and an estimated 336,000 backyard pools (95% CI 209,200 to 481,300), NAIP 2022 (PC&S satellite census).
- Houston, TX: 57 pools per 1,000 housing units (95% CI 37 to 93), NAIP 2022 (PC&S satellite census).
- New York, NY-NJ: 47 pools per 1,000 housing units (95% CI 26 to 84), and an estimated 370,000 backyard pools (95% CI 207,200 to 667,600), NAIP 2022 and 2023 (PC&S satellite census).
- San Antonio, TX has the lowest rate of the ranked Sun Belt metros at 29 pools per 1,000 housing units (95% CI 18 to 50), NAIP 2022 (PC&S satellite census).
- Denver, CO shows 2 pools per 1,000 housing units (95% CI 1 to 3) in late-September 2023 imagery, a figure we treat with lower confidence (PC&S satellite census).
- In 93 sampled Lee County, FL cells the detector found 2,318 pools where the assessor roll lists 2,765 non-condominium pool parcels, a ratio of 0.84 with a cell-level correlation of 0.96 (Lee County Parcels layer).
- Across 10 metros the satellite ranking matches the 2015 American Housing Survey ranking with a Spearman correlation of 0.96, while satellite levels are a median 4.8 points lower (Census/HUD AHS 2015).
State rankings and comparisons we derived
Metro ranking of backyard pools per 1,000 housing units
Which metros have the most backyard pools per home?
rate = mean over draws(detected pools in cell / 2020 housing units in cell) x precision / recall / coverage x 1,000Inputs: Cell draws and detections (raw/estimates/cell_level.csv), precision by metro, recall by region, coverage by metro; derived rows rate_*, lo_*, hi_*
Limitations: Hansen-Hurwitz estimate from 96 draws per metro; intervals from 5,000 bootstrap replicates that also draw precision and recall from their posteriors. Neighbouring ranks overlap.
Estimated total backyard pools per metro
How many backyard pools does each metro have?
total = rate x metro 2020 Census housing units (sum of block HU100)Inputs: derived rows tot_*, facts hu20_*
Limitations: Misses pools on blocks that had no housing units in 2020 and pools covered or hidden at flight time; Lee County check suggests totals are low.
Detector precision and recall from hand validation
How accurate is the satellite pool count?
precision = (pools + 0.5 x unsure) / labelled; recall = true boxes / (true boxes + misses + 0.5 x probable misses)Inputs: raw/validation/precision_labels.csv, raw/validation/recall_labels.csv; derived rows prec_*, rec_*
Limitations: One labeller; 0.6 m pixels make small or screened pools ambiguous; recall pooled by region because each metro has one audit cell.
Satellite estimate vs AHS 2015 share
Do the satellite results agree with the last metro-level survey?
pools per 100 houses = rate / ACS 2024 single-family and mobile-home share / 10; compared with AHS 2015 % of houses with a poolInputs: derived rows ph_*, ahsdiff_*, ahs_rho; facts ahs_sf_*
Limitations: Different definitions (AHS counts shared pools on the grounds), 2013 vs 2023 metro boundaries and imagery season; change since 2015 is indicative only.
Sample frame coverage and the Lee County check
How much does the sample design miss?
coverage = mean share of each drawn block's area inside cells holding a block internal point; checked against assessor pool parcelsInputs: raw/estimates/coverage_draws.csv; derived rows cov_*, lee_*
Limitations: Assumes homes are spread evenly within each census block; only one county has a public pool flag in this sample.
Questions searchers ask
Which city has the most swimming pools?
Of 22 measurable metros, Phoenix has both the most backyard pools per home, 239 per 1,000 housing units, and the largest estimated total, 475,500 backyard pools (95% CI 332,800 to 636,400), in 2023 imagery (PC&S satellite census). Intervals for Miami, New York and Los Angeles overlap with Phoenix on totals.
How many pools are in Phoenix?
The Phoenix metro has an estimated 475,500 backyard pools (95% CI 332,800 to 636,400) in 2023 aerial imagery (PC&S satellite census). In 2015 the American Housing Survey counted 731,000 occupied homes with a pool on the property, including shared pools, of which about 493,400 were houses (Census/HUD AHS 2015).
What percentage of homes in Las Vegas have pools?
The Las Vegas metro had 99 backyard pools per 1,000 housing units in 2022 imagery, or about 14.4 pools per 100 houses (PC&S satellite census). Statewide, 16.1% of Nevada houses had their own pool in 2024 (EIA RECS 2024 microdata).
Which state has the most backyard pools?
Florida: 1.82 million houses, 27.5%, had their own pool in 2024, ahead of California at 1.34 million (EIA RECS 2024 microdata, PC&S tabulation).
How can you count pools from satellite images?
We drew 2,400 random 500 m cells in 25 metros, read the USDA NAIP aerial imagery at 0.6 m, flagged cyan water pixels with a water index and colour rules, kept compact patches of 10 to 200 m2, then hand-checked 496 detections and 25 whole cells to correct for errors (PC&S satellite census).
Latest releases used
- First edition: 2,400 sampled 500 m cells across 25 metros, hand-validated, with an assessor cross-check in Lee County, FL.
- The 2025 ACS 1-year release is scheduled for October 29, 2026; this edition uses ACS 2024 1-year housing counts (Census release schedule).
- Latest NAIP year in the Planetary Computer collection is 2023 (Planetary Computer NAIP); USDA 2024 and 2025 flights for some states were not reachable for this edition.
Frequently asked questions
What counts as a backyard pool in this census?
Any connected patch of pool-coloured water of 10 to 200 m2 with a compact shape in 2022 to 2023 NAIP imagery, including above-ground and screened pools (PC&S satellite census).
How accurate is the satellite pool count?
In the 22 measurable metros 89% of hand-checked detections were real pools, and the detector found 72% of visible pools in 25 audited cells; estimates are corrected for both (PC&S satellite census).
Why are Atlanta, Washington DC and Seattle not ranked?
Their imagery was flown in October 2023, and detector precision fell to 8%, 3% and 35% as roofs, shadows and lake water passed the colour rules (PC&S satellite census).
Which Florida metro has the most pools per home?
Cape Coral-Fort Myers, with 202 pools per 1,000 housing units (95% CI 141 to 272) in January 2023 imagery (PC&S satellite census).
Do screen enclosures hide Florida pools from aerial imagery?
Mostly not: the detector found 84% of visible pools in audited Florida cells, and 0.84 detections per assessor pool parcel in Lee County (Lee County Parcels layer).
How does the satellite count compare with the American Housing Survey?
The rankings agree (Spearman 0.96 across 10 metros), but satellite levels are a median 4.8 points below the AHS 2015 share of houses with a pool (Census/HUD AHS 2015).
How old is the imagery?
2022 or 2023 depending on the state, the latest NAIP year in the Planetary Computer collection, which ends in 2023 (Planetary Computer NAIP). NAIP is flown at least every 3 years (USGS EROS (NAIP)).
Are apartment and community pools included?
Shared pools of 10 to 200 m2 are counted; larger community pools are not. In Lee County, 68,579 condominium units carry a pool flag for shared pools (Lee County Parcels layer).
How many backyard pools are in Los Angeles?
The Los Angeles metro has an estimated 336,000 backyard pools (95% CI 209,200 to 481,300) in 2022 imagery, or 71 per 1,000 housing units (PC&S satellite census).
Why are the confidence intervals so wide?
Each metro rests on 96 sampled cells, and pool counts swing sharply between neighbourhoods; precision and recall add their own uncertainty, which the intervals include (PC&S satellite census).
Cite and reuse
Numbers to quote
- Phoenix had 239 backyard pools per 1,000 housing units in 2023 aerial imagery, the most of 22 measurable US metros. (U.S. Geological Survey)
- An estimated 475,500 backyard pools were visible across the Phoenix metro in 2023 NAIP imagery. (Microsoft Planetary Computer (USDA FSA data))
- Cape Coral-Fort Myers, FL had 202 backyard pools per 1,000 housing units in January 2023, second among 22 US metros. (Microsoft Planetary Computer (USDA FSA data))
- In Lee County, FL, 39.6% of single-family parcels carried an assessor pool flag in October 2026. (Lee County Property Appraiser / Lee County GIS)
- Florida had 1.82 million houses with their own pool in 2024, 27.5% of the state’s houses. (U.S. Energy Information Administration)
- Satellite pool counts for 10 US metros rank in nearly the same order as the 2015 American Housing Survey (Spearman 0.96). (U.S. Census Bureau and HUD)
Start with these sources
- USGS EROS Archive: National Agriculture Imagery Program (NAIP), U.S. Geological Survey
- TIGERweb 2020 Census Blocks (HU100), U.S. Census Bureau
- AHS 2015 Public Use File, U.S. Census Bureau and HUD
- RECS 2024 public microdata v1, U.S. Energy Information Administration
- Lee County Parcels feature layer, Lee County Property Appraiser / Lee County GIS
Newsroom summary
Pool Construction & Service counted backyard pools directly from USDA aerial imagery in 25 US metros. Using 2,400 randomly drawn 500 m neighborhoods and a published detection rule, the census finds Phoenix has 239 backyard pools per 1,000 housing units in 2023, the highest of 22 measurable metros, followed by Cape Coral-Fort Myers (202), North Port-Sarasota (183), Miami (154) and Tucson (150). The Phoenix metro holds an estimated 475,500 pools. Hand checks show 89% of detections are real pools and the detector finds 72% of visible pools; estimates are corrected for both. A comparison with the Lee County, Florida assessor roll puts the satellite total 23% low, so figures are conservative. Atlanta, Washington DC and Seattle could not be measured because their imagery was flown in October. Rankings agree closely with the 2015 American Housing Survey (Spearman 0.96).
Headline options
- Phoenix Leads US Metros With 239 Backyard Pools per 1,000 Homes, Satellite Census Finds
- Aerial Imagery Counts About 475,500 Backyard Pools in Metro Phoenix
- Southwest Florida Rivals Phoenix in Backyard Pools per Home
- Satellite Pool Census Confirms the Sun Belt Ranking of the 2015 Housing Survey
- Autumn Aerial Photos Hide Pools: Why Atlanta, Washington and Seattle Could Not Be Counted
Suggested citation
Pool Construction & Service. "Cities With the Most Pools: A 2022 to 2023 Satellite Census of 25 US Metros." PC&S Research Desk, October 14, 2026. https://poolconstructionandservice.com/research/cities-with-the-most-pools/
Reuse terms
The data tables and charts in this report are licensed under CC BY 4.0. Reuse them with this attribution: “Source: Pool Construction & Service (poolconstructionandservice.com), Cities With the Most Pools: A 2022 to 2023 Satellite Census of 25 US Metros.” Figures from third-party sources remain subject to their publishers’ terms.
State data files
- Backyard pools per 1,000 housing units and totals by metro, 2022 to 2023 CSV
- Sample design and raw detections by metro CSV
- All 2,400 sampled 500 m cells with housing units and detected pools CSV
- Pool detector parameters CSV
- Hand validation results by metro CSV
- Detector recall by imagery region CSV
- AHS 2015 vs satellite pools per 100 houses, 13 metros CSV
- Full fact sheet with sources and limitations CSV
How we measured it
- Metro frame: 25 metros by 2023 OMB CBSA definitions (Census delineation file, July 2023); every 2020 Census block with housing units in their counties from Census TIGERweb.
- Sample: two independent waves of 48 draws per metro (2,400 in all). Each draw selects a housing unit with equal probability and takes the 500 m EPSG:5070 grid cell holding its block’s internal point, so a cell’s selection probability equals its share of the metro’s 2020 housing units.
- Imagery: for each of 2,366 unique cells, the latest NAIP item in Planetary Computer NAIP was read as a windowed cloud-optimized GeoTIFF read and resampled to 0.6 m (2022 for CA, NV and TX; 2023 for AZ, CO, FL, GA, IL, WA; mixed years in multi-state metros).
- Detection: a rule-based detector (table above) flagged pool-water pixels and kept compact patches of 10 to 200 m2. Parameters were set on 12 cells and frozen before validation.
- Precision: 20 detections per metro were drawn at random from wave 1 (16 in Denver, all it had) and labelled pool, not pool or unsure from crops enlarged three-fold.
- Recall: one random wave 1 cell per metro, excluding tuning cells, was split into four quadrants enlarged two-fold with numbered boxes; every box and every unboxed pool was counted. Recall was pooled into 5 imagery regions.
- Coverage: for each draw, the drawn block’s polygon was fetched from TIGERweb and the share of its area inside cells that hold any block internal point was computed; the mean is the metro’s frame coverage.
- Estimation: Hansen-Hurwitz mean of pools per housing unit, multiplied by precision, divided by recall and coverage; 5,000 bootstrap replicates resample draws and draw precision and recall from Jeffreys Beta posteriors.
- Ground truth: Lee County parcel pool flags (Lee County Parcels layer) were aggregated to 500 m cells and compared with detections and with the county total.
Included: Residential-scale pool surfaces of 10 to 200 m2 visible in NAIP imagery; metros chosen to cover the Sun Belt pool markets plus the large northern metros sampled by AHS 2015.
Excluded: Pools under 10 m2 (most spas), community pools over 200 m2, covered pools and pools fully under tree canopy. Metros with detector precision below 50% are reported but not ranked (3 metros).
Conflicting numbers: Where satellite and survey figures differ (AHS 2015, EIA RECS 2024, a 2021 LendingTree poll), the report shows each with its definition and date rather than choosing one. The Lee County assessor roll was used to test, not to adjust, the estimates.
Derived metrics: All calculations are in scripts/ (01 to 13) and reproduce end to end from public sources; every derived figure has a row in derived.csv with its formula.
Caveats
- Imagery season matters: October and November 2023 flights in Atlanta, Washington DC and Seattle, and a late-September flight in Denver, show fewer open pools and more false detections.
- Recall comes from 25 audited cells, one per metro, pooled by region; metro-specific recall may differ.
- One person labelled all validation crops at 0.6 m; small, screened or dark pools are ambiguous, and unsure cases were split half and half (bounds are in the recall table).
- Housing units are 2020 Census counts; homes built since 2020 on previously empty blocks are outside the frame, which matters most in fast-growing metros.
- The Lee County check found the satellite total 23% below the assessor roll, so totals are more likely too low than too high.
- NAIP 2024 and 2025 imagery exists for some states but was not reachable through the public service used; the next edition should use it.
Method last reviewed October 14, 2026.
Source weighting
Tier 1: primary and government sources (15)
- U.S. Geological Survey: USGS EROS Archive: National Agriculture Imagery Program (NAIP)
- Microsoft Planetary Computer (USDA FSA data): NAIP item search API (per-cell acquisition dates)
- U.S. Census Bureau: Metropolitan and micropolitan delineation files, July 2023
- U.S. Census Bureau: TIGERweb 2020 Census Blocks (HU100)
- U.S. Census Bureau: ACS 2024 1-year, table B25001 Housing Units
- U.S. Census Bureau: ACS 2024 1-year, table B25024 Units in Structure
- U.S. Census Bureau: 2025 ACS data release schedule
- U.S. Census Bureau and HUD: AHS 2015 Public Use File
- U.S. Census Bureau and HUD: 2015 AHS Definitions
- U.S. Energy Information Administration: RECS 2024 Table HC2.1
- U.S. Energy Information Administration: RECS 2024 public microdata v1
- Lee County Property Appraiser / Lee County GIS: Lee County Parcels feature layer
- Lee County Government GIS: Lee County Parcels item page
- Lee County Property Appraiser: Department of Revenue Property Classification Codes
- International Journal of Remote Sensing (McFeeters, 1996): The use of the Normalized Difference Water Index (NDWI) in the delineation of open water features
Tier 2: trade bodies, public companies, market research (2)
- Microsoft Planetary Computer (USDA FSA data): NAIP STAC collection and item search
- Statista: Cities with the most swimming pools per 100,000 residents in the U.S. 2024
Tier 3: journalism and expert commentary (3)
Works cited
- U.S. Geological Survey. USGS EROS Archive: National Agriculture Imagery Program (NAIP). Accessed 2026-10-14.
- Microsoft Planetary Computer (USDA FSA data). NAIP STAC collection and item search. Accessed 2026-10-14.
- Microsoft Planetary Computer (USDA FSA data). NAIP item search API (per-cell acquisition dates). Accessed 2026-10-14.
- U.S. Census Bureau. Metropolitan and micropolitan delineation files, July 2023. Accessed 2026-10-14.
- U.S. Census Bureau. TIGERweb 2020 Census Blocks (HU100). Accessed 2026-10-14.
- U.S. Census Bureau. ACS 2024 1-year, table B25001 Housing Units. Accessed 2026-10-14.
- U.S. Census Bureau. ACS 2024 1-year, table B25024 Units in Structure. Accessed 2026-10-14.
- U.S. Census Bureau. 2025 ACS data release schedule. Accessed 2026-10-14.
- U.S. Census Bureau and HUD. AHS 2015 Public Use File. Accessed 2026-10-14.
- U.S. Census Bureau and HUD. 2015 AHS Definitions. Accessed 2026-10-14.
- U.S. Energy Information Administration. RECS 2024 Table HC2.1. Accessed 2026-10-14.
- U.S. Energy Information Administration. RECS 2024 public microdata v1. Accessed 2026-10-14.
- Lee County Property Appraiser / Lee County GIS. Lee County Parcels feature layer. Accessed 2026-10-14.
- Lee County Government GIS. Lee County Parcels item page. Accessed 2026-10-14.
- Lee County Property Appraiser. Department of Revenue Property Classification Codes. Accessed 2026-10-14.
- International Journal of Remote Sensing (McFeeters, 1996). The use of the Normalized Difference Water Index (NDWI) in the delineation of open water features. Accessed 2026-10-14.
- Pool Magazine. U.S. Cities With The Most Residential Swimming Pools. Accessed 2026-10-14.
- AQUA Magazine. Which U.S. Cities Have the Most Homes With Swimming Pools?. Accessed 2026-10-14.
- Statista. Cities with the most swimming pools per 100,000 residents in the U.S. 2024. Accessed 2026-10-14.
- Poolguard USA. What State Has The Most Pools? (2026 Rankings). Accessed 2026-10-14.
Related pool research
Pool Construction Statistics: PC&S Pool Construction Index, September 2026
Number of Swimming Pools in the US: Published Estimates Reconciled
Pool Permit Processing Time: Days From Application to Issue in 12 US Cities, 2019 to 2026
Pool Removal Statistics: Permit Counts for US Cities, 2015 to 2026
Percentage of Homes With Pools by Metro and State: Backyard Pool Prevalence Index
How Many Homes Have a Hot Tub? US State Atlas of Hot Tub and Spa Ownership, 2024
All pool industry research (43 reports)