Number of Swimming Pools in the US: Published Estimates Reconciled
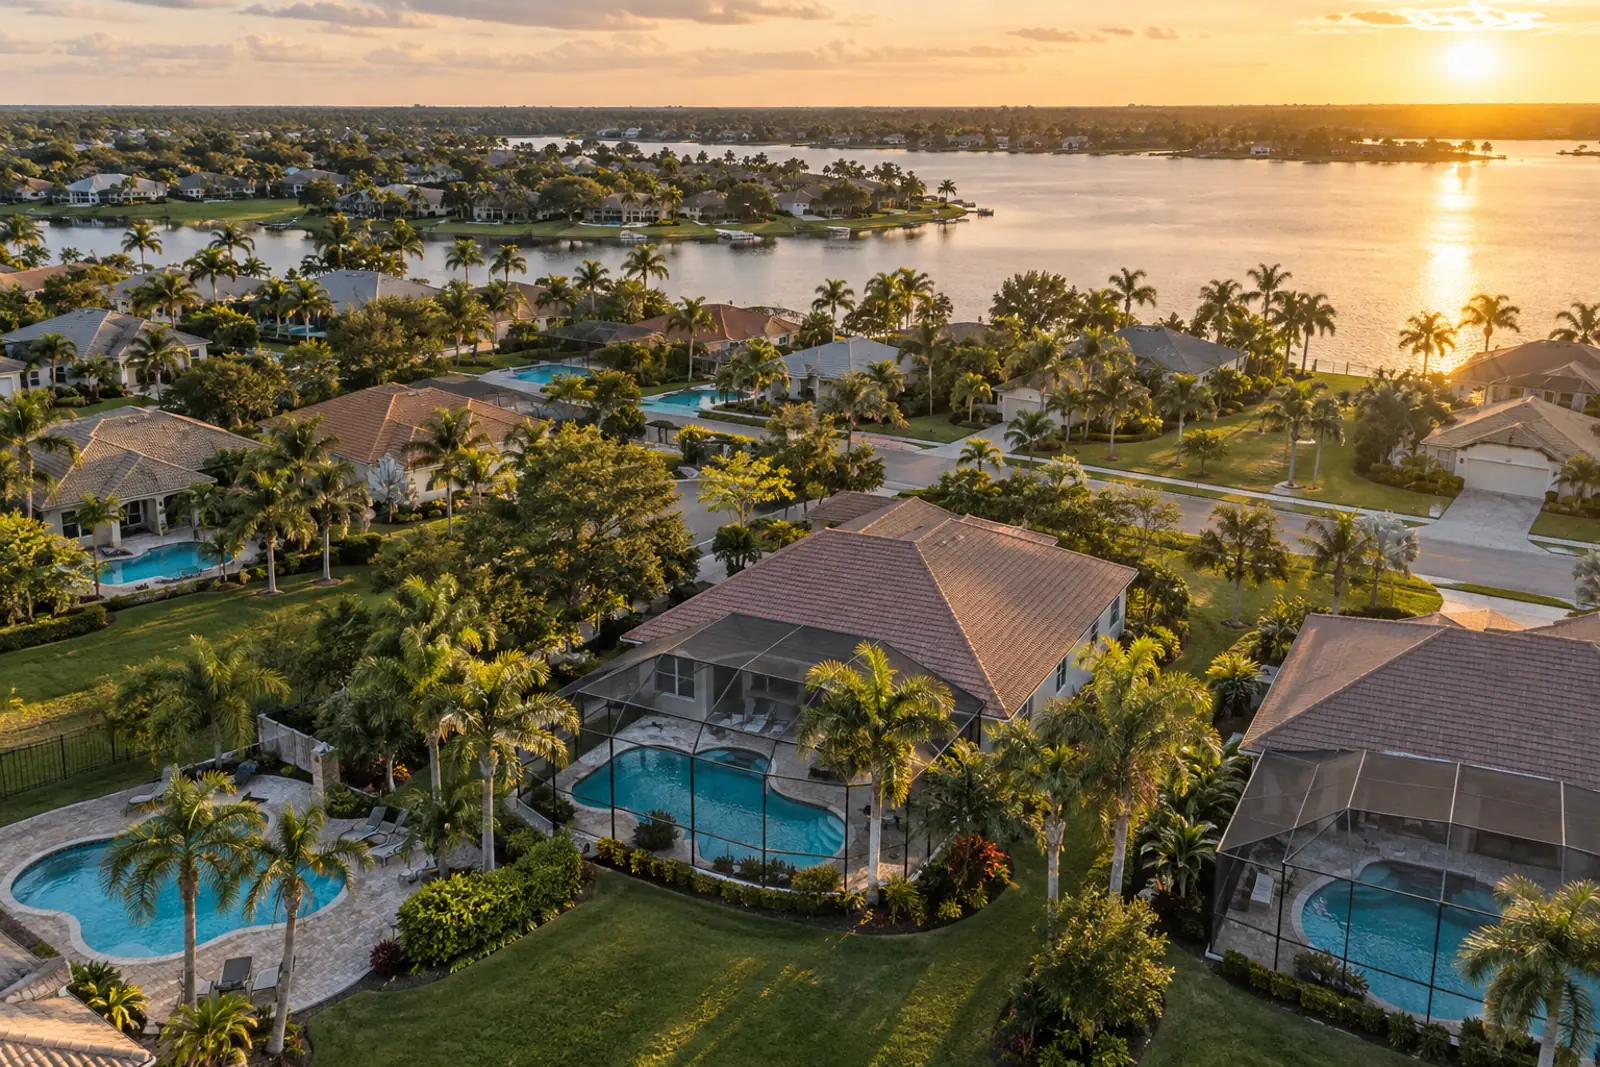
The number of swimming pools in the US is best stated as a range: 9.0 to 10.4 million residential pools plus about 300,000 to 309,000 public pools. EIA's 2024 survey counts 9.6 million US homes with their own pool, 7.2% of homes. About 5.5 million residential pools are in-ground (Pool Corporation, 2025).
Summary
- The US had 9.0 million residential pools in fiscal 2025, according to Leslie’s 10-K, FY2025.
- The widely cited 10.4 million residential pools figure comes from a 2011 industry sheet covering the contiguous 48 states and DC (APSP / P.K. Data, U.S. Swimming Pool and Hot Tub Market 2011).
- EIA’s survey counted 9.60 million US homes with their own pool in 2024, 7.2% of 132.54 million homes (EIA RECS 2024, Table HC2.1).
- Pool Corporation estimated about 5.5 million in-ground residential pools in the US in 2025 (Pool Corporation 10-K, FY2025).
- Public pools are estimated at 300,000 (2025, Leslie’s 10-K, FY2025) to 309,000 (2011 data, CDC MMWR 2016). PC&S found no national government count of US public pools.
- Florida had an estimated 1.82 million homes with a pool in 2024, the most of any state, based on a PC&S tabulation of EIA 2024 RECS microdata.
- Five states (Florida, California, Texas, New York and Arizona) held 54.2% of US homes with a pool in 2024 (PC&S tabulation of EIA 2024 RECS microdata).
- PC&S readings of Pool Corporation’s unlabelled in-ground charts show the 2021 bar lowered by about 0.05 million in the following year’s 10-K, and the 2023 bar by about 0.03 million (Pool Corporation 10-K, FY2025 and earlier filings; readings approx., ±0.01 million).
Where the 10.4 million and 309,000 pool figures come from
The most repeated US pool counts trace to one 2011 industry data sheet. CDC republished it in 2013, PHTA still uses it, and secondary sites add the residential and commercial figures to get 10.7 million.
CDC’s Healthy Swimming page, last updated 6 September 2013, said: ‘There are 10.4 million residential and 309,000 public swimming pools in the United States’ (CDC Healthy Swimming Fast Facts (2013, archived)). The footnote points to ‘The Association of Pool & Spa Professionals. U.S. Swimming Pool and Hot Tub Market 2011’.
The archived one-page APSP sheet, copyrighted by P.K. Data, Inc., lists a 2011 total base of 5,371,000 in-ground pools, 4,993,000 above-ground pools, 7,269,000 hot tubs and 309,000 commercial pools for the contiguous 48 states and DC (APSP / P.K. Data, U.S. Swimming Pool and Hot Tub Market 2011). The two residential bases sum to 10,364,000.
CDC’s 2016 MMWR surveillance summary describes the 309,000 figure as ‘an estimated 309,000 public aquatic venues throughout the United States in 2011’, citing P.K. Data (CDC MMWR 2016). A 2024 position statement hosted by CDC still uses it (CSTE via CDC).
PHTA, the successor to APSP, repeated ‘approximately 10.4 million residential pools’ in a September 2020 release (PHTA). The figure also appears, without a date, on PHTA’s National Water Safety Month page (PHTA).
| published_figure | what_it_counts | publisher | data_year | stated_basis | geography | status | fact_rows |
|---|---|---|---|---|---|---|---|
| 10.4 million residential pools | Residential in-ground + above-ground pools | APSP (now PHTA), data by P.K. Data | 2011 | P.K. Data market sheet; 5,371,000 in-ground + 4,993,000 above-ground | Contiguous 48 states + DC | Traced to origin; still repeated by CDC (2013 page) and PHTA (undated page, 2020 release) | 36; 37; 47; 53; 54; D13 |
| 10.7 million total pools | Residential pools + 309,000 commercial | Circulating sum (RubyHome, Marketplace, Pool Magazine) | 2011 | Arithmetic sum of the 2011 sheet's residential and commercial bases | Contiguous 48 states + DC | Traced: no publisher states 10.7 million as its own count; it is 10.364 + 0.309 million | 36; 37; 39; 90; 94; 95; D14 |
| 309,000 public pools | Public aquatic venues (pools, hot tubs, water play) | CDC MMWR, citing P.K. Data | 2011 | Aquatic sector marketing data | United States | Traced to origin; repeated in a 2024 CSTE statement hosted by CDC | 39; 49; 52 |
| 9.6 million homes with a pool | Occupied primary residences with their own pool | EIA, Residential Energy Consumption Survey | 2024 | Household survey, about 17,000 homes, weighted to ACS 2024 | 50 states + DC | Government survey; preliminary; counts homes not pools; excludes second homes and apartments | 59; 70; 71; D4 |
| 9.0 million residential pools | Residential pool market | Leslie's, Inc. 10-K | FY2025 | Industry analysts, market research firms, management estimates (unnamed) | United States | Company estimate; rose from 8.5 million in six filings | 18; 23; 28 |
| 8.8 million residential pools | Residential pool market | Leslie's, Inc. 10-K | FY2023 and FY2024 | As above | United States | Superseded by 9.0 million in FY2025 filing; still cited by PoolDial (2026) | 19; 20; 93 |
| 5.5 million in-ground pools | Residential in-ground pools | Pool Corporation 10-K | 2025 | Company estimates and 2024 P.K. Data reports | United States | Company estimate (text figure); its unlabelled chart reads about 5.46 million (PC&S chart reading) | 2; 5; 17 |
| 14.0 million pools and hot tubs | Pools and hot tubs combined | Pool Corporation 10-K | 2025 | Not itemised | United States | Company estimate; replaced '11.0 million bodies of water' in the prior filing | 1; 3; D40 |
| 5.5 million spas or hot tubs | Residential spas and hot tubs | Leslie's, Inc. 10-K | FY2025 | Unnamed third-party and management estimates | United States | Unchanged in six filings | 24 |
| 300,000 commercial pools | Pools run by professional operators (hotels, motels, apartments, water parks) | Leslie's, Inc. 10-K | FY2025 | Unnamed | United States | Company estimate; was 250,000 through FY2023 | 25; 26 |
| 19.7 million homes with a pool on the property | Occupied homes with an outdoor pool anywhere on the grounds, shared pools included | Census Bureau / HUD, American Housing Survey | 2015 | Household survey, half sample | United States | Government survey; broader definition; not repeated nationally since 2015 | 76; 77; 79 |
| 6.1 million in-ground / 4.3 million above-ground | Residential split | Attributed to PHTA by RubyHome and others | Unknown | None found | United States | Untraced: no PHTA document found; excluded from the range | 91; D44 |
| 25 million pools | Global pool installed base | Hayward Holdings 10-K | FY2021 to FY2025 | Company estimate, 'market studies' | World | Not a US figure; unchanged in five filings | 29; 31 |
| 20 million in-ground pools | Global in-ground residential base | Fluidra 2025 Integrated Annual Report | 2025 | Company estimate | World | Not a US figure | 34 |
Source: PC&S Research from APSP / P.K. Data, U.S. Swimming Pool and Hot Tub Market 2011, CDC Healthy Swimming Fast Facts (2013, archived), CDC MMWR 2016, EIA RECS 2024, Table HC2.1, Leslie’s 10-K, FY2025, Pool Corporation 10-K, FY2025, Census Bureau / HUD American Housing Survey 2015, Hayward 10-K, FY2025, Fluidra 2025 Integrated Annual Report. Download CSV
Number of swimming pools in the US: the range by category
Company filings and the 2011 industry base bracket residential pools at 9.0 to 10.4 million. EIA’s 2024 survey, a government measurement on a narrower definition, lands inside that range at 9.60 million homes.
Residential pools in the US number 9.0 to 10.4 million, with a midpoint of 9.7 million. The low end is Leslie’s FY2025 figure (Leslie’s 10-K, FY2025). The high end is the 2011 APSP/P.K. Data base (APSP / P.K. Data, U.S. Swimming Pool and Hot Tub Market 2011).
Residential in-ground pools number 5.4 to 5.5 million, based on Pool Corporation’s FY2024 and FY2025 filings (Pool Corporation 10-K, FY2024; Pool Corporation 10-K, FY2025).
Above-ground residential pools are implied at 3.5 to 5.0 million. That range is a residual (residential minus in-ground), not a count. The only direct above-ground count found is 4,993,000 for 2011.
Public and commercial pools number 300,000 to 309,000 (Leslie’s 10-K, FY2025; CDC MMWR 2016). All US pools together number 9.3 to 10.7 million, with a midpoint of 10.0 million.
Above-ground range is a residual (residential minus in-ground), not a measurement.
Source: PC&S Research from Leslie's and Pool Corp 10-Ks (FY2024, FY2025), APSP/P.K. Data 2011 via CDC, CDC MMWR 2016, EIA RECS 2024. Download chart data (CSV)
| category | low_million | high_million | midpoint_million | low_source | high_source | per_100_households_low | per_100_households_high | per_100_households_mid |
|---|---|---|---|---|---|---|---|---|
| Residential pools (all types) | 9.0 | 10.4 | 9.7 | Leslie's FY2025 10-K | APSP/P.K. Data 2011 via CDC and PHTA | 6.78 | 7.84 | 7.31 |
| Residential in-ground pools | 5.4 | 5.5 | 5.45 | Pool Corp FY2024 10-K | Pool Corp FY2025 10-K | 4.07 | 4.14 | 4.11 |
| Residential above-ground pools (implied residual) | 3.5 | 5.0 | 4.25 | 9.0 minus 5.5 | 10.4 minus 5.4 | 2.64 | 3.77 | 3.2 |
| Public and commercial pools | 0.3 | 0.309 | 0.3045 | Leslie's FY2025 10-K | CDC MMWR (P.K. Data 2011) | |||
| All pools (residential + public) | 9.3 | 10.71 | 10.01 | Sum of lows | Sum of highs | 7.01 | 8.07 | 7.54 |
| Benchmark: homes with their own pool (EIA RECS 2024) | 9.01 | 10.19 | 9.6 | 95% CI low | 95% CI high | 7.24 |
Source: PC&S Research calculation from Leslie’s 10-K, FY2025, Pool Corporation 10-K, FY2024, Pool Corporation 10-K, FY2025, APSP / P.K. Data, U.S. Swimming Pool and Hot Tub Market 2011, CDC MMWR 2016, EIA RECS 2024, Table HC2.1, Census Bureau ACS 2024, Table B11001. Download CSV
Against 132,737,146 US households in 2024 (Census Bureau ACS 2024, Table B11001), the residential range equals 6.78 to 7.84 pools per 100 households. The midpoint equals 7.31 pools per 100 households.
In-ground pools equal 4.07 to 4.14 per 100 US households. All pools, public included, equal 7.01 to 8.07 per 100 US households.
What Pool Corp, Leslie's, Hayward and Latham 10-K filings say, filing by filing
Two companies publish a US installed-base number every year, and both have moved it in small steps. The movements mix real growth with rounding, re-scoping and revisions, so no single filing should be read as a census.
Leslie’s counted 8.5 million US residential pools in its FY2020 10-K (Leslie’s 10-K, FY2020). The count was 8.6 million in FY2021, 8.7 million in FY2022 and 8.8 million in FY2023 and FY2024. It reached about 9.0 million in the FY2025 10-K (Leslie’s 10-K, FY2025).
The FY2021 to FY2025 increase of 0.4 million pools equals 4.7%, or 1.14% a year. Leslie’s says its market data rest on reports from industry analysts and market research firms, which it has not independently verified, and on management estimates.
Pool Corporation bases its chart of US in-ground pools on ‘Company estimates for 2025 and information from 2024 P.K. Data, Inc. reports’ (Pool Corporation 10-K, FY2025). The chart carries no data labels, so PC&S read the bars in each filing by pixel; values below are PC&S chart readings (approx., ±0.01 million), not numbers Pool Corporation states.
Pool Corporation does not print the values behind its chart. In the FY2021 10-K, the 2021 bar reads about 5.41 million, as read by PC&S from the unlabelled chart (Pool Corporation 10-K, FY2021). In the FY2022 10-K, the 2021 bar reads about 5.36 million, a drop of about 0.05 million (Pool Corporation 10-K, FY2022).
The 2023 bar reads about 5.45 million in the FY2023 10-K and about 5.42 million in the FY2024 10-K, a drop of about 0.03 million (PC&S chart readings, FY2023; Pool Corporation 10-K, FY2024). Changes to the 2022 and 2024 bars between filings are 0.02 million or less, within PC&S reading error.
In the FY2025 10-K chart, the in-ground series reads about 5.16 million for 2016 and about 5.46 million for 2025 (estimate), a rise of about 0.30 million or roughly 6% (PC&S chart readings, approx., ±0.01 million; Pool Corporation 10-K, FY2025). The text of the same filing states ‘approximately 5.5 million in-ground swimming pools’.
Pool Corp series is a PC&S chart reading (approx., ±0.01M), not a number stated by Pool Corp; year-to-year moves of 0.02 million or less are within reading error. Pool Corp's stated text figures are 5.4 million (FY2024) and about 5.5 million (FY2025). FY2020 bar clipped at axis top and omitted.
Source: Leslie's, Inc. and Pool Corporation Forms 10-K, SEC EDGAR; Pool Corp values read by PC&S from unlabelled charts. Download chart data (CSV)
| company | metric | FY2020 | FY2021 | FY2022 | FY2023 | FY2024 | FY2025 | change | fact_rows |
|---|---|---|---|---|---|---|---|---|---|
| Leslie's | Residential pools (million) | 8.5 | 8.6 | 8.7 | 8.8 | 8.8 | 9.0 | +0.4 (FY2021 to FY2025) | 18-23 |
| Leslie's | Residential spas or hot tubs (million) | 5.5 | 5.5 | 5.5 | 5.5 | 5.5 | 5.5 | 0 | 24 |
| Leslie's | Commercial / professional-operator pools | 250,000 | 250,000 | 250,000 | 250,000 | 300,000 | 300,000 | +50,000 | 25-26 |
| Pool Corp | US in-ground pools, latest-year bar in each 10-K chart: PC&S chart reading (approx., ±0.01M), not stated by Pool Corp | 5.30 or more (bar clipped) | about 5.41 (2021E) | about 5.43 (2022E) | about 5.45 (2023E) | about 5.43 (2024E) | about 5.46 (2025E) | within reading error after FY2021 (moves of 0.02 or less) | 5; 7; 9; 11; 13 |
| Pool Corp | US in-ground pools, stated in text (million) | not stated | not stated | not stated | not stated | 5.4 | 5.5 | +0.1 | 2; 4 |
| Pool Corp | US bodies of water / pools and hot tubs (million) | not stated | not stated | not stated | not stated | 11.0 | 14.0 | +3.0 (wording changed) | 1; 3 |
| Hayward | Global installed base (million pools) | not filed | 25 | 25 | 25 | 25 | 25 | 0 | 29; 31 |
| Latham | US installed base | not filed | not stated | not stated | not stated | not stated | not stated | n/a | 32 |
Source: SEC EDGAR filings: Leslie’s 10-K, FY2025, FY2024, FY2023, FY2022, FY2021; Pool Corporation 10-K, FY2025, Pool Corporation 10-K, FY2024, FY2023, FY2022, FY2021, FY2020; Hayward 10-K, FY2025; Latham 10-K, FY2025. Download CSV
Hayward has estimated a global installed base of about 25 million pools in each 10-K from FY2021 to FY2025 (Hayward FY2021; Hayward 10-K, FY2025). Hayward gives no US figure. Fluidra estimates about 20 million in-ground residential pools worldwide (Fluidra 2025 Integrated Annual Report).
Latham’s 10-Ks for FY2021 to FY2025 contain no US installed-base count (Latham 10-K, FY2025). Annual new-construction volumes are covered in the PC&S report on pool construction statistics.
How many US homes have a pool: EIA survey data for 2015, 2020 and 2024
EIA’s Residential Energy Consumption Survey is the only recurring federal measurement of private pools that PC&S found. It shows about 7% of all US homes with their own pool in each survey year, with the count rising as the housing stock grows.
EIA counted 9.60 million US homes with their own swimming pool in 2024 (EIA RECS 2024, Table HC2.1). The 95% confidence interval from the microdata is 9.01 to 10.19 million (PC&S calculation).
In 2024, 7.24% of all US homes had their own pool, about 1 in 14. Among houses and mobile homes, the group EIA asks, the share was 9.82%.
Owner-occupied US homes had a pool at a rate of 10.28% in 2024 (PC&S tabulation of EIA 2024 RECS microdata).
2024 is preliminary. Share of all homes: 7.0% (2015), 6.9% (2020), 7.2% (2024).
Source: EIA Residential Energy Consumption Survey (2020 and 2024 Table HC2.1; 2015 microdata tabulated by PC&S). Download chart data (CSV)
| survey_year | homes_with_pool_million | all_homes_million | pct_of_all_homes | homes_with_heated_pool_million | source |
|---|---|---|---|---|---|
| 2015 | 8.319 | 118.208 | 7.04 | EIA 2015 RECS microdata (PC&S tabulation) | |
| 2020 | 8.52 | 123.53 | 6.9 | 2.88 | EIA 2020 RECS Table HC2.1 |
| 2024 | 9.6 | 132.54 | 7.24 | 3.44 | EIA 2024 RECS Table HC2.1 (preliminary) |
Source: EIA RECS 2024, Table HC2.1; EIA RECS 2020, Table HC2.1; EIA 2015 RECS microdata (PC&S tabulation). Download CSV
The share of pool homes with a heated pool was 33.8% in 2020 and 35.8% in 2024 (EIA RECS 2020, Table HC2.1; EIA RECS 2024, Table HC2.1). Pump and heater running costs are covered in the PC&S report on the cost to run a pool pump.
A broader federal measure exists for 2015. The American Housing Survey found 19.66 million US occupied homes with an outdoor pool anywhere on the property, 16.6% of homes, including shared apartment and condo pools (Census Bureau / HUD American Housing Survey 2015).
The 2015 AHS figure exceeds EIA’s 2015 own-pool estimate by 11.35 million homes. The gap is mostly shared pools. In 2023 the AHS asked pool questions only of households with children aged 6 and under (AHS 2023 definitions).
Which state has the most pools: estimates by state
No industry source publishes a current state breakdown. A PC&S tabulation of EIA’s 2024 microdata puts Florida first by homes with a pool, while the 2011 industry sheet put California first by in-ground pools.
Florida had an estimated 1.82 million homes with their own pool in 2024, 19.9% of Florida homes (PC&S tabulation of EIA 2024 RECS microdata). The estimate has a relative standard error of 8.4%.
California followed with 1.34 million homes with a pool in 2024, then Texas with 0.92 million, New York with 0.57 million and Arizona with 0.56 million.
Those five states held 54.2% of US homes with a pool in 2024. In 2011, California, Florida, Texas, Arizona and New York held 56.5% of US in-ground pools.
Relative standard errors range from 8% (Florida) to over 25% for smaller states.
Source: PC&S Research tabulation of EIA 2024 RECS preliminary microdata. Download chart data (CSV)
EIA states the 2024 sample was not designed to estimate every variable at state level; see standard errors in the state table.
Source: PC&S Research tabulation of EIA 2024 RECS preliminary microdata. Download chart data (CSV)
| state | inground_pools_2011_pkdata | share_of_us_inground_2011_pct | homes_with_pool_2024_recs | share_of_us_pool_homes_2024_pct | pct_of_state_homes_with_pool_2024 |
|---|---|---|---|---|---|
| California | 1218177 | 22.7 | 1344000 | 14.0 | 9.8 |
| Florida | 755208 | 14.1 | 1820000 | 18.9 | 19.9 |
| Texas | 473531 | 8.8 | 924000 | 9.6 | 8.1 |
| Arizona | 323642 | 6.0 | 561000 | 5.8 | 18.9 |
| New York | 263009 | 4.9 | 567000 | 5.9 | 7.2 |
| Top five combined | 3033567 | 56.5 | 5215000 | 54.2 |
Source: APSP / P.K. Data, U.S. Swimming Pool and Hot Tub Market 2011; PC&S tabulation of EIA 2024 RECS microdata. Download CSV
The two sources rank the top state differently. The 2011 sheet counted 1,218,177 in-ground pools in California and 755,208 in Florida (APSP / P.K. Data, U.S. Swimming Pool and Hot Tub Market 2011). PHTA cited 2017 P.K. Data putting California’s in-ground base at 1.2 million (PHTA letter, 2020).
The definitions differ. EIA counts primary-residence homes with any pool, above-ground included, and excludes second homes. P.K. Data counted in-ground pools only. Florida’s lead in 2024 may reflect above-ground pools, growth since 2011, or sampling error.
| rank | state | state_name | homes_with_pool | pct_of_homes_with_pool | share_of_us_pool_homes_pct | rse_pct | sample_households | sample_with_pool | reliability |
|---|---|---|---|---|---|---|---|---|---|
| 1 | FL | Florida | 1820000 | 19.9 | 18.9 | 8.4 | 568 | 110 | reliable (RSE under 30%) |
| 2 | CA | California | 1344000 | 9.8 | 14.0 | 10.0 | 888 | 97 | reliable (RSE under 30%) |
| 3 | TX | Texas | 924000 | 8.1 | 9.6 | 11.0 | 902 | 83 | reliable (RSE under 30%) |
| 4 | NY | New York | 567000 | 7.2 | 5.9 | 8.8 | 1025 | 86 | reliable (RSE under 30%) |
| 5 | AZ | Arizona | 561000 | 18.9 | 5.8 | 9.4 | 430 | 92 | reliable (RSE under 30%) |
| 6 | OH | Ohio | 376000 | 7.6 | 3.9 | 18.8 | 328 | 26 | reliable (RSE under 30%) |
| 7 | PA | Pennsylvania | 331000 | 6.2 | 3.5 | 18.3 | 567 | 41 | reliable (RSE under 30%) |
| 8 | NJ | New Jersey | 298000 | 8.4 | 3.1 | 14.9 | 430 | 41 | reliable (RSE under 30%) |
| 9 | GA | Georgia | 251000 | 6.0 | 2.6 | 23.3 | 321 | 20 | reliable (RSE under 30%) |
| 10 | MI | Michigan | 214000 | 5.2 | 2.2 | 21.1 | 311 | 20 | reliable (RSE under 30%) |
| 11 | NC | North Carolina | 213000 | 4.7 | 2.2 | 24.0 | 328 | 18 | reliable (RSE under 30%) |
| 12 | TN | Tennessee | 198000 | 6.8 | 2.1 | 17.9 | 486 | 35 | reliable (RSE under 30%) |
| 13 | IL | Illinois | 179000 | 3.5 | 1.9 | 28.3 | 361 | 14 | reliable (RSE under 30%) |
| 14 | LA | Louisiana | 176000 | 9.5 | 1.8 | 14.2 | 259 | 28 | reliable (RSE under 30%) |
| 15 | KY | Kentucky | 174000 | 9.4 | 1.8 | 14.9 | 318 | 32 | reliable (RSE under 30%) |
| 16 | MA | Massachusetts | 165000 | 5.8 | 1.7 | 17.5 | 486 | 34 | reliable (RSE under 30%) |
| 17 | SC | South Carolina | 163000 | 7.4 | 1.7 | 26.2 | 196 | 15 | reliable (RSE under 30%) |
| 18 | IN | Indiana | 154000 | 5.6 | 1.6 | 23.5 | 282 | 17 | reliable (RSE under 30%) |
| 19 | NV | Nevada | 146000 | 11.8 | 1.5 | 16.1 | 276 | 34 | reliable (RSE under 30%) |
| 20 | CT | Connecticut | 142000 | 9.8 | 1.5 | 16.1 | 346 | 41 | reliable (RSE under 30%) |
| 21 | OK | Oklahoma | 116000 | 7.3 | 1.2 | 21.3 | 278 | 22 | reliable (RSE under 30%) |
| 22 | MO | Missouri | 105000 | 4.1 | 1.1 | 35.5 | 247 | 11 | use with caution (RSE 30 to 50%) |
| 23 | AL | Alabama | 103000 | 5.0 | 1.1 | 24.5 | 301 | 16 | reliable (RSE under 30%) |
| 24 | WA | Washington | 34.6 | 316 | 9 | suppressed (RSE over 50% or under 10 sample pool homes) | |||
| 25 | MD | Maryland | 71000 | 3.0 | 0.7 | 28.8 | 349 | 12 | reliable (RSE under 30%) |
| 26 | WI | Wisconsin | 40.0 | 220 | 6 | suppressed (RSE over 50% or under 10 sample pool homes) | |||
| 27 | MS | Mississippi | 62000 | 5.3 | 0.6 | 27.0 | 225 | 14 | reliable (RSE under 30%) |
| 28 | AR | Arkansas | 59000 | 4.8 | 0.6 | 31.5 | 214 | 11 | use with caution (RSE 30 to 50%) |
| 29 | VA | Virginia | 39.2 | 327 | 6 | suppressed (RSE over 50% or under 10 sample pool homes) | |||
| 30 | NH | New Hampshire | 47000 | 8.3 | 0.5 | 17.9 | 244 | 23 | reliable (RSE under 30%) |
| 31 | KS | Kansas | 40.0 | 159 | 6 | suppressed (RSE over 50% or under 10 sample pool homes) | |||
| 32 | MN | Minnesota | 49.0 | 214 | 4 | suppressed (RSE over 50% or under 10 sample pool homes) | |||
| 33 | IA | Iowa | 52.6 | 171 | 5 | suppressed (RSE over 50% or under 10 sample pool homes) | |||
| 34 | RI | Rhode Island | 39000 | 8.7 | 0.4 | 20.6 | 222 | 21 | reliable (RSE under 30%) |
| 35 | OR | Oregon | 38.3 | 301 | 7 | suppressed (RSE over 50% or under 10 sample pool homes) | |||
| 36 | NE | Nebraska | 36.0 | 218 | 9 | suppressed (RSE over 50% or under 10 sample pool homes) | |||
| 37 | ME | Maine | 31000 | 5.1 | 0.3 | 27.8 | 200 | 11 | reliable (RSE under 30%) |
| 38 | WV | West Virginia | 38.1 | 202 | 8 | suppressed (RSE over 50% or under 10 sample pool homes) | |||
| 39 | UT | Utah | 51.2 | 195 | 5 | suppressed (RSE over 50% or under 10 sample pool homes) | |||
| 40 | VT | Vermont | 23000 | 8.0 | 0.2 | 26.0 | 176 | 15 | reliable (RSE under 30%) |
| 41 | DE | Delaware | 23000 | 5.5 | 0.2 | 30.0 | 152 | 10 | use with caution (RSE 30 to 50%) |
| 42 | HI | Hawaii | 18000 | 3.6 | 0.2 | 30.0 | 250 | 10 | reliable (RSE under 30%) |
| 43 | CO | Colorado | 70.3 | 259 | 2 | suppressed (RSE over 50% or under 10 sample pool homes) | |||
| 44 | NM | New Mexico | 55.6 | 232 | 4 | suppressed (RSE over 50% or under 10 sample pool homes) | |||
| 45 | ID | Idaho | 71.1 | 229 | 2 | suppressed (RSE over 50% or under 10 sample pool homes) | |||
| 46 | ND | North Dakota | 48.2 | 274 | 4 | suppressed (RSE over 50% or under 10 sample pool homes) | |||
| 47 | SD | South Dakota | 70.2 | 205 | 2 | suppressed (RSE over 50% or under 10 sample pool homes) | |||
| 48 | DC | District of Columbia | 49.0 | 397 | 4 | suppressed (RSE over 50% or under 10 sample pool homes) | |||
| 49 | MT | Montana | 100.5 | 309 | 1 | suppressed (RSE over 50% or under 10 sample pool homes) | |||
| 50 | WY | Wyoming | 101.4 | 230 | 1 | suppressed (RSE over 50% or under 10 sample pool homes) | |||
| 51 | AK | Alaska | 100.4 | 252 | 1 | suppressed (RSE over 50% or under 10 sample pool homes) |
Source: PC&S Research tabulation of EIA 2024 RECS microdata; standard errors from 60 jackknife replicate weights (EIA method). Download CSV
Pool exposure by state matters for safety research; drowning patterns are covered in the PC&S report on pool drowning statistics by state.
How many public pools are in the US
The public-pool count rests on 2011 marketing data and one retailer’s estimate. PC&S found no national government count of public pools to set against it.
CDC cites an estimated 309,000 US public aquatic venues in 2011, a category that includes pools, hot tubs and interactive water play venues (CDC MMWR 2016).
According to the same CDC report, 39.6% of those venues (122,412) were in Arizona, California, Florida, New York and Texas in 2011.
Leslie’s says professional operators manage about 300,000 US pools at hotels, motels, apartment complexes and water parks (FY2025, Leslie’s 10-K, FY2025). Its FY2021 to FY2023 filings used 250,000.
California held 45,986 of the 309,000 commercial pools in 2011, or 14.9% (APSP / P.K. Data, U.S. Swimming Pool and Hot Tub Market 2011). PHTA cited 41,438 commercial pools in California using 2017 P.K. Data (PHTA letter, 2020).
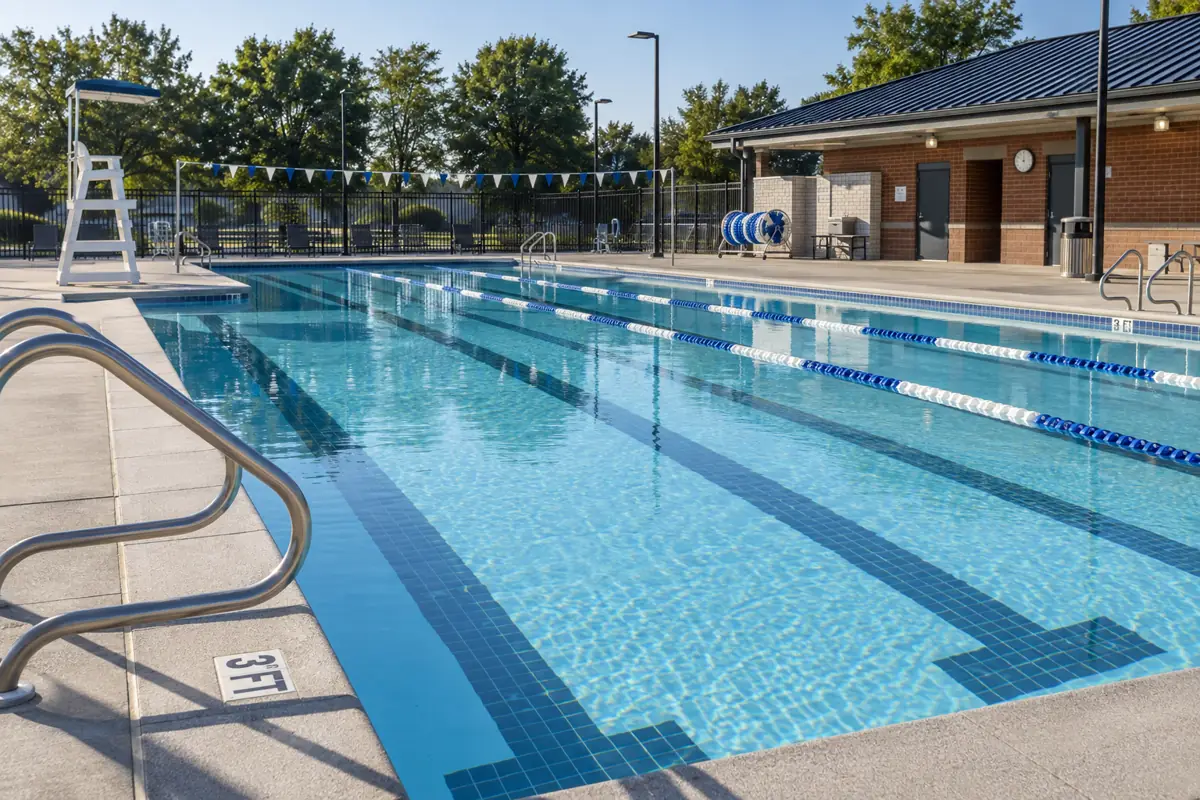
Injury data for public and residential pools are covered in the PC&S report on pool injury statistics.
Cross-check: pools mapped in OpenStreetMap
OpenStreetMap is sometimes used to count pools from aerial imagery. In five large pool counties, mapped pools per household vary 31-fold, which reflects mapping effort rather than pool ownership.
On 3 October 2026, OpenStreetMap held 154,324 features tagged as swimming pools in Maricopa County, Arizona (Overpass API). That equals 8.59 mapped pools per 100 households, using ACS 2024 households.
Miami-Dade County, Florida had 2,846 mapped pools, or 0.28 per 100 households. Los Angeles County had 29,911 (0.86 per 100), Harris County, Texas had 7,375 (0.41) and Clark County, Nevada had 3,432 (0.39).
Incomplete mapping. Do not use as a pool count.
Source: OpenStreetMap contributors via Overpass API (queried 2026-10-03); U.S. Census Bureau ACS 2024 1-year. Download chart data (CSV)
Reconciling the estimates
Estimate reconciliation and defensible range
How many swimming pools are in the US, by category, given conflicting published counts?
Low = lowest current published estimate; high = highest published estimate with a traceable origin; midpoint = (low + high) / 2; above-ground = residential minus in-groundInputs: fact rows #2, #4, #18, #25, #36, #37, #39, #47, #49, #59; derived D1 to D12
Limitations: The high end is 2011 data for the contiguous 48 states and DC. Company estimates rest on proprietary P.K. Data and unnamed sources. The above-ground range is a residual of unlike sources.
Pools per 100 US households
How common are pools relative to the number of US households?
100 x pools / ACS 2024 households (132,737,146)Inputs: fact rows #2, #4, #18, #25, #47, #49, #74; derived D16 to D19, D61 to D63
Limitations: Pool counts and household counts come from different years. Pools at second homes inflate the ratio relative to EIA’s primary-residence measure. 2024 ACS is the latest release because 2025 ACS 1-year data have no release date yet.
Change in company installed-base estimates over five filings
How have public companies’ US pool counts moved from FY2021 to FY2025, and how reliable are first estimates?
Change = latest filing minus earlier filing; revision = value for year Y in filing Y+1 minus first estimate for year Y in filing YInputs: fact rows #1 to #16, #18 to #26, #29, #31, #32; derived D32 to D41
Limitations: Pool Corporation’s annual values are PC&S pixel readings of unlabelled bar charts, rounded to 0.01 million; Pool Corporation does not state them, and differences under 0.02 million are treated as noise. Leslie’s rounds to 0.1 million, so small changes may be rounding.
Share of the installed base in the top states
Which states hold most US pools, and has concentration changed?
State share = state count / national count; 2024 state counts = sum of RECS weights for homes with a pool in each stateInputs: fact rows #36, #40 to #44, #59, #71, #73; derived D45 to D50, D64 to D67
Limitations: The 2011 and 2024 sources measure different things (in-ground pools versus homes with any pool). State estimates from the 2024 microdata carry relative standard errors of 8% to 11% for the top five and are suppressed for 19 states.
Shared-pool gap
How many more US homes have access to a pool on their grounds than own one?
AHS 2015 homes with an outdoor pool on the property minus EIA RECS 2015 homes with their own poolInputs: fact rows #69, #76, #77; derived D26, D54, D55
Limitations: Two different surveys with different questions and samples; the AHS pool rows use half its sample. No newer national AHS pool count exists.
Survey trend, 2015 to 2024
Is the number of US homes with a pool growing beyond sampling noise?
Change = 2024 estimate minus 2015 estimate; z = change / sqrt(SE2015^2 + SE2024^2)Inputs: fact rows #59, #66, #69, #71; derived D26, D29, D30, D60
Limitations: 2024 data are preliminary. Survey modes changed across cycles. The z-score treats the two samples as independent.
What holds up and what does not
- The ‘10.4 million residential and 309,000 public swimming pools’ statement on CDC’s 2013 Healthy Swimming page cites the APSP ‘U.S. Swimming Pool and Hot Tub Market 2011’ sheet (CDC Healthy Swimming Fast Facts (2013, archived)).
- That 2011 sheet lists 5,371,000 in-ground and 4,993,000 above-ground residential pools, which sum to 10,364,000, for the contiguous 48 states and DC (APSP / P.K. Data, U.S. Swimming Pool and Hot Tub Market 2011).
- Adding the 2011 sheet’s 309,000 commercial pools gives 10,673,000, the source of the ‘10.7 million total pools’ figure repeated by RubyHome (2025), Marketplace (2023) and Pool Magazine (2026).
- PHTA still publishes the 10.4 million residential, 309,000 public and 7.3 million hot tub figures on an undated page live in October 2026 (PHTA).
- Leslie’s residential pool count rose from 8.5 million in its FY2020 10-K to 9.0 million in its FY2025 10-K, filed December 2025 (Leslie’s 10-K, FY2025).
- Pool Corporation described ‘more than 14.0 million swimming pools and hot tubs in the United States’ in its FY2025 10-K, up from ‘approximately 11.0 million bodies of water’ a year earlier (Pool Corporation 10-K, FY2025).
- EIA’s survey counted 8.32 million US homes with a pool in 2015, 8.52 million in 2020 and 9.60 million in 2024 (EIA RECS 2020, Table HC2.1; EIA RECS 2024, Table HC2.1; 2015 from EIA 2015 RECS microdata).
- The 2015 to 2024 increase of 1.28 million US homes with a pool equals 2.24 combined standard errors, so it is unlikely to be sampling noise alone (PC&S calculation from EIA 2015 RECS microdata and EIA 2024 RECS microdata).
- In 2024, 11.2% of US single-family detached homes had their own pool (EIA RECS 2024, Table HC2.1).
- In 2024, 3.44 million US homes had a heated pool, 35.8% of homes with a pool (EIA RECS 2024, Table HC2.1).
- In 2015, 19.66 million US occupied homes had an outdoor pool somewhere on the property, including shared apartment and condo pools (Census Bureau / HUD American Housing Survey 2015).
- Arizona (18.9%) and Florida (19.9%) had the highest shares of homes with a pool among states in 2024; the two estimates overlap within sampling error (PC&S tabulation of EIA 2024 RECS microdata).
- The South held 46.2% of US homes with a pool in 2024 (PC&S tabulation of EIA 2024 RECS microdata).
- California held 22.7% of US in-ground pools in 2011 (1,218,177 of 5,371,000), per the APSP / P.K. Data, U.S. Swimming Pool and Hot Tub Market 2011.
- Latham reported that Florida, Texas, Arizona and California accounted for about two-thirds of US pool starts in 2025, while the same four states held 48.3% of homes with a pool in 2024 (Latham 10-K, FY2025; PC&S tabulation of EIA 2024 RECS microdata).
Most recent filings and releases
- EIA released the preliminary 2024 RECS microdata on 21 May 2026, which this report uses to estimate homes with a pool by state (EIA).
- EIA’s 2024 RECS housing tables (19 March 2026) put US homes with their own pool at 9.60 million (EIA RECS 2024, Table HC2.1).
- Latham’s FY2025 10-K (filed 4 March 2026) again gives no US installed-base count but says the Sand States took about two-thirds of 2025 pool starts (Latham 10-K, FY2025).
- Pool Corporation’s FY2025 10-K (filed 26 February 2026) raised its in-ground figure to about 5.5 million and cited more than 14.0 million pools and hot tubs (Pool Corporation 10-K, FY2025).
- Hayward’s FY2025 10-K (filed 25 February 2026) kept its global installed base at about 25 million pools for a fifth year (Hayward 10-K, FY2025).
- Leslie’s FY2025 10-K (filed 18 December 2025) raised its residential pool count to about 9.0 million (Leslie’s 10-K, FY2025).
- As of 3 October 2026, PHTA’s 2026 press releases contain no updated national pool count (PHTA), and the Census Bureau has not set a release date for 2025 ACS 1-year data (Census Bureau).
Related questions
How many homes in the US have a pool?
In 2024, 9.60 million US homes had their own swimming pool, according to EIA RECS 2024, Table HC2.1. That excludes second homes and apartments. Counting shared pools on the grounds, 19.66 million US homes had a pool on the property in 2015 (Census Bureau / HUD American Housing Survey 2015).
How many inground pools are in the US?
About 5.5 million residential in-ground pools existed in the US in 2025, according to Pool Corporation 10-K, FY2025. The 2011 APSP/P.K. Data sheet counted 5,371,000 (APSP / P.K. Data, U.S. Swimming Pool and Hot Tub Market 2011).
Which state has the most pools?
Florida had the most homes with a pool in 2024, an estimated 1.82 million, based on a PC&S tabulation of EIA 2024 RECS microdata. California had the most in-ground pools in 2011, with 1,218,177 (APSP / P.K. Data, U.S. Swimming Pool and Hot Tub Market 2011).
What percentage of US homes have a pool?
In 2024, 7.24% of all US homes had their own pool, about 1 in 14 (EIA RECS 2024, Table HC2.1). The share was 9.82% among houses and mobile homes and 11.25% among single-family detached homes.
How many public pools are there in the US?
CDC cites about 309,000 US public aquatic venues in 2011, based on P.K. Data (CDC MMWR 2016). Leslie’s estimates about 300,000 commercially operated pools in 2025 (Leslie’s 10-K, FY2025).
Sources and method
- Collected every US pool count cited by the top Google results for ‘how many swimming pools are in the us’ and ‘percentage of homes with pools’ (Serper, 3 October 2026) and traced each to its original document.
- Downloaded the six most recent Form 10-K filings of Pool Corporation, Leslie’s, Hayward Holdings and Latham Group from SEC EDGAR and saved every installed-base sentence verbatim.
- Read Pool Corporation’s unlabelled in-ground pool bar charts by pixel, calibrated to the printed axis ticks, and rounded the readings to 0.01 million; these are PC&S readings, not figures stated by Pool Corporation (script and images in the package).
- Retrieved EIA RECS Table HC2.1 for 2020 and 2024 and tabulated the 2015 and 2024 public-use microdata with EIA’s replicate-weight variance methods, including state estimates with relative standard errors.
- Retrieved Census Bureau ACS 2024 1-year household counts (Table B11001) and the 2015 American Housing Survey pool rows.
- Opened CDC, CSTE, PHTA, APSP (archived), Fluidra and OpenStreetMap sources and logged each figure with its date, geography and stated basis.
- Built the range: lowest current estimate to highest traceable estimate per category, then checked it against EIA’s survey measure.
Included: Figures with a named publisher and a document that could be opened: government surveys, SEC filings, company annual reports, trade association documents and archived copies of them. Secondary pages appear only as examples of how figures circulate. Published by the PC&S Research Desk of Pool Construction & Service, an independent matching and information service for pool builders and pool service; more datasets are on the PC&S research hub.
Excluded: Figures whose origin could not be found (the 6.1 million / 4.3 million in-ground and above-ground split; ‘PoolResearch’ state counts), unsourced state percentages, and market-size revenue figures. See excluded.md.
Conflicting numbers: Conflicting counts are shown side by side with their definitions instead of averaged. The range runs from the lowest current estimate to the highest estimate with a traceable origin. Where the government measure differs in definition (homes with a pool versus pools), it is shown as a benchmark, not merged.
Derived metrics: All calculations are in derived.csv and the scripts folder: ranges and midpoints, ratios to ACS 2024 households, filing-to-filing changes and revisions, state and regional shares from EIA microdata (60 jackknife replicate weights for 2024; 96 Fay BRR replicates for 2015), and OpenStreetMap features per household.
Caveats
- PC&S found no government agency that counts US swimming pools directly. EIA counts primary-residence homes with their own pool; CDC republishes industry data.
- The most cited national figures (10.4 million residential, 309,000 public) describe 2011 and the contiguous 48 states and DC.
- Company estimates depend on proprietary P.K. Data reports and unnamed sources; Pool Corporation’s annual values are PC&S chart readings (approx., ±0.01 million), not stated figures.
- EIA’s 2024 data are preliminary, and state estimates have wide sampling errors; 19 states are suppressed.
- No current source separates US above-ground pools; the above-ground range is a residual.
- OpenStreetMap counts reflect mapping effort and are not pool counts.
Method last reviewed October 3, 2026.
Questions and answers
Is the 10.7 million swimming pools figure accurate?
The 10.7 million figure is the 2011 APSP/P.K. Data residential base (10,364,000) plus 309,000 commercial pools, for the contiguous 48 states and DC (APSP / P.K. Data, U.S. Swimming Pool and Hot Tub Market 2011). It is 15 years old. Current estimates put all US pools at 9.3 to 10.7 million.
Where does the 10.4 million residential pools number come from?
The 10.4 million figure comes from the APSP ‘U.S. Swimming Pool and Hot Tub Market 2011’ sheet, cited by CDC in 2013 (CDC Healthy Swimming Fast Facts (2013, archived)). The sheet lists 5,371,000 in-ground and 4,993,000 above-ground pools.
How many above-ground pools are in the US?
The last direct count was 4,993,000 US above-ground pools in 2011 (APSP / P.K. Data, U.S. Swimming Pool and Hot Tub Market 2011). Current company figures imply 3.5 to 5.0 million (PC&S calculation from Leslie’s 10-K, FY2025 and Pool Corporation 10-K, FY2025).
How many US pools are heated?
In 2024, 3.44 million US homes had a heated swimming pool, 35.8% of homes with a pool (EIA RECS 2024, Table HC2.1).
How many hot tubs are in the US?
Leslie’s estimates 5.5 million US residential spas or hot tubs (FY2025, Leslie’s 10-K, FY2025). EIA counted 10.08 million US homes with a hot tub in 2024 (EIA RECS 2024, Table HC2.1). The 2011 APSP sheet counted 7,269,000.
Is the number of swimming pools in the US growing?
US homes with a pool rose from 8.32 million in 2015 to 9.60 million in 2024 (EIA 2015 RECS microdata; EIA RECS 2024, Table HC2.1). Pool Corporation’s stated in-ground figure rose from 5.4 million in its FY2024 10-K to about 5.5 million in its FY2025 10-K (Pool Corporation 10-K, FY2025).
Why do Pool Corp and Leslie's give different pool counts?
The two companies count different things. Pool Corporation’s 5.5 million counts in-ground pools only (Pool Corporation 10-K, FY2025); Leslie’s 9.0 million covers the whole residential pool market (Leslie’s 10-K, FY2025). Neither publishes its method.
What share of US pool homes are in the South?
The South held 46.2% of US homes with a pool in 2024 (PC&S tabulation of EIA 2024 RECS microdata).
Does the Census Bureau count swimming pools?
The American Housing Survey, run by the Census Bureau for HUD, found 19.66 million US homes with an outdoor pool on the property in 2015 (Census Bureau / HUD American Housing Survey 2015). Its 2023 pool questions covered only households with young children.
How many swimming pools are there in the world?
Hayward estimates about 25 million pools globally (FY2025, Hayward 10-K, FY2025). Fluidra estimates about 20 million in-ground residential pools worldwide (Fluidra 2025 Integrated Annual Report). Pool Corporation’s 5.5 million US in-ground pools equal 27.5% of Fluidra’s global in-ground figure.
Media and citation kit
Quotable figures
- EIA’s 2024 survey counted 9.60 million US homes with their own swimming pool, 7.2% of all homes. (U.S. Energy Information Administration)
- The widely repeated figure of 10.4 million US residential pools describes 2011 and the contiguous 48 states and DC. (Association of Pool & Spa Professionals; data P.K. Data, Inc.)
- Leslie’s put the US residential pool market at about 9.0 million pools in fiscal 2025, up from 8.5 million in fiscal 2020. (Leslie's, Inc.)
- Pool Corporation estimated about 5.5 million residential in-ground pools in the US in 2025. (Pool Corporation)
- In 2024, 11.2% of US single-family detached homes had their own pool. (U.S. Energy Information Administration)
- In 2015, 19.66 million US homes had an outdoor pool somewhere on the property, counting shared apartment and condo pools. (U.S. Census Bureau and HUD)
- CDC’s count of 309,000 US public aquatic venues is based on 2011 marketing data. (Centers for Disease Control and Prevention)
Sources worth citing directly
- 2024 RECS Table HC2.1, Structural and geographic characteristics of U.S. homes (preliminary), U.S. Energy Information Administration
- U.S. Swimming Pool and Hot Tub Market 2011 (archived), Association of Pool & Spa Professionals; data P.K. Data, Inc.
- Form 10-K for fiscal year 2025, Leslie's, Inc.
- Form 10-K for fiscal year 2025, Pool Corporation
- Immediate Closures and Violations Identified During Routine Inspections of Public Aquatic Facilities, MMWR Surveill Summ 2016;65(SS-5), Centers for Disease Control and Prevention
- 2015 American Housing Survey Table Specifications, Table S-01-AO, U.S. Census Bureau and HUD
Press brief
The number of swimming pools in the US is usually quoted as 10.4 million residential and 309,000 public pools. A PC&S Research review traced both figures to a 2011 industry data sheet by APSP and P.K. Data that covered the contiguous 48 states and DC. CDC republished the figures in 2013, and PHTA still uses them. Newer data point to a similar total. Leslie’s fiscal 2025 annual report puts US residential pools at about 9.0 million, and Pool Corporation estimates about 5.5 million in-ground pools in 2025. The Energy Information Administration’s 2024 household survey counts 9.60 million US homes with their own pool, 7.2% of all homes and 11.2% of single-family detached homes. A PC&S tabulation of that survey’s microdata puts Florida first with about 1.82 million homes with a pool, and the top five states hold 54.2% of the national total. The defensible range for residential pools is 9.0 to 10.4 million.
Defensible headlines
- The '10.4 million pools' statistic is 15 years old, but new federal data back up the scale
- EIA survey: 9.6 million US homes have their own swimming pool, about 1 in 14
- Florida leads US states with an estimated 1.8 million homes with a pool
- One in nine single-family detached homes in the US has a pool, federal survey finds
- Leslie's 10-K filings show the US residential pool count rising from 8.5 million to 9.0 million in five years
Cite this analysis
Pool Construction & Service. "Number of Swimming Pools in the US: Published Estimates Reconciled." PC&S Research Desk, October 3, 2026. https://poolconstructionandservice.com/research/number-of-swimming-pools-in-the-us/
Reuse
The data tables and charts in this report are licensed under CC BY 4.0. Reuse them with this attribution: “Source: Pool Construction & Service (poolconstructionandservice.com), Number of Swimming Pools in the US: Published Estimates Reconciled.” Figures from third-party sources remain subject to their publishers’ terms.
Data files
- Published US swimming pool counts and their origins, 2011 to 2025 CSV
- US swimming pools by category: low, high, midpoint and per 100 households CSV
- Company installed-base figures by 10-K filing, FY2020 to FY2025 CSV
- US homes with their own pool, EIA RECS 2015, 2020, 2024 CSV
- Homes with a pool by state, 2024, with standard errors CSV
- Top five pool states, 2011 versus 2024 CSV
- Full fact sheet with sources and limitations CSV
Source grading
Tier 1: primary and government sources (14)
- Centers for Disease Control and Prevention: Healthy Swimming: Fast Facts (archived, updated 6 Sep 2013)
- Centers for Disease Control and Prevention: Immediate Closures and Violations Identified During Routine Inspections of Public Aquatic Facilities, MMWR Surveill Summ 2016;65(SS-5)
- Council of State and Territorial Epidemiologists, hosted by CDC: Position statement supporting use of the Model Aquatic Health Code (2024)
- U.S. Energy Information Administration: 2024 RECS Table HC2.1, Structural and geographic characteristics of U.S. homes (preliminary)
- U.S. Energy Information Administration: 2024 RECS public-use microdata, version 1
- U.S. Energy Information Administration: 2024 RECS Household Questionnaire Specification, Form EIA-457A
- U.S. Energy Information Administration: Residential Energy Consumption Survey home page (release schedule)
- U.S. Energy Information Administration: How to Use the RECS 2024 Microdata File
- U.S. Energy Information Administration: 2020 RECS Table HC2.1
- U.S. Energy Information Administration: 2015 RECS public-use microdata, version 4
- U.S. Census Bureau: American Community Survey 2024 1-year, Table B11001 Household Type (summary file)
- U.S. Census Bureau: ACS News and Updates (2025 1-year release status)
- U.S. Census Bureau and HUD: 2015 American Housing Survey Table Specifications, Table S-01-AO
- U.S. Census Bureau and HUD: 2023 American Housing Survey Definitions
Tier 2: trade bodies, public companies, market research (22)
- Pool Corporation: Form 10-K for fiscal year 2025
- Pool Corporation: Form 10-K for fiscal year 2024
- Pool Corporation: Form 10-K for fiscal year 2023
- Pool Corporation: Form 10-K for fiscal year 2022
- Pool Corporation: Form 10-K for fiscal year 2021
- Pool Corporation: Form 10-K for fiscal year 2020
- Leslie's, Inc.: Form 10-K for fiscal year 2025
- Leslie's, Inc.: Form 10-K for fiscal year 2024
- Leslie's, Inc.: Form 10-K for fiscal year 2023
- Leslie's, Inc.: Form 10-K for fiscal year 2022
- Leslie's, Inc.: Form 10-K for fiscal year 2021
- Leslie's, Inc.: Form 10-K for fiscal year 2020
- Hayward Holdings, Inc.: Form 10-K for fiscal year 2025
- Hayward Holdings, Inc.: Form 10-K for fiscal year 2021
- Latham Group, Inc.: Form 10-K for fiscal year 2025
- Fluidra S.A.: 2025 Integrated Annual Report
- Association of Pool & Spa Professionals; data P.K. Data, Inc.: U.S. Swimming Pool and Hot Tub Market 2011 (archived)
- Pool & Hot Tub Alliance: Benefits of Water (National Water Safety Month)
- Pool & Hot Tub Alliance: PHTA issues call for user-consumer members of Standards Consensus Committee (16 Sep 2020)
- Pool & Hot Tub Alliance: Comment letter to the California Energy Commission, docket 19-DECARB-01 (28 May 2020)
- Pool & Hot Tub Alliance: 2026 Press Releases
- OpenStreetMap contributors: OpenStreetMap data via Overpass API, leisure=swimming_pool (queried 3 Oct 2026)
Tier 3: journalism and expert commentary (6)
- RubyHome: Swimming Pool Statistics (2026), 6 Aug 2025
- PoolDial: How Many Pools Are in the US?, 22 Feb 2026
- Pool Magazine: Understanding the U.S. Pool Market in 2026
- Marketplace: Public swimming pools, by the numbers, 18 Sep 2023
- News 13 (mynews13.com): Pools you swim in could be contaminated, 23 May 2013
- PoolGuard USA: What State Has The Most Pools?
Bibliography
- Pool Corporation. Form 10-K for fiscal year 2025. Accessed 2026-10-03.
- Pool Corporation. Form 10-K for fiscal year 2024. Accessed 2026-10-03.
- Pool Corporation. Form 10-K for fiscal year 2023. Accessed 2026-10-03.
- Pool Corporation. Form 10-K for fiscal year 2022. Accessed 2026-10-03.
- Pool Corporation. Form 10-K for fiscal year 2021. Accessed 2026-10-03.
- Pool Corporation. Form 10-K for fiscal year 2020. Accessed 2026-10-03.
- Leslie's, Inc.. Form 10-K for fiscal year 2025. Accessed 2026-10-03.
- Leslie's, Inc.. Form 10-K for fiscal year 2024. Accessed 2026-10-03.
- Leslie's, Inc.. Form 10-K for fiscal year 2023. Accessed 2026-10-03.
- Leslie's, Inc.. Form 10-K for fiscal year 2022. Accessed 2026-10-03.
- Leslie's, Inc.. Form 10-K for fiscal year 2021. Accessed 2026-10-03.
- Leslie's, Inc.. Form 10-K for fiscal year 2020. Accessed 2026-10-03.
- Hayward Holdings, Inc.. Form 10-K for fiscal year 2025. Accessed 2026-10-03.
- Hayward Holdings, Inc.. Form 10-K for fiscal year 2021. Accessed 2026-10-03.
- Latham Group, Inc.. Form 10-K for fiscal year 2025. Accessed 2026-10-03.
- Fluidra S.A.. 2025 Integrated Annual Report. Accessed 2026-10-03.
- Association of Pool & Spa Professionals; data P.K. Data, Inc.. U.S. Swimming Pool and Hot Tub Market 2011 (archived). Accessed 2026-10-03.
- Centers for Disease Control and Prevention. Healthy Swimming: Fast Facts (archived, updated 6 Sep 2013). Accessed 2026-10-03.
- Centers for Disease Control and Prevention. Immediate Closures and Violations Identified During Routine Inspections of Public Aquatic Facilities, MMWR Surveill Summ 2016;65(SS-5). Accessed 2026-10-03.
- Council of State and Territorial Epidemiologists, hosted by CDC. Position statement supporting use of the Model Aquatic Health Code (2024). Accessed 2026-10-03.
- Pool & Hot Tub Alliance. Benefits of Water (National Water Safety Month). Accessed 2026-10-03.
- Pool & Hot Tub Alliance. PHTA issues call for user-consumer members of Standards Consensus Committee (16 Sep 2020). Accessed 2026-10-03.
- Pool & Hot Tub Alliance. Comment letter to the California Energy Commission, docket 19-DECARB-01 (28 May 2020). Accessed 2026-10-03.
- Pool & Hot Tub Alliance. 2026 Press Releases. Accessed 2026-10-03.
- U.S. Energy Information Administration. 2024 RECS Table HC2.1, Structural and geographic characteristics of U.S. homes (preliminary). Accessed 2026-10-03.
- U.S. Energy Information Administration. 2024 RECS public-use microdata, version 1. Accessed 2026-10-03.
- U.S. Energy Information Administration. 2024 RECS Household Questionnaire Specification, Form EIA-457A. Accessed 2026-10-03.
- U.S. Energy Information Administration. Residential Energy Consumption Survey home page (release schedule). Accessed 2026-10-03.
- U.S. Energy Information Administration. How to Use the RECS 2024 Microdata File. Accessed 2026-10-03.
- U.S. Energy Information Administration. 2020 RECS Table HC2.1. Accessed 2026-10-03.
- U.S. Energy Information Administration. 2015 RECS public-use microdata, version 4. Accessed 2026-10-03.
- U.S. Census Bureau. American Community Survey 2024 1-year, Table B11001 Household Type (summary file). Accessed 2026-10-03.
- U.S. Census Bureau. ACS News and Updates (2025 1-year release status). Accessed 2026-10-03.
- U.S. Census Bureau and HUD. 2015 American Housing Survey Table Specifications, Table S-01-AO. Accessed 2026-10-03.
- U.S. Census Bureau and HUD. 2023 American Housing Survey Definitions. Accessed 2026-10-03.
- OpenStreetMap contributors. OpenStreetMap data via Overpass API, leisure=swimming_pool (queried 3 Oct 2026). Accessed 2026-10-03.
- RubyHome. Swimming Pool Statistics (2026), 6 Aug 2025. Accessed 2026-10-03.
- PoolDial. How Many Pools Are in the US?, 22 Feb 2026. Accessed 2026-10-03.
- Pool Magazine. Understanding the U.S. Pool Market in 2026. Accessed 2026-10-03.
- Marketplace. Public swimming pools, by the numbers, 18 Sep 2023. Accessed 2026-10-03.
- News 13 (mynews13.com). Pools you swim in could be contaminated, 23 May 2013. Accessed 2026-10-03.
- PoolGuard USA. What State Has The Most Pools?. Accessed 2026-10-03.
Related pool research
Pool Construction Statistics: New Pool Permits in 14 US Markets, 2015 to 2026
Pool Permit Processing Time: Days From Application to Issue in 12 US Cities, 2019 to 2026
Pool Removal Statistics: Permit Counts for US Cities, 2015 to 2026
Percentage of Homes With Pools by Metro and State: Backyard Pool Prevalence Index
How Many Homes Have a Hot Tub? US State Atlas of Hot Tub and Spa Ownership, 2024
Pool Industry Market Size: US Revenue Estimates Reconciled, 2017 to 2026
All pool industry research (40 reports)