Pool Evaporation Rate by City: Inches, Gallons and Refill Cost in 25 US Cities
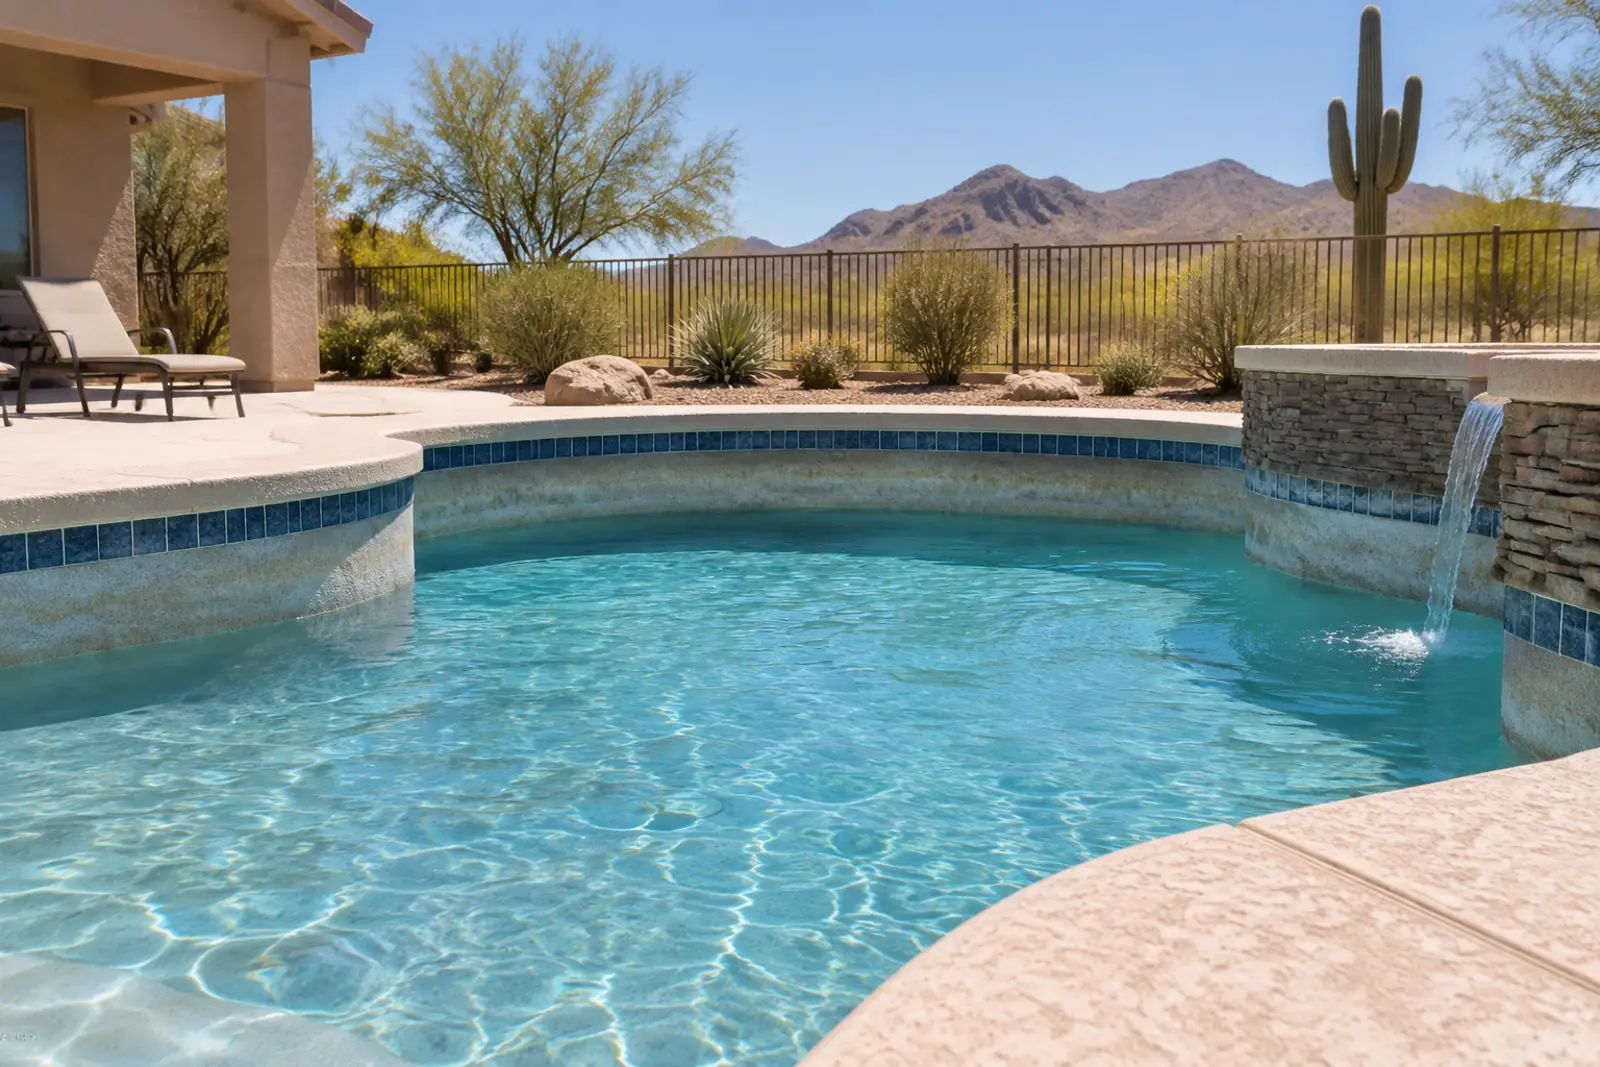
The pool evaporation rate for an uncovered 15 x 30 ft pool ranges from 37.4 inches a year in Nashville to 83.6 inches in Las Vegas across 25 US cities (10,485 to 23,444 gallons), per a NOAA-based model. Refilling costs $26.68 to $368.85 a year at October 2026 rates before rainfall, which replaces most losses in humid cities.
Five things the model shows
- Las Vegas, NV has the highest modelled pool evaporation rate of 25 US cities at 83.6 inches a year, based on 1956 to 1970 pan data in NOAA TR NWS 34 and the 0.70 coefficient in NOAA TR NWS 33.
- Nashville, TN has the lowest at 37.4 inches a year; the highest city loses 2.2 times as much water as the lowest.
- A 15 x 30 ft pool (an assumption, 450 sq ft) loses a median 13,872 gallons a year to evaporation across the 25 cities, from 10,485 in Nashville to 23,444 in Las Vegas (modelled).
- Replacing that water costs a median $134.77 a year at rates in effect in October 2026, from $26.68 in Sacramento to $368.85 in Houston, before rainfall (rates via the PC&S cost-to-fill-a-pool rate ledger).
- Normal 1991 to 2020 rainfall (NOAA NCEI 1991-2020 normals) equals or exceeds modelled evaporation in 8 of 25 cities, and the median cost after rainfall falls to $31.51 a year.
- In every one of the 25 cities the peak-month pool evaporation rate tops 1 inch a week, from 1.08 inches in San Diego to 2.74 inches in Las Vegas (modelled).
- A pool cover can prevent up to 95% of evaporation (EPA WaterSense), yet only 15% of pool owners have and regularly use one, per the 2016 Residential End Uses of Water study cited by EPA WaterSense in 2022.
- The 1956 to 1970 NOAA baseline sits within -4.8% to +0.6% of the Texas Water Development Board 1991 to 2020 averages for five Texas cities.
Pool evaporation rate by city: annual inches and gallons in 25 US cities
Modelled free water surface evaporation for an uncovered pool runs from 37.4 inches a year in Nashville to 83.6 inches in Las Vegas. The desert Southwest sits far above the Southeast, and Texas and Florida cities cluster near 50 inches.
This report starts from the monthly Class A pan evaporation means in NOAA TR NWS 34 (Farnsworth and Thompson, 1982). For 24 cities the values are Table II estimates computed from airport weather records for 1956 to 1970 with a form of the Penman equation; for Riverside, CA they are observed pan readings for 1925 to 1978 (Table I). A Class A pan runs warmer than a pool or lake, so NOAA TR NWS 33 converts pan evaporation to free water surface (FWS) evaporation with a coefficient: “The pan coefficient commonly used … is 0.7.”
Las Vegas, NV leads at 83.6 inches a year, followed by Tucson, AZ at 78.0 inches and Phoenix, AZ at 74.8 inches (modelled). Nashville, TN is lowest at 37.4 inches, and Raleigh, NC is next at 37.8 inches. Over a 15 x 30 ft surface, every inch of evaporation equals 280.5 gallons, using 7.48 gallons per cubic foot (Town of Flower Mound).
| City | NOAA TR 34 station | Pan data period | Class A pan evaporation (in/yr) | Pool evaporation, FWS x 0.70 (in/yr) | Low, x 0.64 (in/yr) | High, x 0.88 (in/yr) | Gallons per year, 15 x 30 ft pool | Peak month | Peak-month in/week | Peak-month gallons/day | Year-round average in/week |
|---|---|---|---|---|---|---|---|---|---|---|---|
| Las Vegas, NV | Las Vegas WB Airport | 1956-1970 | 119.40 | 83.6 | 76.4 | 105.1 | 23444 | Jul | 2.74 | 110 | 1.60 |
| Tucson, AZ | Tucson WB Airport | 1956-1970 | 111.45 | 78.0 | 71.3 | 98.1 | 21883 | Jun | 2.48 | 100 | 1.50 |
| Phoenix, AZ | Phoenix WB Airport | 1956-1970 | 106.89 | 74.8 | 68.4 | 94.1 | 20988 | Jun | 2.42 | 97 | 1.43 |
| Albuquerque, NM | Albuquerque WB Airport | 1956-1970 | 89.08 | 62.4 | 57.0 | 78.4 | 17491 | Jun | 2.20 | 88 | 1.20 |
| Dallas, TX | Dallas WSO | 1956-1970 | 76.77 | 53.7 | 49.1 | 67.6 | 15074 | Jul | 1.79 | 72 | 1.03 |
| San Antonio, TX | San Antonio WSO | 1956-1970 | 76.51 | 53.6 | 49.0 | 67.3 | 15023 | Jul | 1.73 | 69 | 1.03 |
| Fort Worth, TX | Fort Worth WSO | 1956-1970 | 75.90 | 53.1 | 48.6 | 66.8 | 14903 | Jul | 1.79 | 72 | 1.02 |
| Miami-Dade County (Miami), FL | Miami WSO | 1956-1970 | 74.95 | 52.5 | 48.0 | 66.0 | 14716 | Jul | 1.27 | 51 | 1.01 |
| Fresno, CA | Fresno WB Airport | 1956-1970 | 74.17 | 51.9 | 47.5 | 65.3 | 14563 | Jul | 1.96 | 78 | 1.00 |
| Orlando, FL | Orlando WB Airport | 1956-1970 | 73.15 | 51.2 | 46.8 | 64.4 | 14363 | May | 1.35 | 54 | 0.98 |
| Austin, TX | Austin WB Airport | 1956-1970 | 73.00 | 51.1 | 46.7 | 64.2 | 14334 | Jul | 1.68 | 67 | 0.98 |
| Tampa, FL | Tampa WSO | 1956-1970 | 72.59 | 50.8 | 46.5 | 63.9 | 14253 | May | 1.40 | 56 | 0.97 |
| Salt Lake City, UT | Salt Lake City WB Airport | 1956-1970 | 70.65 | 49.5 | 45.2 | 62.2 | 13872 | Jul | 2.11 | 85 | 0.95 |
| Sacramento, CA | Sacramento WB Airport | 1956-1970 | 69.68 | 48.8 | 44.6 | 61.3 | 13682 | Jul | 1.79 | 72 | 0.94 |
| Riverside, CA | Riverside Citrus Exp | 1925-1978 (observed Class A pan) | 69.38 | 48.6 | 44.4 | 61.1 | 13623 | Jul | 1.56 | 63 | 0.93 |
| Oklahoma City, OK | Oklahoma City WSFO | 1956-1970 | 67.82 | 47.5 | 43.4 | 59.7 | 13316 | Jul | 1.59 | 64 | 0.91 |
| Houston, TX | Houston WB City | 1956-1970 | 67.72 | 47.4 | 43.3 | 59.6 | 13297 | Jul | 1.37 | 55 | 0.91 |
| Denver, CO | Denver WSFO | 1956-1970 | 65.66 | 46.0 | 42.0 | 57.8 | 12892 | Jul | 1.55 | 62 | 0.88 |
| Los Angeles, CA | Los Angeles WB Airport | 1956-1970 | 65.01 | 45.5 | 41.6 | 57.2 | 12765 | Jul | 1.24 | 50 | 0.87 |
| San Diego, CA | San Diego WB Airport | 1956-1970 | 60.54 | 42.4 | 38.7 | 53.3 | 11887 | Jul | 1.08 | 43 | 0.81 |
| Charlotte, NC | Charlotte WSO | 1956-1970 | 58.08 | 40.7 | 37.2 | 51.1 | 11404 | Jul | 1.21 | 48 | 0.78 |
| New Orleans, LA | New Orleans WB Moisant | 1956-1970 | 57.97 | 40.6 | 37.1 | 51.0 | 11382 | Jun | 1.13 | 45 | 0.78 |
| Atlanta, GA | Atlanta WB Airport | 1956-1970 | 57.32 | 40.1 | 36.7 | 50.4 | 11255 | Jun | 1.16 | 46 | 0.77 |
| Raleigh, NC | Raleigh Durham WB Airport | 1956-1970 | 54.02 | 37.8 | 34.6 | 47.5 | 10607 | Jul | 1.09 | 44 | 0.73 |
| Nashville, TN | Nashville WB Airport | 1956-1970 | 53.40 | 37.4 | 34.2 | 47.0 | 10485 | Jul | 1.19 | 48 | 0.72 |
Source: PC&S model from NOAA TR NWS 34 pan means x 0.70 (NOAA TR NWS 33); low and high use the 0.64 and 0.88 coefficients in NOAA TR NWS 33. Download CSV
Modelled. Uncovered pool, no heating, no shade or wind shelter.
Source: NOAA TR NWS 34 (1956-1970 pan data) x 0.70 pan coefficient (NOAA TR NWS 33); PC&S model. Download chart data (CSV)
How much water a pool loses per week and per day, by month
Evaporation peaks in June or July in most cities and in May in Orlando and Tampa. In the peak month, all 25 cities exceed 1 inch a week; 5 western cities exceed 2 inches.
Las Vegas, NV loses a modelled 2.74 inches a week in July, about 0.391 inches or 110 gallons a day from a 15 x 30 ft pool. Phoenix, AZ peaks at 2.42 inches a week in June. Houston, TX peaks at 1.37 inches a week in July, about 55 gallons a day. San Diego, CA has the lowest peak at 1.08 inches a week (all modelled from NOAA TR NWS 34).
Averaged over the whole year, the rate falls to 0.72 inches a week in Nashville and 1.6 inches a week in Las Vegas. Miami shows the smallest seasonal swing: 0.68 inches a week in January against 1.27 inches in July (modelled).
Modelled.
Source: NOAA TR NWS 34 (1956-1970 pan data) x 0.70 pan coefficient (NOAA TR NWS 33); PC&S model. Download chart data (CSV)
Monthly inches for all 25 cities are in the downloadable file “Monthly pool evaporation in inches, 25 US cities (modelled)” below.
Rainfall offsets: net pool water loss after normal precipitation
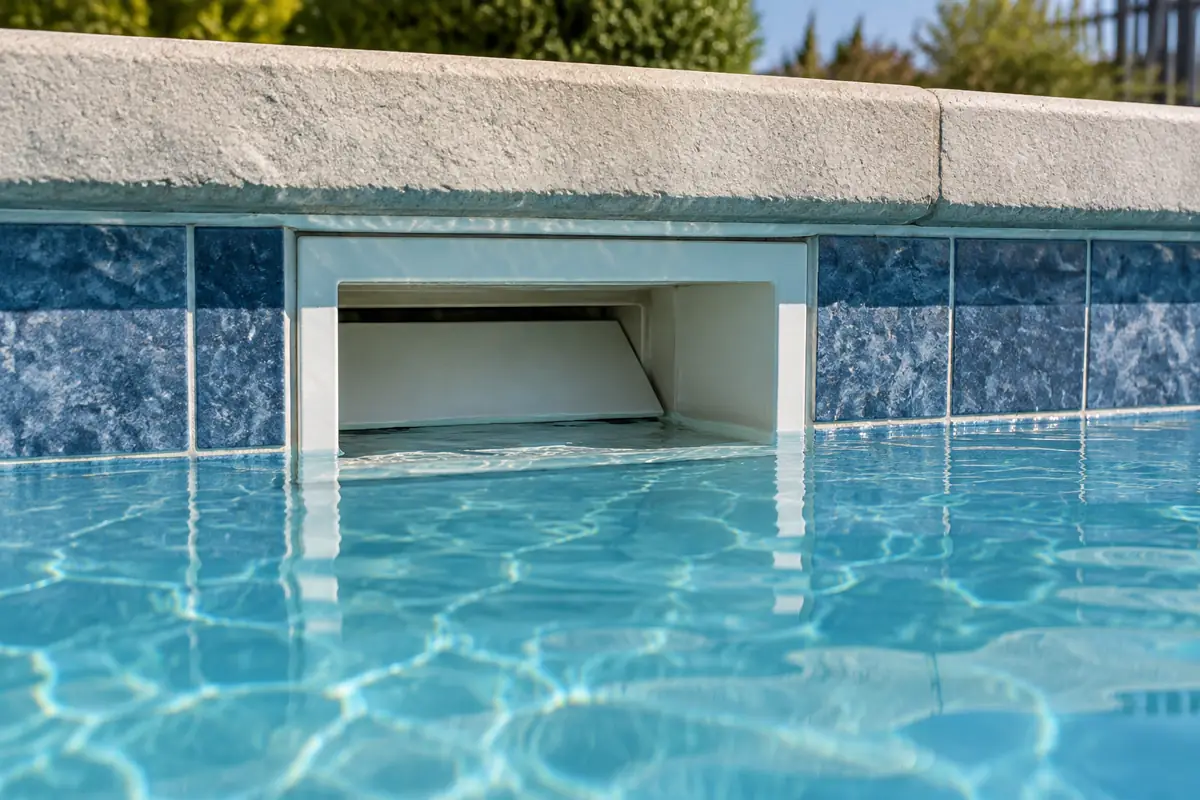
Rain that falls on the pool surface replaces part of the evaporated water. On 1991 to 2020 normals, rainfall equals or exceeds annual evaporation in 8 of 25 cities, so the refill need in the humid Southeast is a small fraction of the gross loss.
Monthly normal precipitation from the NOAA NCEI 1991-2020 normals was subtracted from each month’s modelled evaporation, with no credit carried between months. Las Vegas, NV normally gets 4.18 inches of rain a year, so rain offsets 5.0% of its evaporation. Houston, TX normally gets 51.84 inches, which offsets 93.1% on a month-by-month basis. New Orleans, LA rainfall meets or exceeds evaporation in every month (modelled).
Assumes all rain on the pool surface stays in the pool.
Source: PC&S model; NOAA TR NWS 34; NOAA NCEI 1991-2020 normals. Download chart data (CSV)
| City | Pool evaporation (in/yr) | NOAA normal precipitation 1991-2020 (in/yr) | NOAA station | Net loss after rain (in/yr) | Gross gallons, 15 x 30 ft | Net gallons after rain | Share offset by rain (%) |
|---|---|---|---|---|---|---|---|
| Las Vegas, NV | 83.6 | 4.18 | LAS VEGAS MCCARRAN AP, NV US | 79.4 | 23444 | 22272 | 5.0 |
| Phoenix, AZ | 74.8 | 7.22 | PHOENIX SKY HARBOR INTL AP, AZ US | 67.6 | 20988 | 18963 | 9.6 |
| Tucson, AZ | 78.0 | 10.61 | TUCSON INTL AP, AZ US | 67.4 | 21883 | 18907 | 13.6 |
| Albuquerque, NM | 62.4 | 8.84 | ALBUQUERQUE INTL AP, NM US | 53.5 | 17491 | 15011 | 14.2 |
| Fresno, CA | 51.9 | 10.99 | FRESNO YOSEMITE INTL AP, CA US | 43.6 | 14563 | 12233 | 16.0 |
| Riverside, CA | 48.6 | 9.37 | RIVERSIDE MUNI AP, CA US | 39.7 | 13623 | 11123 | 18.4 |
| Sacramento, CA | 48.8 | 18.14 | SACRAMENTO EXECUTIVE AP, CA US | 38.1 | 13682 | 10681 | 21.9 |
| Salt Lake City, UT | 49.5 | 15.52 | SALT LAKE CITY INTL AP, UT US | 35.4 | 13872 | 9917 | 28.5 |
| Los Angeles, CA | 45.5 | 12.23 | LOS ANGELES INTL AP, CA US | 34.1 | 12765 | 9567 | 25.0 |
| San Diego, CA | 42.4 | 9.79 | SAN DIEGO LINDBERGH FLD, CA US | 32.6 | 11887 | 9141 | 23.1 |
| Denver, CO | 46.0 | 14.48 | DENVER INTL AP, CO US | 31.5 | 12892 | 8831 | 31.5 |
| San Antonio, TX | 53.6 | 32.38 | SAN ANTONIO INTL AP, TX US | 21.2 | 15023 | 5940 | 60.5 |
| Fort Worth, TX | 53.1 | 35.34 | FT WORTH MEACHAM FLD, TX US | 19.6 | 14903 | 5496 | 63.1 |
| Dallas, TX | 53.7 | 38.32 | DALLAS LOVE FLD, TX US | 18.9 | 15074 | 5315 | 64.7 |
| Austin, TX | 51.1 | 35.57 | AUSTIN BERGSTROM AP, TX US | 17.8 | 14334 | 4980 | 65.3 |
| Oklahoma City, OK | 47.5 | 36.39 | OKLAHOMA CITY WILL ROGERS AP, OK US | 11.4 | 13316 | 3202 | 76.0 |
| Tampa, FL | 50.8 | 49.48 | TAMPA INTL AP, FL US | 11.3 | 14253 | 3161 | 77.8 |
| Orlando, FL | 51.2 | 51.45 | ORLANDO INTL AP, FL US | 9.2 | 14363 | 2567 | 82.1 |
| Miami-Dade County (Miami), FL | 52.5 | 67.41 | MIAMI INTL AP, FL US | 7.2 | 14716 | 2029 | 86.2 |
| Charlotte, NC | 40.7 | 43.60 | CHARLOTTE DOUGLAS AP, NC US | 5.7 | 11404 | 1598 | 86.0 |
| Houston, TX | 47.4 | 51.84 | HOUSTON INTERCONT AP, TX US | 3.3 | 13297 | 916 | 93.1 |
| Nashville, TN | 37.4 | 50.51 | NASHVILLE INTL AP, TN US | 2.9 | 10485 | 808 | 92.3 |
| Atlanta, GA | 40.1 | 50.43 | ATLANTA HARTSFIELD INTL AP, GA US | 2.6 | 11255 | 734 | 93.5 |
| Raleigh, NC | 37.8 | 46.07 | RALEIGH DURHAM INTL AP, NC US | 2.5 | 10607 | 713 | 93.3 |
| New Orleans, LA | 40.6 | 63.35 | NEW ORLEANS INTL AP, LA US | 0.0 | 11382 | 0 | 100.0 |
Source: PC&S model; precipitation from NOAA NCEI 1991-2020 normals (airport stations). Download CSV
Annual cost to replace evaporated pool water at October 2026 rates
Before rainfall, replacing a year of evaporation costs a median $134.77, from $26.68 in Sacramento to $368.85 in Houston. Sewer billing drives the top of the range: cities that bill sewer on every month’s metered water charge sewer on top-up water too.
Each month’s top-up was priced as the increase in that month’s bill over a 9,000-gallon household month (EPA: the average family uses more than 300 gallons a day, EPA WaterSense), using the water and sewer volume tiers compiled in the PC&S cost-to-fill-a-pool rate ledger. Fixed monthly charges do not change and are excluded. Houston, TX costs $368.85 a year at an effective $27.74 per 1,000 gallons (City of Houston, Houston Public Works). Atlanta, GA costs $328.77 a year at $29.21 per 1,000 gallons (City of Atlanta Department of Watershed Management).
Top-up water carries a sewer charge in 8 of 25 cities, where sewer makes up 42.7% to 73.0% of the modelled cost. The desert cities lose the most water but add no sewer charge on it: Las Vegas, NV costs $100.15 a year for 23,444 gallons (Las Vegas Valley Water District), and Phoenix, AZ costs $179.20 for 20,988 gallons (City of Phoenix Water Services Department). After rainfall, Los Angeles, CA has the highest cost at $187.16 a year, and the median across 25 cities drops to $31.51 (modelled).
Modelled. Fixed monthly charges excluded.
Source: PC&S model; utility rate schedules from the PC&S cost-to-fill-a-pool ledger; NOAA TR NWS 34; NOAA 1991-2020 normals. Download chart data (CSV)
| City | Water utility | Gallons per year (before rain) | Annual cost before rain ($) | Net gallons after rain | Annual cost after rain ($) | Effective $ per 1,000 gal | Sewer charged on top-ups | Sewer share of cost (%) | Water rates effective |
|---|---|---|---|---|---|---|---|---|---|
| Houston, TX | City of Houston, Houston Public Works (Houston Water) | 13297 | 368.85 | 916 | 25.40 | 27.74 | Yes | 54.8 | 2026-04-01 |
| Atlanta, GA | City of Atlanta Department of Watershed Management (DWM) | 11255 | 328.77 | 734 | 21.43 | 29.21 | Yes | 71.8 | 2024-07-01 |
| Miami-Dade County (Miami), FL | Miami-Dade Water and Sewer Department (WASD), retail | 14716 | 255.82 | 2029 | 35.27 | 17.38 | Yes | 66.6 | 2026-10-01 |
| Los Angeles, CA | Los Angeles Department of Water and Power (LADWP) | 12765 | 251.21 | 9567 | 187.16 | 19.68 | No | 0.0 | 2026-07-01 |
| Nashville, TN | Metro Water Services (Metropolitan Government of Nashville and Davidson County) | 10485 | 213.72 | 808 | 16.47 | 20.38 | Yes | 50.6 | 2026-01-01 |
| Charlotte, NC | Charlotte Water (City of Charlotte) | 11404 | 200.94 | 1598 | 28.15 | 17.62 | Yes | 52.2 | 2026-07-01 |
| New Orleans, LA | Sewerage and Water Board of New Orleans (SWBNO) | 11382 | 196.13 | 0 | 0.00 | 17.23 | Yes | 42.7 | 2021-01 |
| San Diego, CA | City of San Diego Public Utilities Department | 11887 | 188.94 | 9141 | 145.29 | 15.89 | No | 0.0 | 2026-01-01 |
| Austin, TX | Austin Water (City of Austin) | 14334 | 182.48 | 4980 | 58.47 | 12.73 | No | 0.0 | 2026-10-01 |
| Tucson, AZ | Tucson Water (City of Tucson) | 21883 | 179.43 | 18907 | 153.37 | 8.20 | No | 0.0 | 2026-07-06 |
| Phoenix, AZ | City of Phoenix Water Services Department | 20988 | 179.20 | 18963 | 162.67 | 8.54 | No | 0.0 | 2025-03-01 |
| Raleigh, NC | City of Raleigh, Raleigh Water (Public Utilities) | 10607 | 153.60 | 713 | 10.33 | 14.48 | Yes | 49.0 | 2026-07-01 |
| San Antonio, TX | San Antonio Water System (SAWS) | 15023 | 134.77 | 5940 | 53.29 | 8.97 | No | 0.0 | 2026-01-01 |
| Orlando, FL | Orlando Utilities Commission (OUC) | 14363 | 133.15 | 2567 | 23.79 | 9.27 | Yes | 73.0 | 2026-10-01 |
| Tampa, FL | City of Tampa Water Department (City of Tampa Utilities billing) | 14253 | 101.14 | 3161 | 18.92 | 7.10 | No | 0.0 | 2026-10-01 |
| Las Vegas, NV | Las Vegas Valley Water District (LVVWD), with Southern Nevada Water Authority (SNWA) charges | 23444 | 100.15 | 22272 | 95.19 | 4.27 | No | 0.0 | 2026-01-01 |
| Salt Lake City, UT | Salt Lake City Department of Public Utilities | 13872 | 97.92 | 9917 | 70.00 | 7.06 | No | 0.0 | 2026-07-01 |
| Oklahoma City, OK | City of Oklahoma City Utilities Department | 13316 | 87.48 | 3202 | 19.05 | 6.57 | No | 0.0 | 2025-11 (Nov 2025 column; exact day not stated) |
| Dallas, TX | Dallas Water Utilities (City of Dallas) | 15074 | 87.05 | 5315 | 29.24 | 5.77 | No | 0.0 | 2026-10-01 |
| Fort Worth, TX | Fort Worth Water (City of Fort Worth Water Department) | 14903 | 85.46 | 5496 | 31.51 | 5.73 | No | 0.0 | 2026-01-01 |
| Denver, CO | Denver Water (Denver Board of Water Commissioners) | 12892 | 84.32 | 8831 | 57.75 | 6.54 | No | 0.0 | 2026-01-01 (base rates); temporary drought charges from May 2026 water use through 2027-04-30 |
| Albuquerque, NM | Albuquerque Bernalillo County Water Utility Authority (ABCWUA) | 17491 | 76.36 | 15011 | 65.82 | 4.37 | No | 0.0 | 2026-07-01 |
| Riverside, CA | Riverside Public Utilities (City of Riverside) | 13623 | 40.61 | 11123 | 33.16 | 2.98 | No | 0.0 | 2026-07-01 |
| Fresno, CA | City of Fresno Department of Public Utilities, Water Division | 14563 | 33.88 | 12233 | 28.46 | 2.33 | No | 0.0 | 2016-07-01 (rate level); listed as Current in the Master Fee Schedule effective 2026-07-01 |
| Sacramento, CA | City of Sacramento Department of Utilities | 13682 | 26.68 | 10681 | 20.83 | 1.95 | No | 0.0 | 2019-07-01 |
Source: PC&S model; rate schedules from each utility via the PC&S cost-to-fill-a-pool rate ledger; evaporation from NOAA TR NWS 34; rainfall from NOAA NCEI 1991-2020 normals. Download CSV
Pool cover savings: water and dollars by city
Federal guidance puts cover savings between 30% of make-up water (archived DOE Energy Saver page) and up to 95% of evaporation (EPA WaterSense). At 50%, a 15 x 30 ft pool would save a median 6,936 gallons and $67.38 a year across 25 cities.
EPA WaterSense reports that solid covers can reduce evaporation by more than 90 percent when in use, solar bubble covers by 50 to 95 percent depending on coverage, and liquid evaporation suppressants by 15 percent. The archived DOE Energy Saver page says a cover reduces make-up water by 30% to 50% and chemical use by 35% to 60%. EPA adds that covers “are only effective at reducing evaporation when they are applied.”
In Houston, TX a 50% cut saves $184.43 a year; in Sacramento, CA it saves $13.34 (scenario, before rainfall). Only 15% of pool owners have and regularly use a cover, per the 2016 Residential End Uses of Water study cited by EPA WaterSense. Chemical savings are covered in the pool chemical prices report.
| City | Gallons evaporated per year | Gallons saved at 30% (DOE low) | Gallons saved at 50% (DOE high) | Gallons saved at 95% (EPA maximum) | $ saved at 30% | $ saved at 50% | $ saved at 95% |
|---|---|---|---|---|---|---|---|
| Houston, TX | 13297 | 3989 | 6648 | 12632 | 110.66 | 184.43 | 350.41 |
| Atlanta, GA | 11255 | 3376 | 5628 | 10692 | 98.63 | 164.38 | 312.33 |
| Miami-Dade County (Miami), FL | 14716 | 4415 | 7358 | 13980 | 76.75 | 127.91 | 243.03 |
| Los Angeles, CA | 12765 | 3830 | 6382 | 12127 | 75.36 | 125.60 | 238.65 |
| Nashville, TN | 10485 | 3146 | 5242 | 9961 | 64.12 | 106.86 | 203.03 |
| Charlotte, NC | 11404 | 3421 | 5702 | 10834 | 60.28 | 100.47 | 190.90 |
| New Orleans, LA | 11382 | 3415 | 5691 | 10813 | 58.84 | 98.07 | 186.32 |
| San Diego, CA | 11887 | 3566 | 5944 | 11293 | 56.68 | 94.47 | 179.49 |
| Austin, TX | 14334 | 4300 | 7167 | 13617 | 64.69 | 98.34 | 174.07 |
| Tucson, AZ | 21883 | 6565 | 10942 | 20789 | 60.44 | 94.44 | 170.93 |
| Phoenix, AZ | 20988 | 6296 | 10494 | 19939 | 53.76 | 89.60 | 170.24 |
| Raleigh, NC | 10607 | 3182 | 5304 | 10077 | 46.08 | 76.80 | 145.92 |
| San Antonio, TX | 15023 | 4507 | 7512 | 14272 | 40.43 | 67.38 | 128.03 |
| Orlando, FL | 14363 | 4309 | 7182 | 13645 | 39.94 | 66.57 | 126.49 |
| Tampa, FL | 14253 | 4276 | 7126 | 13540 | 37.43 | 60.27 | 97.16 |
| Las Vegas, NV | 23444 | 7033 | 11722 | 22272 | 33.41 | 55.08 | 96.00 |
| Salt Lake City, UT | 13872 | 4162 | 6936 | 13178 | 29.38 | 48.96 | 93.02 |
| Oklahoma City, OK | 13316 | 3995 | 6658 | 12650 | 29.89 | 47.86 | 83.52 |
| Dallas, TX | 15074 | 4522 | 7537 | 14320 | 31.78 | 50.40 | 83.42 |
| Fort Worth, TX | 14903 | 4471 | 7452 | 14158 | 25.64 | 42.73 | 81.19 |
| Denver, CO | 12892 | 3868 | 6446 | 12247 | 25.29 | 42.16 | 80.10 |
| Albuquerque, NM | 17491 | 5247 | 8746 | 16616 | 22.91 | 38.18 | 72.55 |
| Riverside, CA | 13623 | 4087 | 6812 | 12942 | 12.18 | 20.31 | 38.58 |
| Fresno, CA | 14563 | 4369 | 7282 | 13835 | 10.16 | 16.94 | 32.18 |
| Sacramento, CA | 13682 | 4105 | 6841 | 12998 | 8.00 | 13.34 | 25.35 |
Source: PC&S scenario; percentages from archived DOE Energy Saver page and EPA WaterSense; gallons and costs from the PC&S model. Download CSV
How the NOAA-based pool evaporation rate compares with newer and local data
The NOAA pan data are from 1956 to 1970, so the model was checked against four newer or local sources. Most checks agree within about 5%; the largest gaps come from stations that sit away from the city airport.
The Texas Water Development Board publishes monthly gross lake evaporation by one-degree quadrangle through December 2025. Against its 1991 to 2020 means, the model is -3.9% in Houston, -4.8% in Dallas, -4.8% in Fort Worth, -1.5% in Austin and +0.6% in San Antonio. TWDB’s 2016 to 2025 means are lower than its 1991 to 2020 means in all five quadrangles, so recent years do not show a rise that would make the older NOAA baseline too low.
Oklahoma State University Extension estimated 33.7 inches of May to October shallow-water evaporation for central Oklahoma (climate division 5, which contains Oklahoma City per the Oklahoma Climatological Survey) for 1997 to 2013; the model gives 32.9 inches for Oklahoma City (-2.4%). The City of Mesa evaporation chart totals 79 inches a year for the Phoenix area; the model gives 74.8 inches (-5.3%).
| City | Comparison source | Comparison period | Comparison value (in) | This model (in) | Model vs comparison (%) |
|---|---|---|---|---|---|
| Phoenix, AZ | City of Mesa evaporation chart (400 sq ft pool, Valley average) | not stated | 79.0 | 74.8 | -5.3 |
| Houston, TX | TWDB gross lake evaporation, quadrangle 812 | 1991-2020 | 49.3 | 47.4 | -3.9 |
| Dallas, TX | TWDB gross lake evaporation, quadrangle 511 | 1991-2020 | 56.4 | 53.7 | -4.8 |
| Fort Worth, TX | TWDB gross lake evaporation, quadrangle 510 | 1991-2020 | 55.8 | 53.1 | -4.8 |
| Austin, TX | TWDB gross lake evaporation, quadrangle 710 | 1991-2020 | 51.9 | 51.1 | -1.5 |
| San Antonio, TX | TWDB gross lake evaporation, quadrangle 809 | 1991-2020 | 53.3 | 53.6 | 0.6 |
| Oklahoma City, OK (May to Oct only) | OSU Extension, climate division 5 (Central), Mesonet-based | 1997-2013 | 33.7 | 32.9 | -2.4 |
| Tucson, AZ | WRCC pan record x 0.70, Tucson U of Ariz #1 | 1982-2005 | 77.7 | 78.0 | 0.3 |
| Las Vegas, NV | WRCC pan record x 0.70, Boulder City | 1931-2004 | 81.2 | 83.6 | 2.9 |
| Riverside, CA | WRCC pan record x 0.70, Riverside Citrus Exp St | 1948-2005 | 53.0 | 48.6 | -8.2 |
| Phoenix, AZ | WRCC pan record x 0.70, Mesa | 1896-2005 | 66.1 | 74.8 | 13.2 |
Sources: Texas Water Development Board; Oklahoma State University Extension; City of Mesa; Western Regional Climate Center pan records converted with 0.70; PC&S model. Download CSV
Evaporation vs swim season length: water loss continues after closing
Cities with longer swim seasons tend to evaporate more water (Spearman 0.64 across 23 metros), but a large share of evaporation happens outside the season. The median city loses 34.5% of its annual evaporation on days when the normal high is below 80F.
Swim-season windows (days with a normal high of 80F or more) come from the PC&S pool season length report, built on NOAA 1991 to 2020 daily normals. Denver, CO has a 102-day season and loses 54.8% of its evaporation outside it; Raleigh, NC loses 50.0%. Phoenix, AZ, with a 232-day season, loses 18.5% outside it (modelled). Los Angeles and San Diego airports log no days at 80F, so all their evaporation falls outside that definition.
Los Angeles and San Diego airports have no days at 80F in the season report and are excluded from this chart.
Source: PC&S model; NOAA TR NWS 34; PC&S Pool Season Length by City (NOAA 1991-2020 daily normals). Download chart data (CSV)
| City | Metro (season report) | Swim-season days (normal high >= 80F) | Season window | Pool evaporation (in/yr) | Evaporation inside season (in) | Share of evaporation outside season (%) |
|---|---|---|---|---|---|---|
| Los Angeles, CA | Los Angeles-Long Beach-Anaheim, CA | 0 | No days at 80F | 45.5 | 0.0 | 100.0 |
| San Diego, CA | San Diego-Chula Vista-Carlsbad, CA | 0 | No days at 80F | 42.4 | 0.0 | 100.0 |
| Denver, CO | Denver-Aurora-Centennial, CO | 102 | Jun 6 to Sep 15 | 46.0 | 20.8 | 54.8 |
| Raleigh, NC | Raleigh-Cary, NC | 131 | May 17 to Sep 24 | 37.8 | 18.9 | 50.0 |
| Charlotte, NC | Charlotte-Concord-Gastonia, NC-SC | 133 | May 16 to Sep 25 | 40.7 | 21.4 | 47.4 |
| Atlanta, GA | Atlanta-Sandy Springs-Roswell, GA | 142 | May 11 to Sep 29 | 40.1 | 21.5 | 46.5 |
| Salt Lake City, UT | Salt Lake City-Murray, UT | 105 | Jun 5 to Sep 17 | 49.5 | 26.6 | 46.2 |
| Oklahoma City, OK | Oklahoma City, OK | 130 | May 20 to Sep 26 | 47.5 | 25.7 | 46.0 |
| Nashville, TN | Nashville-Davidson-Murfreesboro-Franklin, TN | 138 | May 15 to Sep 29 | 37.4 | 21.3 | 43.1 |
| Riverside, CA | Riverside-San Bernardino-Ontario, CA | 164 | May 18 to Oct 28 | 48.6 | 29.6 | 39.1 |
| Dallas, TX | Dallas-Fort Worth-Arlington, TX | 161 | May 5 to Oct 12 | 53.7 | 33.5 | 37.7 |
| New Orleans, LA | New Orleans-Metairie, LA | 179 | Apr 23 to Oct 18 | 40.6 | 25.4 | 37.3 |
| Fort Worth, TX | Dallas-Fort Worth-Arlington, TX | 161 | May 5 to Oct 12 | 53.1 | 33.5 | 36.9 |
| Houston, TX | Houston-Pasadena-The Woodlands, TX | 193 | Apr 15 to Oct 24 | 47.4 | 32.2 | 32.1 |
| Sacramento, CA | Sacramento-Roseville-Folsom, CA | 155 | May 12 to Oct 13 | 48.8 | 33.1 | 32.1 |
| Fresno, CA | Fresno, CA | 160 | May 7 to Oct 13 | 51.9 | 36.4 | 29.9 |
| San Antonio, TX | San Antonio-New Braunfels, TX | 193 | Apr 14 to Oct 23 | 53.6 | 37.5 | 29.9 |
| Austin, TX | Austin-Round Rock-San Marcos, TX | 192 | Apr 15 to Oct 23 | 51.1 | 35.9 | 29.8 |
| Las Vegas, NV | Las Vegas-Henderson-North Las Vegas, NV | 180 | Apr 22 to Oct 18 | 83.6 | 59.1 | 29.3 |
| Orlando, FL | Orlando-Kissimmee-Sanford, FL | 227 | Mar 25 to Nov 6 | 51.2 | 37.1 | 27.5 |
| Tampa, FL | Tampa-St. Petersburg-Clearwater, FL | 223 | Apr 1 to Nov 9 | 50.8 | 37.0 | 27.1 |
| Tucson, AZ | Tucson, AZ | 218 | Apr 1 to Nov 4 | 78.0 | 59.2 | 24.1 |
| Miami-Dade County (Miami), FL | Miami-Fort Lauderdale-West Palm Beach, FL | 265 | Mar 8 to Nov 27 | 52.5 | 41.7 | 20.5 |
| Phoenix, AZ | Phoenix-Mesa-Chandler, AZ | 232 | Mar 22 to Nov 8 | 74.8 | 61.0 | 18.5 |
Source: PC&S model; season windows from the PC&S pool season length report. Download CSV
Leak or evaporation: official tests and thresholds
EPA WaterSense treats a loss of more than 2 inches a week, or 3 inches in hot, dry areas, as a likely leak. The modelled peak-month rate stays under 2 inches a week in 20 of 25 cities and under 3 inches in all 25.
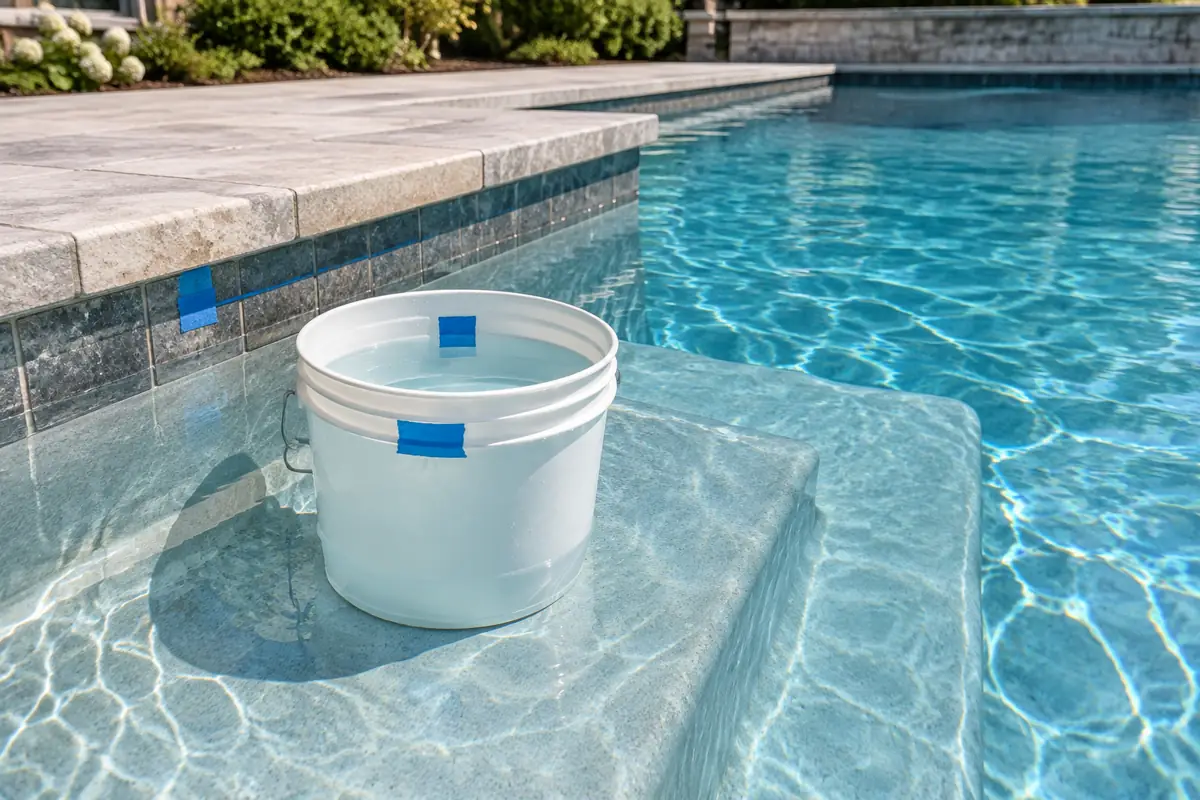
- EPA WaterSense bucket test: on a day without rain or heavy wind, shut off pool systems and the autofill, set a 2.5 to 5 gallon bucket on a step, mark the bucket and pool levels, and compare after 24 hours. If the pool drops more than the bucket, the pool may have a leak.
- City of Mesa version: compare after two or three days, then repeat for 24 hours with the pump on and 24 hours with it off; more loss with the pump on points to plumbing.
- The City of Mesa estimates that up to 30% of all pools may have a leak, and that an autofill valve can hide it.
Model outputs
Annual pool evaporation per city, in inches and gallons
How much water does an uncovered 15 x 30 ft pool lose to evaporation each year in each city?
Annual inches = sum of 12 monthly Class A pan means x 0.70; gallons = inches x 450 sq ft / 12 x 7.48Inputs: Fact rows 1 (0.70 coefficient), 7 (7.48 gal per cubic foot) and the 25 pan_ rows (NOAA TR 34); derived D1, D2
Limitations: Pan data from 1956 to 1970; one national coefficient; no heating, shade, wind shelter, splash-out or backwash.
Annual refill cost at official utility rates
What does it cost to replace that water at rates in effect in October 2026?
Sum over months of bill(9,000 gal + top-up) minus bill(9,000 gal), water and sewer volume tiers; two-month bills priced in month pairsInputs: Derived gallons per city; the 25 rate_ fact rows (utility schedules via the PC&S fill-cost ledger); fact row 10 (EPA 300 gal/day)
Limitations: Fixed charges excluded; winter-average sewer effects not modelled; rates change, so costs are a snapshot.
Pool cover savings scenario
How much water and money would a pool cover save in each city?
Gallons saved = annual gallons x 30%, 50% or 95%; dollars saved = annual cost minus the cost of the remaining top-upsInputs: Fact rows for DOE 30% and 50% (archived) and EPA 95%; derived gallons and costs per city
Limitations: Savings depend on how many hours the cover is on; a solid cover also keeps rain out, which this scenario ignores.
Evaporation vs swim season length
Do cities with longer swim seasons lose more water, and how much is lost outside the season?
Spearman and Pearson correlation of annual FWS inches vs swim-season days at 80F; out-of-season share = evaporation on days outside the season window / annualInputs: Derived FWS per city; season_ fact rows (PC&S season report, NOAA 1991 to 2020 daily normals)
Limitations: Association only; daily evaporation spread evenly within each month; 80F threshold is one definition of swim season.
Rainfall offset
How much of the evaporated water does normal rainfall replace?
Net inches = sum over months of max(0, FWS minus normal precipitation); offset = 1 minus net / grossInputs: Derived FWS per city; prcp_ fact rows (NOAA NCEI 1991-2020 monthly normals)
Limitations: Assumes all rain stays in the pool; ignores overflow, draining and dry spells within a month.
Rule-of-thumb check
Does the common quarter-inch-a-day rule match the data?
0.25 inches x 365 days = 91.25 inches a year, compared with modelled annual evaporationInputs: Fact rows for the Latham rule of thumb and the Flower Mound estimate; derived FWS and peak-day rates per city
Limitations: Rule of thumb is not location-specific; heated or windy pools can exceed it.
Results by the numbers
- Las Vegas, NV: 83.6 inches of modelled pool evaporation a year, or 23,444 gallons from a 15 x 30 ft pool (NOAA pan data 1956 to 1970, NOAA TR NWS 34).
- Tucson, AZ: 78.0 inches a year; Phoenix, AZ: 74.8 inches a year; Albuquerque, NM: 62.4 inches a year (modelled, NOAA TR NWS 34).
- Nashville, TN: 37.4 inches a year, the lowest of 25 US cities; Raleigh, NC: 37.8 inches; Atlanta, GA: 40.1 inches (modelled, NOAA TR NWS 34).
- The median city in the 25-city set loses 49.5 inches a year to evaporation (modelled, pan x 0.70, NOAA TR NWS 33).
- Las Vegas peaks at 2.74 inches a week in July, about 110 gallons a day from a 15 x 30 ft pool (modelled from NOAA TR NWS 34).
- 5 of 25 cities exceed 2 inches a week in their peak month: Albuquerque, Las Vegas, Phoenix, Salt Lake City, Tucson (modelled). EPA WaterSense treats loss above 2 inches a week, or 3 inches in hot, dry areas, as a likely leak.
- Houston, TX: $368.85 a year to replace evaporated water before rainfall at City of Houston rates effective 2026-04-01, because sewer is billed on each month’s metered water (City of Houston, Houston Public Works).
- Sacramento, CA: $26.68 a year, the lowest of 25 cities, at a flat-fee sewer and a single water rate effective 2019-07-01 (City of Sacramento Department of Utilities).
- After normal rainfall, Los Angeles, CA has the highest modelled refill cost at $187.16 a year, because LAX normally gets 12.23 inches of rain against 45.5 inches of evaporation (NOAA NCEI 1991-2020 normals).
- New Orleans, LA: normal monthly rainfall at the New Orleans International Airport station (63.35 inches a year, 1991 to 2020) meets or exceeds modelled evaporation in every month, so the net refill need is 0 gallons (NOAA NCEI 1991-2020 normals).
- A cover that cuts evaporation by 50%, the top of the 30% to 50% make-up water range on the archived DOE Energy Saver page, would save a median $67.38 and 6,936 gallons a year per 15 x 30 ft pool across the 25 cities (scenario).
- Denver, CO loses 54.8% of its annual pool evaporation on days outside its 80F swim season; Phoenix, AZ loses 18.5% (modelled with the PC&S pool season length report).
- Across 23 metros, annual evaporation and swim-season length are positively associated (Spearman rank correlation 0.64, Pearson 0.45), not perfectly linked (PC&S calculation).
- Houston’s Texas Water Development Board quadrangle recorded 52.0 inches of gross lake evaporation in 2025, against a 1991 to 2020 mean of 49.3 inches (Texas Water Development Board, data through December 2025).
FAQ
What is a normal pool evaporation rate?
Across 25 US cities the modelled annual rate runs from 37.4 to 83.6 inches, with a median of 49.5 inches, based on NOAA TR NWS 34 pan data and the 0.70 coefficient in NOAA TR NWS 33.
Which US city has the highest pool evaporation rate?
Las Vegas, NV, at 83.6 inches a year, or 23,444 gallons from a 15 x 30 ft pool (modelled from NOAA TR NWS 34).
Which city in the study has the lowest pool evaporation rate?
Nashville, TN, at 37.4 inches a year, or 10,485 gallons from a 15 x 30 ft pool (modelled from NOAA TR NWS 34).
Does rain make up for pool evaporation?
In 8 of 25 cities, 1991 to 2020 normal rainfall (NOAA NCEI 1991-2020 normals) equals or exceeds annual evaporation. In Las Vegas, rain offsets only 5.0%.
Why is pan evaporation multiplied by 0.70?
A Class A pan gains heat through its sides and bottom and evaporates faster than a pool or lake. NOAA TR NWS 33 gives 0.7 as the commonly used coefficient and a May to October range of 0.64 to 0.88.
How many gallons is one inch of water in a 15 x 30 ft pool?
280.5 gallons, from 450 sq ft x 1/12 ft x 7.48 gallons per cubic foot (Town of Flower Mound).
Is the quarter-inch-a-day rule accurate?
As a year-round average it is too high. A quarter inch a day equals 91.25 inches a year, above the modelled total for every one of 25 cities; Las Vegas tops the list at 83.6 inches (NOAA TR NWS 34).
Does a pool keep evaporating after swim season ends?
Yes. Denver, CO loses 54.8% of its annual evaporation on days with a normal high below 80F; the median across 22 cities with a season is 34.5% (modelled with the PC&S pool season length report).
How much money can a pool cover save on water?
At a 50% cut (archived DOE Energy Saver page), a 15 x 30 ft pool saves a median $67.38 a year across 25 cities, and $184.43 in Houston (scenario at October 2026 rates).
Are 1956 to 1970 evaporation data still valid?
For the cities checked, yes within a few percent: the model sits -4.8% to +0.6% from Texas Water Development Board 1991 to 2020 averages in five Texas cities and -2.4% from an Oklahoma State University Extension 1997 to 2013 estimate for central Oklahoma.
More questions answered
How much water does a pool lose per day?
In the peak month, a 15 x 30 ft uncovered pool loses a modelled 0.391 inches a day (110 gallons) in Las Vegas in July and 0.195 inches (55 gallons) in Houston in July, based on NOAA TR NWS 34 pan data x 0.70. Averaged over the year, Las Vegas loses 0.23 inches a day.
Is it normal for a pool to lose an inch of water a week?
Yes in summer. The modelled peak-month rate exceeds 1 inch a week in all 25 cities, from 1.08 inches in San Diego to 2.74 inches in Las Vegas. EPA WaterSense flags more than 2 inches a week, or 3 inches in hot, dry areas, as a likely leak.
How do I know if my pool is leaking or evaporating?
Run a bucket test: set a bucket of water on a pool step, mark both levels, switch off the autofill and compare after 24 hours (EPA WaterSense) or two to three days (City of Mesa). If the pool drops more than the bucket, a leak is likely.
Does a pool cover stop evaporation?
A cover can prevent up to 95% of evaporation (EPA WaterSense); solid covers cut it by more than 90% when in use and solar covers by 50% to 95% (EPA WaterSense). The archived DOE Energy Saver page puts the reduction in make-up water at 30% to 50%.
How much does it cost to top off a pool?
Replacing a year of evaporation from a 15 x 30 ft pool costs a median $134.77 across 25 US cities at October 2026 rates before rainfall, from $26.68 in Sacramento to $368.85 in Houston (modelled with the PC&S cost-to-fill-a-pool rate ledger).
Assumptions and method
- Selected the 25 cities with official water and sewer rate schedules in the PC&S cost-to-fill-a-pool ledger (rates in effect 2026-10-04).
- Typed the monthly Class A pan evaporation means for each city’s airport station from NOAA TR NWS 34 Table II (Riverside: Table I) and checked each row against the printed page images.
- Converted pan to free water surface evaporation with the 0.70 coefficient from NOAA TR NWS 33 (sensitivity: 0.64 and 0.88).
- Converted inches to gallons for an assumed 15 x 30 ft (450 sq ft) pool surface at 7.48 gallons per cubic foot.
- Subtracted NOAA NCEI 1991-2020 monthly precipitation normals month by month for the net-of-rain estimate.
- Priced each month’s top-up as the increment over a 9,000-gallon household month, using the ledger’s water and sewer volume tiers.
- Applied cover savings of 30%, 50% (DOE, archived) and 95% (EPA upper bound) as scenarios.
- Checked the model against TWDB 1991-2020 lake evaporation, an OSU Mesonet-based estimate, the City of Mesa chart and WRCC pan records.
- Joined swim-season windows from the PC&S season report to compute out-of-season shares and correlations.
Included: Government, academic and utility sources opened on 2026-10-07 (utility schedules compiled 2026-10-04); pan station data with at least 10 years of record per NOAA TR 34 rules.
Excluded: Unsourced evaporation charts, commercial calculators and statistics without a stated method; see excluded.md.
Conflicting numbers: Where sources differ (for example the City of Mesa 79-inch chart vs 74.8 inches modelled for Phoenix), both are shown with the percentage gap. Rules of thumb are compared with the model, not used as inputs.
Derived metrics: All derived values are in derived.csv with formulas and input rows, reproducible with scripts/compute.py, make_facts.py and make_tables.py.
Caveats
- Pan data cover 1956 to 1970 (Riverside 1925 to 1978); newer data exist only for some cities and were used as checks.
- One national coefficient (0.70) is applied; NOAA map 4 coefficients vary from 0.64 to 0.88 by location.
- The 15 x 30 ft pool is an assumption, not a national average; scale gallons and costs by surface area.
- Heated pools, water features, wind exposure, shade, splash-out, backwash and leaks are not modelled.
- Net-of-rain figures assume all rain stays in the pool; costs exclude fixed charges and winter-average sewer effects.
- Airport stations may differ from neighborhood conditions within a metro.
Method last reviewed October 7, 2026.
Data vintage and updates
- The U.S. Department of Energy Energy Saver page on pool covers returned HTTP 404 when checked on 2026-10-07; this report cites the archived capture of 2025-01-10 for the 30% to 50% make-up water figure (archived DOE Energy Saver page).
- Water rate schedules effective 2026-10-01 for Austin Water, Dallas Water Utilities, Miami-Dade WASD, OUC (Orlando) and the City of Tampa are used in the refill model (PC&S cost-to-fill-a-pool rate ledger).
- Schedules effective in July 2026 apply for Albuquerque, Charlotte, Los Angeles (LADWP), Raleigh, Riverside and Salt Lake City (2026-07-01) and Tucson (2026-07-06) (PC&S cost-to-fill-a-pool rate ledger).
- The Texas Water Development Board updated its quadrangle lake evaporation data through December 2025. San Antonio’s quadrangle 809 recorded 58.6 inches of gross evaporation in 2025, against a 1991 to 2020 mean of 53.3 inches.
- City of Houston water rates effective 2026-04-01 set the top water tier at $20.20 per 1,000 gallons; Houston has the highest modelled evaporation refill cost before rainfall (City of Houston, Houston Public Works).
Newsroom kit
Quotable results
- An uncovered 15 x 30 ft pool in Las Vegas, NV loses a modelled 23,444 gallons a year to evaporation, the most of 25 US cities (NOAA pan data, 1956 to 1970). (NOAA National Weather Service)
- Modelled pool evaporation across 25 US cities ranges from 37.4 inches a year in Nashville, TN to 83.6 inches in Las Vegas, NV. (NOAA National Weather Service)
- Replacing a year of pool evaporation costs $368.85 in Houston, TX and $26.68 in Sacramento, CA at rates in effect in October 2026 (modelled, before rainfall). (Pool Construction & Service)
- Normal 1991 to 2020 rainfall equals or exceeds annual pool evaporation in 8 of 25 US cities studied. (NOAA National Centers for Environmental Information)
- Only 15% of US pool owners have and regularly use a pool cover, according to the 2016 Residential End Uses of Water study cited by EPA in 2022. (U.S. Environmental Protection Agency)
- Denver, CO loses 54.8% of its annual pool evaporation outside its 80F swim season (modelled). (Pool Construction & Service)
Primary sources to cite
- NOAA Technical Report NWS 34: Mean Monthly, Seasonal, and Annual Pan Evaporation for the United States (Farnsworth and Thompson, December 1982), NOAA National Weather Service
- NOAA Technical Report NWS 33: Evaporation Atlas for the Contiguous 48 United States (Farnsworth, Thompson and Peck, June 1982), NOAA National Weather Service
- U.S. Climate Normals 1991-2020, monthly station files (MLY-PRCP-NORMAL), NOAA National Centers for Environmental Information
- Jump Into Pool Water Efficiency (EPA-832-F-22-015, September 2022), U.S. Environmental Protection Agency
- Lake Evaporation and Rainfall: quadrangle gross lake evaporation, data through December 2025, Texas Water Development Board
Summary for media
An uncovered residential pool in Las Vegas loses about 83.6 inches of water a year to evaporation, more than twice the 37.4 inches lost in Nashville, according to a Pool Construction & Service model built on NOAA evaporation data for 25 US cities. For a 15 x 30 ft pool that is 23,444 gallons in Las Vegas and 10,485 in Nashville. Priced at water and sewer rates in effect in October 2026, replacing a year of evaporation costs from $26.68 in Sacramento to $368.85 in Houston, where sewer is billed on every gallon. Normal rainfall changes the picture: in 8 of the 25 cities, rain equals or exceeds annual evaporation, and the median refill cost after rain falls to $31.51. EPA says a cover can prevent up to 95% of evaporation, yet only 15% of owners use one regularly. The NOAA baseline from 1956 to 1970 matched newer Texas and Oklahoma estimates within 5%.
Headlines the model supports
- Las Vegas pools lose 23,444 gallons a year to evaporation, the most of 25 US cities
- Houston pool owners pay $368.85 a year to replace evaporated water, the most of 25 cities studied
- Rain replaces most pool evaporation in 8 of 25 US cities, NOAA-based model finds
- Denver pools lose 54.8% of their evaporation after swim season ends
- Only 15% of pool owners use a cover regularly, though EPA says covers block up to 95% of evaporation
Cite this model
Pool Construction & Service. "Pool Evaporation Rate by City: Inches, Gallons and Refill Cost in 25 US Cities." PC&S Research Desk, October 7, 2026. https://poolconstructionandservice.com/research/pool-evaporation-rate/
License
The data tables and charts in this report are licensed under CC BY 4.0. Reuse them with this attribution: “Source: Pool Construction & Service (poolconstructionandservice.com), Pool Evaporation Rate by City: Inches, Gallons and Refill Cost in 25 US Cities.” Figures from third-party sources remain subject to their publishers’ terms.
Download tables
- Annual pool evaporation rate and gallons, 25 US cities (modelled) CSV
- Monthly pool evaporation in inches, 25 US cities (modelled) CSV
- Pool evaporation vs 1991-2020 normal rainfall, 25 US cities CSV
- Annual refill cost at October 2026 rates, 25 US cities CSV
- Pool cover water and dollar savings scenarios, 25 US cities CSV
- Model checks against TWDB, OSU, City of Mesa and WRCC data CSV
- Swim season length vs evaporation, 24 US cities CSV
- Full fact sheet with sources and limitations CSV
Evidence tiers
Tier 1: primary and government sources (39)
- NOAA National Weather Service: NOAA Technical Report NWS 34: Mean Monthly, Seasonal, and Annual Pan Evaporation for the United States (Farnsworth and Thompson, December 1982)
- NOAA National Weather Service: NOAA Technical Report NWS 33: Evaporation Atlas for the Contiguous 48 United States (Farnsworth, Thompson and Peck, June 1982)
- NOAA National Centers for Environmental Information: U.S. Climate Normals 1991-2020, monthly station files (MLY-PRCP-NORMAL)
- Western Regional Climate Center (DRI, NOAA Regional Climate Center): Monthly average pan evaporation, comparative table (Western states)
- Texas Water Development Board: Lake Evaporation and Rainfall: quadrangle gross lake evaporation, data through December 2025
- Oklahoma State University Extension: Evaporation Losses from Shallow Water Bodies in Oklahoma (BAE-1529, October 2016)
- Oklahoma Climatological Survey: Oklahoma Climate: climate divisions map
- City of Mesa, Arizona: Is Your Pool Leaking? (pool evaporation chart, 400 sq ft pool)
- U.S. Environmental Protection Agency: Pool Water Efficiency (WaterSense)
- U.S. Environmental Protection Agency: Jump Into Pool Water Efficiency (EPA-832-F-22-015, September 2022)
- U.S. Environmental Protection Agency: How We Use Water (WaterSense)
- U.S. Department of Energy: Swimming Pool Covers (Energy Saver), archived capture of 2025-01-10; live page returned HTTP 404 on 2026-10-07
- Town of Flower Mound, Texas: Pool Evaporation (utility billing guidance)
- Olivenhain Municipal Water District: Pool: Frequently Asked Questions
- Albuquerque Bernalillo County Water Utility Authority (ABCWUA): Water rate schedule (ABCWUA Water and Sewer Rate Ordinance O-26-1 (approved))
- City of Atlanta Department of Watershed Management (DWM): Water rate schedule (Water and Sewer Rates (DWM))
- Austin Water (City of Austin): Water rate schedule (Rates and Fees | Austin Water)
- Charlotte Water (City of Charlotte): Water rate schedule (Rates & Fees, Charlotte Water (FY27 current rates))
- Dallas Water Utilities (City of Dallas): Water rate schedule (DWU Monthly Payment Rates, effective October 1, 2026)
- Denver Water (Denver Board of Water Commissioners): Water rate schedule (2026 Residential Water Rates | Denver Water)
- Fort Worth Water (City of Fort Worth Water Department): Water rate schedule (Water and wastewater rates - City of Fort Worth)
- City of Fresno Department of Public Utilities, Water Division: Water rate schedule (City of Fresno Master Fee Schedule, Public Utilities Department (Amendment #590, all fees effective 07/01/2026))
- City of Houston, Houston Public Works (Houston Water): Water rate schedule (2026 Water & Wastewater Rates (City of Houston))
- Las Vegas Valley Water District (LVVWD), with Southern Nevada Water Authority (SNWA) charges: Water rate schedule (Water rates | Las Vegas Valley Water District)
- Los Angeles Department of Water and Power (LADWP): Water rate schedule (Schedule A - Residential (LADWP))
- Miami-Dade Water and Sewer Department (WASD), retail: Water rate schedule (Rates, Fees and Charges (WASD))
- Metro Water Services (Metropolitan Government of Nashville and Davidson County): Water rate schedule (Water, Sewer and Stormwater Rates (Metro Water Services))
- Sewerage and Water Board of New Orleans (SWBNO): Water rate schedule (Rates, Fees & Charges (SWBNO))
- City of Oklahoma City Utilities Department: Water rate schedule (Utilities Rates & Fees | City of OKC)
- Orlando Utilities Commission (OUC): Water rate schedule (OUC Service Rates & Costs)
- City of Phoenix Water Services Department: Water rate schedule (Water and Sewer Rates | City of Phoenix)
- City of Raleigh, Raleigh Water (Public Utilities): Water rate schedule (Public Utilities Rates, Effective July 1, 2026)
- Riverside Public Utilities (City of Riverside): Water rate schedule (Schedule WA-1A Single-Family Residential Metered Service)
- City of Sacramento Department of Utilities: Water rate schedule (Exhibit A Water Service Fees and Charges (rates effective July 1, 2016 to July 1, 2019))
- Salt Lake City Department of Public Utilities: Water rate schedule (FY27 Rates | Public Utilities)
- San Antonio Water System (SAWS): Water rate schedule (Residential Water & Sewer Rates - SAWS)
- City of San Diego Public Utilities Department: Water rate schedule (Water Billing Rates (City of San Diego))
- City of Tampa Water Department (City of Tampa Utilities billing): Water rate schedule (Residential Water and Wastewater Rate Schedule, Effective October 1, 2026)
- Tucson Water (City of Tucson): Water rate schedule (Residential Water Bill | City of Tucson)
Tier 2: trade bodies, public companies, market research (2)
- Pool Construction & Service: Cost to Fill a Pool: water and sewer rate ledger, 25 US cities (rates in effect 2026-10-04)
- Pool Construction & Service: Pool Season Length by City (NOAA 1991-2020 daily normals, 60 metros)
Tier 3: journalism and expert commentary (1)
Sources
- NOAA National Weather Service. NOAA Technical Report NWS 34: Mean Monthly, Seasonal, and Annual Pan Evaporation for the United States (Farnsworth and Thompson, December 1982). Accessed 2026-10-07.
- NOAA National Weather Service. NOAA Technical Report NWS 33: Evaporation Atlas for the Contiguous 48 United States (Farnsworth, Thompson and Peck, June 1982). Accessed 2026-10-07.
- NOAA National Centers for Environmental Information. U.S. Climate Normals 1991-2020, monthly station files (MLY-PRCP-NORMAL). Accessed 2026-10-07.
- Western Regional Climate Center (DRI, NOAA Regional Climate Center). Monthly average pan evaporation, comparative table (Western states). Accessed 2026-10-07.
- Texas Water Development Board. Lake Evaporation and Rainfall: quadrangle gross lake evaporation, data through December 2025. Accessed 2026-10-07.
- Oklahoma State University Extension. Evaporation Losses from Shallow Water Bodies in Oklahoma (BAE-1529, October 2016). Accessed 2026-10-07.
- Oklahoma Climatological Survey. Oklahoma Climate: climate divisions map. Accessed 2026-10-07.
- City of Mesa, Arizona. Is Your Pool Leaking? (pool evaporation chart, 400 sq ft pool). Accessed 2026-10-07.
- U.S. Environmental Protection Agency. Pool Water Efficiency (WaterSense). Accessed 2026-10-07.
- U.S. Environmental Protection Agency. Jump Into Pool Water Efficiency (EPA-832-F-22-015, September 2022). Accessed 2026-10-07.
- U.S. Environmental Protection Agency. How We Use Water (WaterSense). Accessed 2026-10-07.
- U.S. Department of Energy. Swimming Pool Covers (Energy Saver), archived capture of 2025-01-10; live page returned HTTP 404 on 2026-10-07. Accessed 2026-10-07.
- Town of Flower Mound, Texas. Pool Evaporation (utility billing guidance). Accessed 2026-10-07.
- Olivenhain Municipal Water District. Pool: Frequently Asked Questions. Accessed 2026-10-07.
- Latham Pool Products. My Swimming Pool is Losing Water: Is It Evaporation or a Leak? (June 16, 2024). Accessed 2026-10-07.
- Pool Construction & Service. Cost to Fill a Pool: water and sewer rate ledger, 25 US cities (rates in effect 2026-10-04). Accessed 2026-10-07.
- Pool Construction & Service. Pool Season Length by City (NOAA 1991-2020 daily normals, 60 metros). Accessed 2026-10-07.
- Albuquerque Bernalillo County Water Utility Authority (ABCWUA). Water rate schedule (ABCWUA Water and Sewer Rate Ordinance O-26-1 (approved)). Accessed 2026-10-04.
- City of Atlanta Department of Watershed Management (DWM). Water rate schedule (Water and Sewer Rates (DWM)). Accessed 2026-10-04.
- Austin Water (City of Austin). Water rate schedule (Rates and Fees | Austin Water). Accessed 2026-10-04.
- Charlotte Water (City of Charlotte). Water rate schedule (Rates & Fees, Charlotte Water (FY27 current rates)). Accessed 2026-10-04.
- Dallas Water Utilities (City of Dallas). Water rate schedule (DWU Monthly Payment Rates, effective October 1, 2026). Accessed 2026-10-04.
- Denver Water (Denver Board of Water Commissioners). Water rate schedule (2026 Residential Water Rates | Denver Water). Accessed 2026-10-04.
- Fort Worth Water (City of Fort Worth Water Department). Water rate schedule (Water and wastewater rates - City of Fort Worth). Accessed 2026-10-04.
- City of Fresno Department of Public Utilities, Water Division. Water rate schedule (City of Fresno Master Fee Schedule, Public Utilities Department (Amendment #590, all fees effective 07/01/2026)). Accessed 2026-10-04.
- City of Houston, Houston Public Works (Houston Water). Water rate schedule (2026 Water & Wastewater Rates (City of Houston)). Accessed 2026-10-07.
- Las Vegas Valley Water District (LVVWD), with Southern Nevada Water Authority (SNWA) charges. Water rate schedule (Water rates | Las Vegas Valley Water District). Accessed 2026-10-07.
- Los Angeles Department of Water and Power (LADWP). Water rate schedule (Schedule A - Residential (LADWP)). Accessed 2026-10-04.
- Miami-Dade Water and Sewer Department (WASD), retail. Water rate schedule (Rates, Fees and Charges (WASD)). Accessed 2026-10-04.
- Metro Water Services (Metropolitan Government of Nashville and Davidson County). Water rate schedule (Water, Sewer and Stormwater Rates (Metro Water Services)). Accessed 2026-10-04.
- Sewerage and Water Board of New Orleans (SWBNO). Water rate schedule (Rates, Fees & Charges (SWBNO)). Accessed 2026-10-04.
- City of Oklahoma City Utilities Department. Water rate schedule (Utilities Rates & Fees | City of OKC). Accessed 2026-10-04.
- Orlando Utilities Commission (OUC). Water rate schedule (OUC Service Rates & Costs). Accessed 2026-10-04.
- City of Phoenix Water Services Department. Water rate schedule (Water and Sewer Rates | City of Phoenix). Accessed 2026-10-04.
- City of Raleigh, Raleigh Water (Public Utilities). Water rate schedule (Public Utilities Rates, Effective July 1, 2026). Accessed 2026-10-04.
- Riverside Public Utilities (City of Riverside). Water rate schedule (Schedule WA-1A Single-Family Residential Metered Service). Accessed 2026-10-04.
- City of Sacramento Department of Utilities. Water rate schedule (Exhibit A Water Service Fees and Charges (rates effective July 1, 2016 to July 1, 2019)). Accessed 2026-10-07.
- Salt Lake City Department of Public Utilities. Water rate schedule (FY27 Rates | Public Utilities). Accessed 2026-10-04.
- San Antonio Water System (SAWS). Water rate schedule (Residential Water & Sewer Rates - SAWS). Accessed 2026-10-04.
- City of San Diego Public Utilities Department. Water rate schedule (Water Billing Rates (City of San Diego)). Accessed 2026-10-04.
- City of Tampa Water Department (City of Tampa Utilities billing). Water rate schedule (Residential Water and Wastewater Rate Schedule, Effective October 1, 2026). Accessed 2026-10-04.
- Tucson Water (City of Tucson). Water rate schedule (Residential Water Bill | City of Tucson). Accessed 2026-10-04.
Related pool research
Pool Season Length by City: Swim Season Index for 60 US Metros (NOAA 1991-2020 Normals)
Cost to Fill a Pool in 25 US Cities: Water and Sewer Rate Ledger, October 2026
Does a Pool Use More Water Than a Lawn? Pool vs Lawn Water Use in 25 US Cities
Pool Hurricane Preparation: Code Rules, Screen Enclosure Standards and Storm Exposure by State, 2026
Pool filling restrictions in 2026: which water utilities ban filling pools during drought
Pool Contractors Per Capita: A 2026 Metro Saturation Index
All pool industry research (43 reports)