Pool Removal Statistics: Permit Counts for US Cities, 2015 to 2026
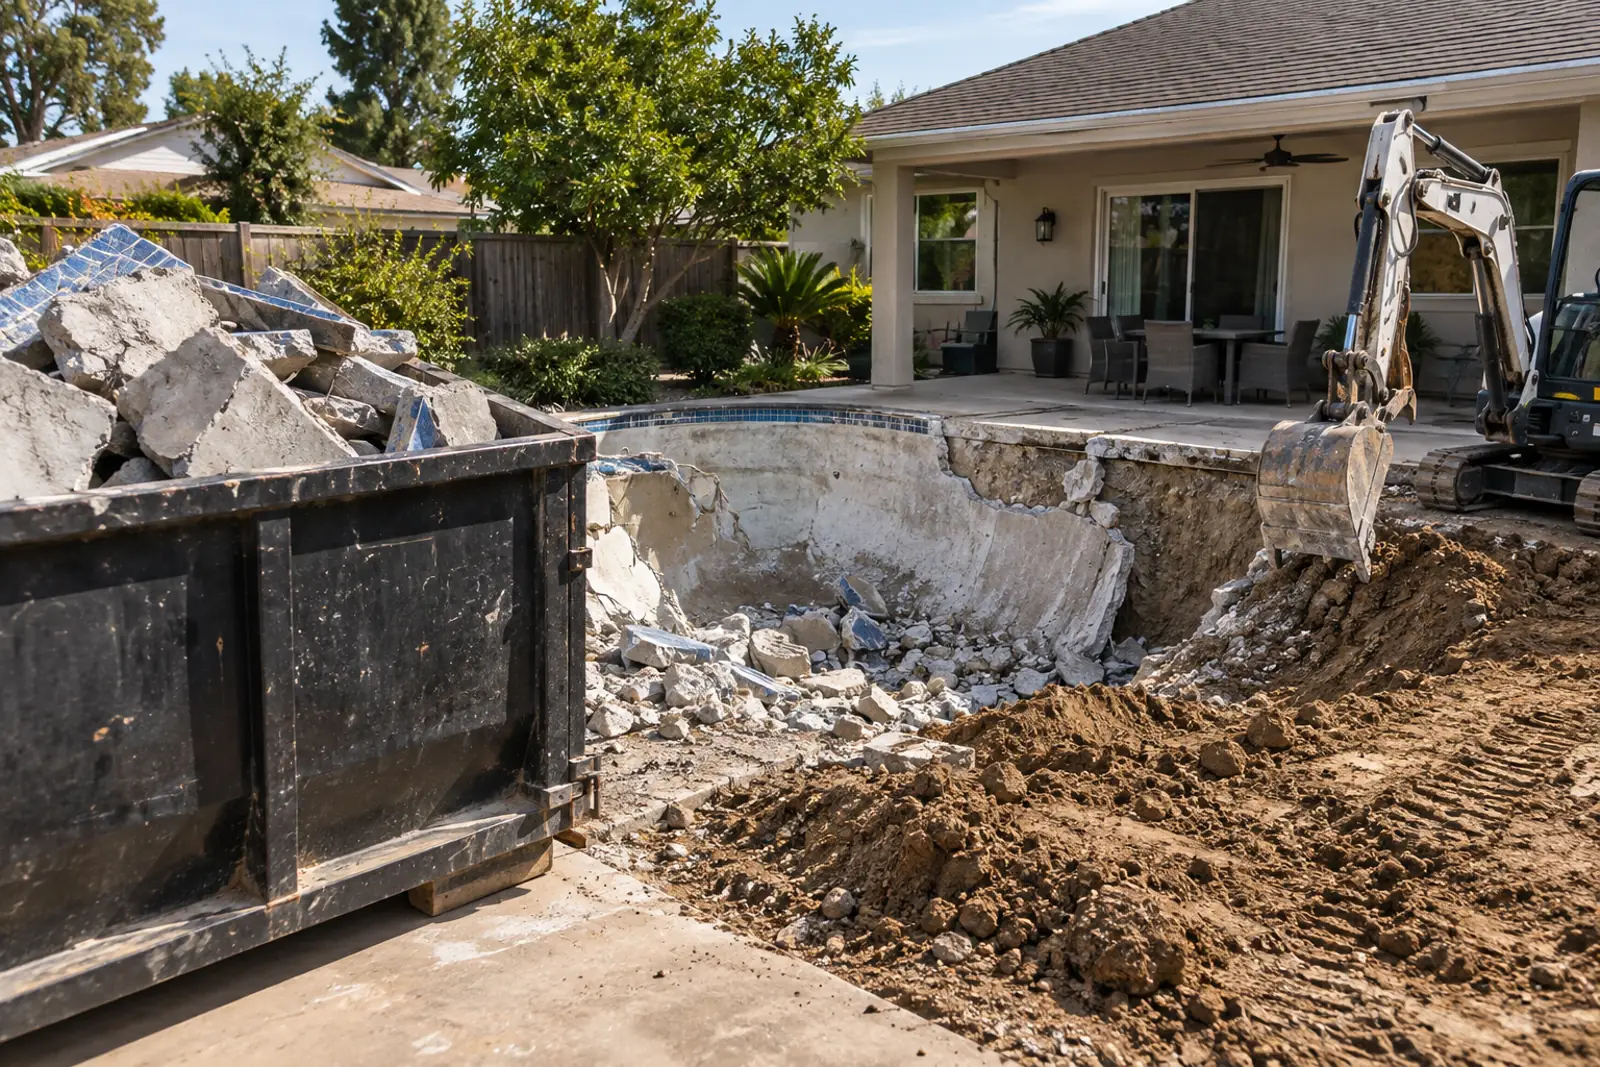
Pool removal statistics from city permit records show removals rising: Los Angeles, San Diego and Austin issued 545 residential pool removal permits in 2025, up 33.6% from 408 in 2019. Excluding Pacific Palisades ZIP 90272, hit by the January 2025 wildfire, the rise is 24.4%. That is 27.6 removals per 100 new pool permits.
How we built the dataset
- Pulled every permit record whose description contains the word pool, in all permit types, from 13 open-data portals (Socrata SoQL, ArcGIS REST, CKAN CSV), issued from 1 January 2015; pulls dated 2026-10-06 (San Diego and Raleigh extracts 2026-10-03).
- Classified each description with a documented regular-expression classifier (scripts/classify.py) into removal, remove-and-replace, partial, or other.
- Kept residential records (by permit class where published, otherwise by excluding non-residential site words) and dropped trade-only permits.
- Deduplicated permits at the same normalised address within 365 days.
- Hand-checked a random 100-row sample of counted removals for precision and a random 100-row sample of non-matches for misses.
- Compared removals with new residential pool permits counted by the sibling PC&S report from the same datasets.
- Opened official rule pages (LADBS, San Diego, Maricopa County, Austin) and rebate pages for context; used Tier 2 and Tier 3 sources only for cost and home value context.
Included: Residential permits that demolish, remove, backfill, fill in, infill, bury or abandon an existing in-ground pool, with no new pool on the same permit, issued 2015 to August 2026.
Excluded: Remove-and-replace and partial fills (reported separately), cesspools, spas only, pool equipment, decks, fences, enclosures, pool houses, trade permits, non-residential sites, Las Vegas and San Antonio (no usable description), Mesa after 2017 (recording break).
Conflicting numbers: No two sources publish competing removal counts. The AMWUA Maricopa County ratio (2006 to 2013) is older, unsourced and from a different area, so it is shown as context only. Angi’s cost ranges are not reconciled with permit data, which hold no reliable costs.
Derived metrics: All changes, ratios and shares are computed in scripts/analyze.py and scripts/make_facts.py from raw extracts in raw/; each derived figure has a row in derived.csv with its formula and input fact rows.
Caveats
- Permits measure filings, not completed removals, and miss unpermitted work.
- Only three cities have continuous, descriptive records; the rest are listed but carry little weight.
- Classifier precision was 96 of 100 in a hand check; small errors remain in both directions.
- Los Angeles 2025 includes wildfire-related demolitions concentrated in ZIP 90272.
- The latest months of 2026 can still change as records post.
Method last reviewed October 6, 2026.
The short version
- Los Angeles issued 392 residential pool removal permits in 2025, up 24.1% from 316 in 2019 (LADBS permit data).
- San Diego issued 84 pool demolition permits in 2025, up 27.3% from 66 in 2019; its peak was 91 in 2024 (San Diego DSD permit data).
- Austin issued 69 pool demolition permits in 2025, up 165.4% from 26 in 2019 (City of Austin permit data).
- In 2025 the three cities issued 27.6 pool removal permits for every 100 new pool permits, the highest ratio since at least 2015 (PC&S new pool permit counts).
- Pacific Palisades (ZIP 90272) accounted for 61 Los Angeles pool removals in 2025, against 7 in 2024; outside that ZIP, Los Angeles removals rose 11.4% from 2019 to 2025 (LADBS permit data).
- From January to August 2026 the three cities issued 377 removal permits, 3.3% more than the 365 issued in the same months of 2025.
- In Los Angeles, 27.7% of 2015 to 2025 pool backfill permits that stated a method left the shell in place; the rest removed it (LADBS rules).
What the permit data shows
- Los Angeles, San Diego and Austin issued 4,481 residential pool removal permits from 2015 to 2025 (LADBS permit data, San Diego DSD permit data and City of Austin permit data).
- Excluding Los Angeles ZIP 90272 (Pacific Palisades, burned in January 2025) in both years, the three cities issued 484 pool removal permits in 2025 against 389 in 2019, a 24.4% increase (PC&S analysis of Los Angeles, San Diego and Austin permit data).
- The three-city total fell to 287 in 2020, then rose to 431 in 2024 and 545 in 2025, a 26.5% one-year jump.
- Los Angeles pool removal permits fell to 211 in 2020, the lowest since at least 2015, and reached 392 in 2025, the highest (LADBS permit data).
- Austin pool demolition permits rose from 25 in 2023 to 43 in 2024 and 69 in 2025 (City of Austin permit data).
- Austin issued 68 pool demolition permits from January to August 2026, 74.4% more than the 39 in the same months of 2025 (City of Austin permit data).
- Los Angeles pool removal permits fell 10.4% in January to August 2026 (240) compared with the same months of 2025 (268) (LADBS permit data).
- From 2015 to 2025, Los Angeles issued 21.7 pool removal permits per 100 new pool permits and San Diego 19.7 (PC&S new pool permit counts).
- In 2025, Los Angeles issued 35.9 removals per 100 new pool permits, up from 22 in 2019; San Diego rose from 19.5 to 36.2.
- The three-city ratio bottomed at 10.3 removals per 100 new pool permits in 2021, when new pool permits peaked at 3,516.
- Remove-and-replace permits, where an old pool is taken out and a new one built, added 577 permits in the three cities from 2015 to 2025, about 12.9 for every 100 pure removals.
- Only 1.7% of core-city pool removal permits from 2015 to 2025 also demolished the house on the same permit.
- Pool removal permits in the three cities showed little seasonality from 2015 to 2025: each quarter held between 24.1% and 26.3% of the total.
- Los Angeles permits citing the 2025 wildfires or Executive Order 1 accounted for 66 pool removals from January 2025 to August 2026 (LADBS permit data).
- The keyword classifier was correct on 96 of 100 hand-checked removal permits drawn at random from the final count.
How we counted pool removal permits in city open data
No public agency publishes a count of pool removals, so this report builds one from permit records. We pulled every permit whose description mentions a pool, in any permit type, from 13 city and county open-data portals, then classified each description.
The pull covered 134,925 permit records that mention a pool, issued from January 2015 to early October 2026, across 13 jurisdictions. Pool removals are rarely filed under a pool permit type: Los Angeles files them as grading permits for backfill, San Diego as Demolition/Removal permits, and Austin as residential demolition building permits.
- Counted as a removal: the description demolishes, removes, backfills, fills in, infills, buries or abandons an existing pool, and the same permit builds no new pool.
- Counted separately: remove-and-replace permits (old pool out, new pool in) and partial fills that shrink or reshape a pool.
- Excluded: cesspools, spas only, pool equipment, decks, fences, pool houses, trade permits (electrical, plumbing, mechanical), apartment, hotel, school and other non-residential sites.
- Deduplicated: a second removal permit at the same normalised address within 365 days is the same project (the rule used in the sibling new-pool report).
- Dated by permit issue date (Fort Worth: application date, the only date it publishes).
| city | publisher | dataset | url | permit_types_where_removals_appear | date_field | years_comparable | coverage_status | pool_mention_records_scanned | removal_permits_counted | notes |
|---|---|---|---|---|---|---|---|---|---|---|
| Los Angeles, CA | LA Department of Building and Safety | Building Permits Issued 2010 to 2019 and 2020 to Present | https://data.lacity.org/d/pi9x-tg5x | Grading permits to backfill a pool; some Bldg-Demolition permits | issue_date | 2015 to Aug 2026 | core | 45798 | 3663 | LADBS requires a grading permit for every pool backfill (IB P/BC 2026-111). |
| San Diego, CA | City of San Diego Development Services | Development permits, approvals issued file | https://data.sandiego.gov/datasets/development-permits-set2/ | Demolition/Removal permits (approval types Demolition Permit and Construction Demolition) | APPROVAL_ISSUE_DATE | 2015 to Aug 2026 | core | 6729 | 816 | Fewer than 10 removals a year; reflects recording practice more than behaviour. |
| Austin, TX | City of Austin | Issued Construction Permits (3syk-w9eu) | https://data.austintexas.gov/d/3syk-w9eu | Building permits, class R- 649 Demolition All Other Bldgs Res | issue_date | 2015 to Aug 2026 | core | 27691 | 379 | Fewer than 10 removals a year; reflects recording practice more than behaviour. |
| Orlando, FL | City of Orlando | Permit Applications (ryhf-m453) | https://data.cityoforlando.net/d/ryhf-m453 | Demolition, building and engineering permits naming a pool | issue_permit_date | 2015 to Aug 2026 | low count | 7312 | 36 | Only a short project-name field is searchable. |
| Mesa, AZ | City of Mesa | Building Permits (dzpk-hxfb) | https://citydata.mesaaz.gov/d/dzpk-hxfb | Residential (RES) permits | issued_date | 2015 to 2017 only | break after 2017 | 8700 | 109 | Pool demolition descriptions nearly vanish after 2017 (2 in 2018, 0 in 2019); 2018 onward not comparable. |
| Cape Coral, FL | City of Cape Coral | Building Permits (OpenData layer 1) | https://capeims.capecoral.gov/arcgis/rest/services/OpenData/OpenData/MapServer/1 | DS Full Demolition and Building Miscellaneous Demo permits | issuedate | 2025 to Aug 2026 | partial coverage | 9518 | 50 | Layer starts 2 January 2025. |
| New Orleans, LA | City of New Orleans | Permits (rcm3-fn58) | https://data.nola.gov/d/rcm3-fn58 | Demolition and swimming pool permits | issuedate | 2015 to Aug 2026 | low count | 5814 | 15 | Fewer than 10 removals a year; reflects recording practice more than behaviour. |
| Raleigh, NC | City of Raleigh | Building Permits (ArcGIS) | https://services.arcgis.com/v400IkDOw1ad7Yad/arcgis/rest/services/Building_Permits/FeatureServer/0 | Demolition and alteration permits | issueddate | 2015 to Aug 2026 | low count | 1565 | 8 | Fewer than 10 removals a year; reflects recording practice more than behaviour. |
| Montgomery County, MD | Montgomery County Government | Residential Permit (m88u-pqki) | https://data.montgomerycountymd.gov/d/m88u-pqki | Alteration and addition permits | issueddate | 2015 to Aug 2026 | low count | 1966 | 5 | Fewer than 10 removals a year; reflects recording practice more than behaviour. |
| Fort Worth, TX | City of Fort Worth | Development Permits (ArcGIS view) | https://services5.arcgis.com/3ddLCBXe1bRt7mzj/arcgis/rest/services/CFW_Open_Data_Development_Permits_View/FeatureServer/0 | Residential accessory structure permits | File_Date (application) | 2015 to Aug 2026 | low count | 8314 | 4 | No issue date published; dated by application filing. |
| Nashville-Davidson, TN | Metro Nashville and Davidson County | Building Permits Issued (ArcGIS) | https://services2.arcgis.com/HdTo6HJqh92wn4D8/arcgis/rest/services/Building_Permits_Issued_2/FeatureServer/0 | Building Demolition Permits | Date_Issued | Oct 2023 to Aug 2026 | partial coverage | 1333 | 10 | Layer starts 28 September 2023. |
| East Baton Rouge Parish, LA | City of Baton Rouge / Parish of East Baton Rouge | EBR Building Permits (7fq7-8j7r) | https://data.brla.gov/d/7fq7-8j7r | Demolition Permit (R) | issueddate | 2015 to Aug 2026 | low count | 2834 | 1 | Fewer than 10 removals a year; reflects recording practice more than behaviour. |
| San Antonio, TX | City of San Antonio | Building Permits: Permits Issued (CKAN CSV) | https://data.sanantonio.gov/dataset/building-permits | None identifiable | DATE ISSUED | none | excluded | 7351 | 0 | Only a short project name is published; no pool removal could be identified. |
| Las Vegas, NV | City of Las Vegas | Building Permits (OpenData_Building_Permits_, ArcGIS) | https://services1.arcgis.com/F1v0ufATbBQScMtY/arcgis/rest/services/OpenData_Building_Permits_/FeatureServer/0 | None identifiable | ISSDTTM | none | excluded | 0 | 0 | No work description is published, so removals cannot be separated from other pool permits. |
Source: municipal open-data portals listed in the table; PC&S classification. Download CSV
Pool removal statistics by city and year, 2015 to 2026
All three cities with continuous records issued more pool removal permits in 2025 than in 2019. Los Angeles is the largest by volume, Austin is growing fastest, and San Diego peaked in 2024.
Source: PC&S analysis of LADBS, City of San Diego and City of Austin permit open data, pulled 2026-10-06. Download chart data (CSV)
Los Angeles issued between 315 and 340 pool removal permits a year from 2015 to 2019. Issuance fell to 211 in 2020, the lowest year in the series, and reached 392 in 2025 (LADBS permit data).
San Diego issued 43 pool demolition permits in 2021 and 91 in 2024 (San Diego DSD permit data). Austin issued 14 in 2017 and 69 in 2025 (City of Austin permit data).
| city | 2015 | 2016 | 2017 | 2018 | 2019 | 2020 | 2021 | 2022 | 2023 | 2024 | 2025 | jan_aug_2025 | jan_aug_2026 | total_2015_aug_2026 | coverage | years_comparable |
|---|---|---|---|---|---|---|---|---|---|---|---|---|---|---|---|---|
| Los Angeles, CA | 340 | 315 | 334 | 340 | 316 | 211 | 290 | 301 | 287 | 297 | 392 | 268 | 240 | 3663 | core | 2015 to Aug 2026 |
| San Diego, CA | 69 | 57 | 69 | 75 | 66 | 52 | 43 | 66 | 75 | 91 | 84 | 58 | 69 | 816 | core | 2015 to Aug 2026 |
| Austin, TX | 20 | 15 | 14 | 20 | 26 | 24 | 29 | 26 | 25 | 43 | 69 | 39 | 68 | 379 | core | 2015 to Aug 2026 |
| Orlando, FL | 0 | 3 | 1 | 3 | 2 | 3 | 3 | 0 | 4 | 4 | 6 | 5 | 7 | 36 | low count | 2015 to Aug 2026 |
| Mesa, AZ | 31 | 47 | 23 | 109 | break after 2017 | 2015 to 2017 only | ||||||||||
| Cape Coral, FL | 28 | 19 | 22 | 50 | partial coverage | 2025 to Aug 2026 | ||||||||||
| New Orleans, LA | 3 | 2 | 1 | 0 | 3 | 0 | 3 | 0 | 0 | 0 | 1 | 1 | 2 | 15 | low count | 2015 to Aug 2026 |
| Raleigh, NC | 1 | 0 | 3 | 0 | 0 | 0 | 1 | 0 | 1 | 1 | 1 | 1 | 0 | 8 | low count | 2015 to Aug 2026 |
| Montgomery County, MD | 0 | 0 | 0 | 0 | 0 | 1 | 0 | 1 | 0 | 2 | 0 | 0 | 1 | 5 | low count | 2015 to Aug 2026 |
| Fort Worth, TX | 0 | 0 | 0 | 0 | 0 | 0 | 0 | 1 | 0 | 1 | 2 | 0 | 0 | 4 | low count | 2015 to Aug 2026 |
| Nashville-Davidson, TN | 3 | 4 | 0 | 3 | 10 | partial coverage | Oct 2023 to Aug 2026 | |||||||||
| East Baton Rouge Parish, LA | 0 | 0 | 0 | 0 | 0 | 0 | 0 | 0 | 0 | 1 | 0 | 0 | 0 | 1 | low count | 2015 to Aug 2026 |
Source: PC&S analysis of municipal permit open data (LADBS permit data, San Diego DSD permit data, City of Austin permit data and others in the methods table). Download CSV
Pool removals per 100 new pool permits
Comparing removals with new pool permits from the same city records shows how close each market is to replacing the pools it loses. In Los Angeles, San Diego and Austin combined the ratio rose from 10.3 in 2021 to 27.6 in 2025 because new pool permits fell while removals rose.
Low ratios in small-count cities mostly reflect how removals are recorded, not how often pools are removed.
Source: PC&S removal counts and PC&S new pool permit counts from the same municipal datasets. Download chart data (CSV)
| city | years_compared | removals | new_pool_permits | removals_per_100_new_pools | removals_2019 | new_pools_2019 | per_100_2019 | removals_2025 | new_pools_2025 | per_100_2025 |
|---|---|---|---|---|---|---|---|---|---|---|
| Los Angeles, CA | 2015 to 2025 | 3423 | 15766 | 21.7 | 316 | 1434 | 22.0 | 392 | 1093 | 35.9 |
| San Diego, CA | 2015 to 2025 | 747 | 3790 | 19.7 | 66 | 339 | 19.5 | 84 | 232 | 36.2 |
| Mesa, AZ | 2015 to 2017 | 101 | 1630 | 6.2 | ||||||
| Austin, TX | 2015 to 2025 | 311 | 6983 | 4.5 | 26 | 527 | 4.9 | 69 | 648 | 10.6 |
| Cape Coral, FL | 2025 | 28 | 1229 | 2.3 | 28 | 1229 | 2.3 | |||
| Nashville-Davidson, TN | 2024 to 2025 | 7 | 477 | 1.5 | 4 | 248 | 1.6 | |||
| Orlando, FL | 2015 to 2025 | 29 | 3408 | 0.9 | 2 | 274 | 0.7 | 6 | 259 | 2.3 |
| New Orleans, LA | 2015 to 2025 | 13 | 2040 | 0.6 | 3 | 154 | 1.9 | 1 | 155 | 0.6 |
| Raleigh, NC | 2018 to 2025 | 4 | 734 | 0.5 | 0 | 45 | 0.0 | 1 | 122 | 0.8 |
| Montgomery County, MD | 2015 to 2025 | 4 | 890 | 0.4 | 0 | 68 | 0.0 | 0 | 111 | 0.0 |
| Fort Worth, TX | 2015 to 2025 | 4 | 6037 | 0.1 | 0 | 477 | 0.0 | 2 | 408 | 0.5 |
| East Baton Rouge Parish, LA | 2015 to 2024 | 1 | 2044 | 0.0 | 0 | 153 | 0.0 |
Source: PC&S removal counts; new pool permits from PC&S new pool permit counts (same municipal datasets). Download CSV
Source: PC&S analysis of LADBS, City of San Diego and City of Austin permit open data. Download chart data (CSV)
The three-city ratio was 21 in 2015 and 17.7 in 2019. It fell to 10.3 in 2021, when the three cities issued 3,516 new pool permits, and rose to 27.6 in 2025, when they issued 1,973 (PC&S new pool permit counts).
For comparison, the Arizona Municipal Water Users Association reported in 2016 that 3 residential pools were removed for every 5 built in Maricopa County from 2006 to 2013, equal to 60 per 100. AMWUA did not name the study, so the figure is context only.
Peak years, the 2025 vs 2019 change and the Palisades effect
2025 was the peak year for Los Angeles, Austin and the three-city total. Part of the Los Angeles jump sits in ZIP 90272, Pacific Palisades, where the January 2025 Palisades fire struck, but removals elsewhere in Los Angeles also rose.
| city | removals_2019 | removals_2025 | change_2019_to_2025_pct | peak_year_2015_2025 | peak_count | low_year_2015_2025 | low_count |
|---|---|---|---|---|---|---|---|
| Los Angeles, CA | 316 | 392 | 24.1 | 2025 | 392 | 2020 | 211 |
| San Diego, CA | 66 | 84 | 27.3 | 2024 | 91 | 2021 | 43 |
| Austin, TX | 26 | 69 | 165.4 | 2025 | 69 | 2017 | 14 |
| Orlando, FL | 2 | 6 | 200.0 | 2025 | 6 | 2015 | 0 |
| Core three combined | 408 | 545 | 33.6 | 2025 | 545 | 2020 | 287 |
Source: PC&S analysis of municipal permit open data. Download CSV
2026 covers January to August only.
Source: PC&S analysis of LADBS permit open data (ZIP from permit record). Download chart data (CSV)
ZIP 90272 (Pacific Palisades) recorded 7 pool removal permits in 2024 and 61 in 2025, 8.7 times as many, or 15.6% of the Los Angeles total in 2025 (LADBS permit data). The city lists its Palisades permitting support center in ZIP 90272 (LA Strong: Return and Rebuild). It recorded 35 from January to August 2026.
Outside ZIP 90272, Los Angeles issued 297 removal permits in 2019 and 331 in 2025, up 11.4%. The Mayor’s Emergency Executive Order No. 1 of 13 January 2025 set expedited rules for rebuilding after the Palisades, Hurst, Kenneth, Archer and Sunset fires; 66 pool removal permits from January 2025 to August 2026 cite the wildfires or the order in their description.
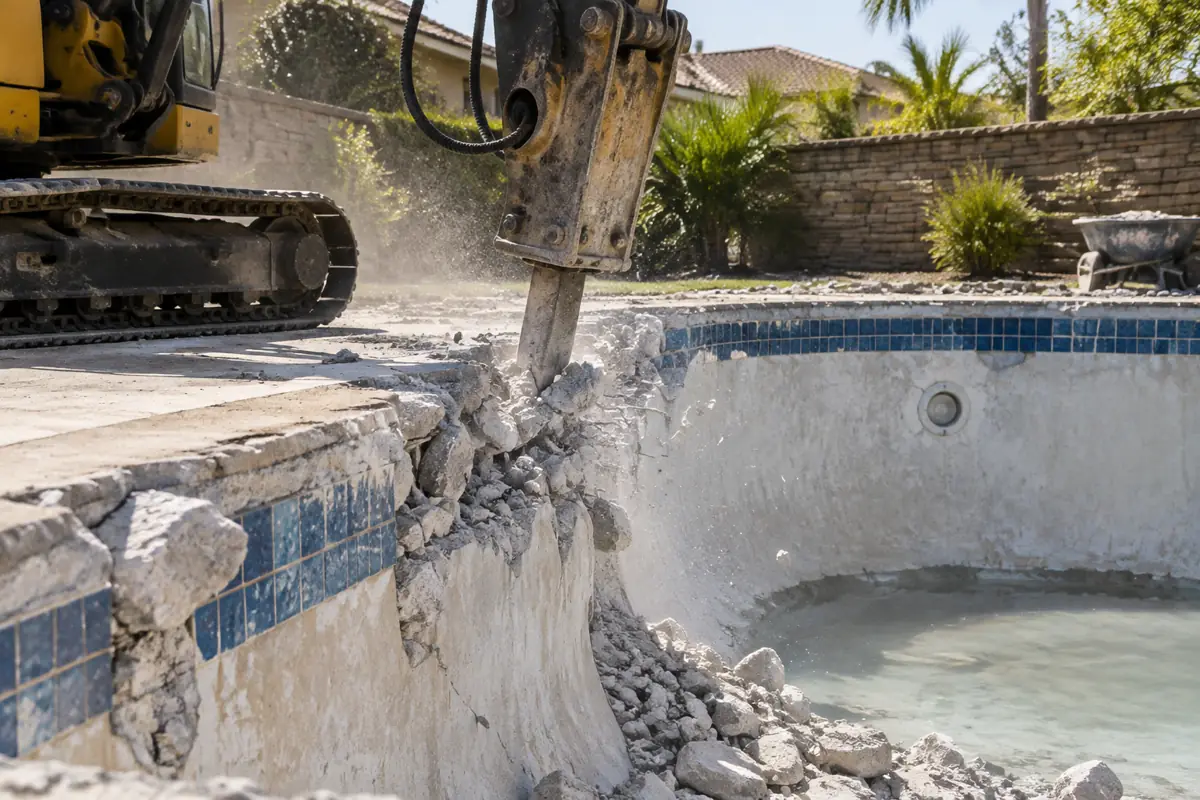
Pool removals in 2026 so far: January to August vs the same months of 2025
The three-city total is slightly ahead of 2025, but the cities are moving in different directions. Austin is well ahead, San Diego is up, and Los Angeles is down from its post-fire 2025 level.
| city | removals_jan_aug_2025 | removals_jan_aug_2026 | change_pct | new_pool_permits_jan_aug_2025 | new_pool_permits_jan_aug_2026 | per_100_new_jan_aug_2026 |
|---|---|---|---|---|---|---|
| Los Angeles, CA | 268 | 240 | -10.4 | 725 | 825 | 29.1 |
| San Diego, CA | 58 | 69 | 19.0 | 149 | 157 | 43.9 |
| Austin, TX | 39 | 68 | 74.4 | 438 | 476 | 14.3 |
| Orlando, FL | 5 | 7 | 40.0 | 181 | 188 | 3.7 |
| Cape Coral, FL | 19 | 22 | 15.8 | 812 | 807 | 2.7 |
| Nashville-Davidson, TN | 0 | 3 | 161 | 196 | 1.5 | |
| Core three combined | 365 | 377 | 3.3 | 1312 | 1458 | 25.9 |
Source: PC&S analysis of municipal permit open data; new pool permits from PC&S new pool permit counts. Download CSV
San Diego issued 69 pool demolition permits from January to August 2026, against 58 a year earlier (San Diego DSD permit data). Cape Coral, FL issued 22, against 19 (City of Cape Coral permit data).
When pool removals happen: seasonality by month
Pool removal permits in Los Angeles, San Diego and Austin are spread almost evenly across the year. There is no clear autumn spike after the swimming season.
Source: PC&S analysis of municipal permit open data; new pool shares from PC&S Pool Construction Statistics (2019 to 2025, ten jurisdictions). Download chart data (CSV)
From 2015 to 2025, May held 9.4% of removal permits in the three cities and November 7.7%. January to March held 25.2%, April to June 26.3%, July to September 24.5% and October to December 24.1%.
New pool permits follow a similar flat pattern in the PC&S new pool permit series: 9% in May and 7.2% in November (ten jurisdictions, 2019 to 2025).
Fill in or remove completely: what Los Angeles permits show
Los Angeles is the one city whose permits state the backfill method. About seven in ten backfills that state a method remove the shell and use compacted structural fill; the rest leave the shell in place.
| year | shell_removed | shell_left_in_place | method_not_stated | share_left_in_place_of_stated_pct |
|---|---|---|---|---|
| 2015 | 198 | 92 | 50 | 31.7 |
| 2016 | 198 | 89 | 28 | 31.0 |
| 2017 | 214 | 80 | 40 | 27.2 |
| 2018 | 211 | 93 | 36 | 30.6 |
| 2019 | 187 | 92 | 37 | 33.0 |
| 2020 | 137 | 50 | 24 | 26.7 |
| 2021 | 193 | 58 | 39 | 23.1 |
| 2022 | 197 | 49 | 55 | 19.9 |
| 2023 | 178 | 61 | 48 | 25.5 |
| 2024 | 179 | 74 | 44 | 29.2 |
| 2025 | 252 | 84 | 56 | 25.0 |
| 2015 to 2025 | 2144 | 822 | 457 | 27.7 |
Source: PC&S analysis of LADBS permit data; method read from the permit description. Download CSV
Source: PC&S analysis of LADBS permit open data; method read from the permit work description. Download chart data (CSV)
From 2015 to 2025, 2,144 Los Angeles backfill permits removed the shell and 822 left it in place; 457 did not say. The shell-left share of stated methods was 31.7% in 2015, 19.9% in 2022 and 25% in 2025.
Under LADBS Information Bulletin P/BC 2026-111, both methods need a grading permit. Structural fill must reach 90% relative compaction and the shell must be removed from the site. A shell left in place with uncertified fill is limited to landscaping, needs drainage holes at least 12 inches wide no more than 8 feet apart, and is not allowed on ground steeper than 10%.
Maricopa County directive DD-5015-01 (adopted 21 November 2025) sets 3 methods for the county permitting area: full removal, partial removal and abandon in place. Abandoning a pool in place bars any new building or structure over or within 5 feet of it.
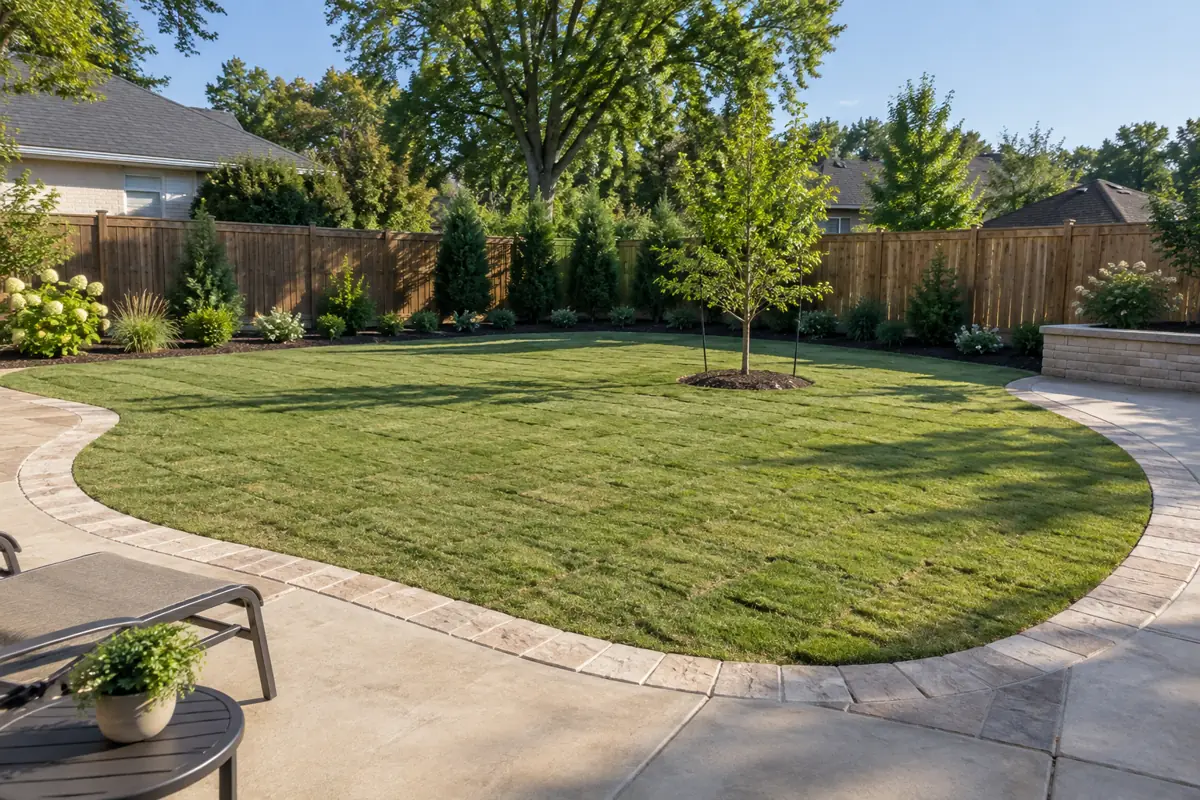
Permits, rebates, cost and home value context
Permit records show that cities require a permit to remove a pool and that some water utilities pay homeowners to do it. They do not record what removal costs or what it does to a home price, so those answers rely on secondary sources and carry wider uncertainty.
- Los Angeles: a grading permit is required for any pool backfill (LADBS P/BC 2026-111).
- San Diego: a Demolition/Removal Permit is required; a soils compaction report is required at final inspection for pools deeper than 5 feet (City of San Diego IB 710, September 2026).
- Austin: pool demolitions appear in the city data as residential demolition building permits (class R- 649) (City of Austin demolition permit process).
- Maricopa County, AZ: every one of the 3 demolition methods needs a demolition permit (DD-5015-01).
- Scottsdale, AZ: Scottsdale Water lists a pool removal rebate of up to $1,500 with an application deadline of 30 April 2027; a pool already removed is not eligible (City of Scottsdale).
Angi (page updated 8 July 2026) puts the average pool removal at $6,000, full demolition at $4,000 to $16,000 and a partial fill-in at $2,500 to $10,000, with permits around $200. These are marketplace estimates without a published method, not permit data.
Realtor.com Economic Research found listed homes with a pool priced 21.2% ($43) more per square foot than homes without in April 2025, down from a pandemic peak. That is an association across different homes, not the effect of removing a pool from a given home.
What pool removal permit counts cannot tell you
The counts are a floor for permitted removals in three cities, not a national total. Several gaps push in different directions.
- Unpermitted removals, and removals filed with no pool word in the description, are not counted.
- Text-based classification makes errors: a hand check found 4 false positives in 100 counted permits.
- The three core cities are Sun Belt and West Coast markets; they do not represent colder states where seasonal pools are more common.
- Removal and new-pool counts come from the same datasets but use different classifiers, so the ratio is indicative.
- The Los Angeles 2025 total includes fire-related demolitions; compare the ZIP 90272 split before reading it as a demand trend.
- For the national stock of pools see number of swimming pools in the US and percentage of homes with pools.
Measures we built from the data
Removals per city per year and trend
Is pool removal rising in the cities with continuous permit data?
Count of deduplicated residential removal permits by city and issue year; change = (2025 - 2019) / 2019 x 100Inputs: fact rows #303, #309 and city rows in derived.csv D1 to D5
Limitations: Three cities; permits not completed work; the Los Angeles 2025 figure includes wildfire-related removals.
Removals per 100 new pool permits
How many pools are removed for every 100 new pools permitted?
removal permits / new residential pool permits (sibling PC&S count) x 100, same city and yearsInputs: fact rows #312, #445, #309, #444
Limitations: Numerator and denominator use different classifiers; remove-and-replace permits sit in neither.
Peak year and 2025 vs 2019
Which year was the peak, and how does 2025 compare with the pre-pandemic baseline?
argmax of annual counts 2015 to 2025; (2025 - 2019) / 2019 x 100Inputs: fact rows #37, #50, #65, #330, #342
Limitations: Single-year comparisons are sensitive to administrative timing.
Seasonality of removals
Do pool removals cluster after the swimming season?
share of 2015 to 2025 removal permits by issue month and quarterInputs: fact rows #517 to #550
Limitations: Issue month is not the month the work happens; mild-climate cities dominate the sample.
Shell left in place vs removed (Los Angeles)
How often do homeowners fill in a pool rather than remove it?
shell-left permits / (shell-left + shell-removed permits) x 100Inputs: fact rows #380, #379
Limitations: Los Angeles only; 457 permits did not state a method.
Latest data in this edition
- First edition. Permit data pulled 2026-10-06; January to August 2026 compared with the same months of 2025 (377 vs 365 in the three core cities).
- LADBS revised its pool backfill bulletin P/BC 2026-111 on 2 June 2026 (effective 1 January 2026); both backfill methods still need a grading permit (LADBS).
- Maricopa County, AZ adopted directive DD-5015-01 on 21 November 2025, defining 3 permitted pool demolition methods (Maricopa County).
- Los Angeles Emergency Executive Order No. 1 (13 January 2025) set expedited rebuilding rules after the January 2025 wildfires; Palisades pool removals rose to 61 that year (Office of the Mayor).
Quick answers
How much does it cost to remove a pool?
Angi (updated 8 July 2026) reports an average of $6,000, $4,000 to $16,000 for full demolition and $2,500 to $10,000 for a partial fill-in, nationally. Permit records do not hold reliable job costs. In Scottsdale, AZ a water rebate of up to $1,500 can offset part of the cost (City of Scottsdale).
Are people filling in their pools?
Yes, more than before the pandemic in the cities measured. Los Angeles, San Diego and Austin issued 545 pool removal permits in 2025, up 33.6% from 408 in 2019, and 377 from January to August 2026 (LADBS permit data, San Diego DSD permit data and City of Austin permit data).
Does removing a pool hurt home value?
No public dataset measures it directly. Realtor.com found listed homes with a pool priced 21.2% more per square foot than homes without in April 2025, but those are different homes, so the gap is not the value lost by removing a pool. The backfill method also limits later use: in Los Angeles an area filled over a shell left in place is for landscaping only (LADBS).
Do you need a permit to remove a pool?
In the places checked, yes. Los Angeles requires a grading permit for any backfill (LADBS), San Diego a Demolition/Removal Permit (IB 710) and Maricopa County, AZ a demolition permit for all 3 methods (DD-5015-01).
Is it better to fill in a pool or remove it completely?
It depends on what the land will be used for. In Los Angeles a shell left in place with uncertified fill is limited to landscaping, while full removal with fill compacted to 90% can support footings (LADBS). 72.3% of Los Angeles backfill permits that stated a method from 2015 to 2025 removed the shell.
Questions and answers
How many pools are removed each year in Los Angeles?
LADBS issued 392 residential pool removal permits in 2025 and 316 in 2019 (LADBS permit data).
How many pools are removed each year in San Diego?
San Diego issued 84 residential pool demolition permits in 2025, after a peak of 91 in 2024 (San Diego DSD permit data).
How many pools are removed each year in Austin?
Austin issued 69 residential pool demolition permits in 2025, up from 26 in 2019 (City of Austin permit data).
Is pool removal increasing?
In the three cities with continuous data, yes: 545 removal permits in 2025 vs 408 in 2019, a 33.6% rise, and the highest total since at least 2015.
How many pools are removed for every new pool built?
In 2025, Los Angeles, San Diego and Austin issued 27.6 removal permits per 100 new pool permits, against 17.7 in 2019 (PC&S new pool permit counts).
Did the 2025 Los Angeles wildfires increase pool removals?
Yes in the Palisades: ZIP 90272 recorded 61 pool removal permits in 2025 vs 7 in 2024. Removals elsewhere in Los Angeles rose 11.4% from 2019 to 2025 (LADBS permit data).
Are pool removals up in 2026?
Slightly. The three cities issued 377 removal permits from January to August 2026, 3.3% more than the 365 in the same months of 2025; Austin was up 74.4% and Los Angeles down 10.4%.
What time of year are most pools removed?
There is no strong season. From 2015 to 2025 the busiest month, May, held 9.4% of removal permits in the three cities and the quietest, November, 7.7%.
How often is an old pool removed and replaced with a new one?
Los Angeles, San Diego and Austin issued 577 remove-and-replace permits from 2015 to 2025, about 12.9 for every 100 pure removal permits.
Do any cities pay homeowners to remove a pool?
Scottsdale Water in Scottsdale, AZ lists a pool removal rebate of up to $1,500, with applications open to 30 April 2027 (City of Scottsdale). AMWUA reported in 2016 that it was the first such rebate in Arizona (AMWUA).
Data, citation and press kit
Figures ready to quote
- Los Angeles, San Diego and Austin issued 545 residential pool removal permits in 2025, up 33.6% from 2019. (LA Department of Building and Safety)
- In 2025 the three cities issued 27.6 pool removal permits for every 100 new pool permits, up from 17.7 in 2019. (Pool Construction & Service)
- Los Angeles issued 392 pool removal permits in 2025, its highest count since at least 2015. (LA Department of Building and Safety)
- Pool removal permits in Pacific Palisades ZIP 90272 rose from 7 in 2024 to 61 in 2025. (LA Department of Building and Safety)
- Austin pool demolition permits rose 165.4% from 2019 to 2025, to 69. (City of Austin)
- From 2015 to 2025, 27.7% of Los Angeles pool backfill permits that stated a method left the pool shell in the ground. (LA Department of Building and Safety)
If you cite only a few sources
- Building and Safety: Building Permits Issued from 2020 to Present (N), LA Department of Building and Safety
- Development permits: approvals issued, City of San Diego Development Services
- Issued Construction Permits, City of Austin
- Information Bulletin P/BC 2026-111: Backfill of Swimming Pools, LA Department of Building and Safety
- Pool Construction Statistics (new pool permit counts by city), Pool Construction & Service
Summary for editors
Homeowners in three large Sun Belt and West Coast cities are removing more backyard pools. A PC&S count of city permit records finds that Los Angeles, San Diego and Austin issued 545 residential pool removal permits in 2025, up 33.6% from 408 in 2019 and the most since at least 2015. Austin rose fastest, from 26 to 69. In Los Angeles, removals in Pacific Palisades ZIP 90272 rose to 61 in 2025, the year of the January wildfires, but removals outside that ZIP were also up 11.4% on 2019. With new pool permits down from their 2021 peak, the three cities issued 27.6 removal permits for every 100 new pool permits in 2025, against 10.3 in 2021. From January to August 2026, removals ran 3.3% above the same months of 2025. The count classifies 134,925 pool-related permit records from 13 jurisdictions; a hand check found the classifier correct 96 times in 100.
Headlines the data supports
- Pool removal permits reach their highest level since at least 2015 in Los Angeles, San Diego and Austin
- For every 100 new pools, three big cities now permit 27.6 pool removals
- Austin pool demolitions up 165.4% since 2019, city permits show
- Pool removal permits in Pacific Palisades jumped from 7 to 61 in the year of the fire
- Seven in ten Los Angeles pool backfills take out the shell, permits show
How to cite this report
Pool Construction & Service. "Pool Removal Statistics: Permit Counts for US Cities, 2015 to 2026." PC&S Research Desk, October 6, 2026. https://poolconstructionandservice.com/research/pool-removal-statistics/
Reuse
The data tables and charts in this report are licensed under CC BY 4.0. Reuse them with this attribution: “Source: Pool Construction & Service (poolconstructionandservice.com), Pool Removal Statistics: Permit Counts for US Cities, 2015 to 2026.” Figures from third-party sources remain subject to their publishers’ terms.
Download the data
- Residential pool removal permits by city and year, 2015 to Aug 2026 CSV
- Pool removals per 100 new pool permits by city CSV
- Peak year and 2025 vs 2019 change by city CSV
- January to August 2026 vs 2025 pool removal permits CSV
- Los Angeles pool backfill permits by method, 2015 to 2025 CSV
- Sources, filters and coverage by city CSV
- Pool removal permits by month of issue, 2015 to 2025 CSV
- Full fact sheet with sources and limitations CSV
How we graded sources
Tier 1: primary and government sources (21)
- LA Department of Building and Safety: Building and Safety: Building Permits Issued from 2020 to Present (N)
- LA Department of Building and Safety: Building and Safety: Building Permits Issued Between 2010 and 2019 (N)
- City of San Diego Development Services: Development permits: approvals issued
- City of Austin: Issued Construction Permits
- City of Orlando: Permit Applications
- City of Mesa: Building Permits
- City of Cape Coral: Building Permits (OpenData layer 1)
- City of New Orleans: Permits
- City of Raleigh: Building Permits
- Montgomery County Government, MD: Residential Permit
- City of Fort Worth: Development Permits
- Metropolitan Government of Nashville and Davidson County: Building Permits Issued
- City of Baton Rouge / Parish of East Baton Rouge: EBR Building Permits
- LA Department of Building and Safety: Information Bulletin P/BC 2026-111: Backfill of Swimming Pools
- Office of the Mayor, City of Los Angeles: Emergency Executive Order No. 1: Expedited Community Rebuilding and Recovery (revised 18 March 2025)
- City of San Diego Development Services: Information Bulletin 710: Permit Instructions, Procedures for Building Demolition/Removal (September 2026)
- City of Austin Development Services: Demolition Permit
- Maricopa County Planning & Development: Pool and Spa Demolition, Directive DD-5015-01
- City of Scottsdale (Scottsdale Water): Water conservation rebates
- Pool Construction & Service: Pool Construction Statistics (new pool permit counts by city)
- City of Los Angeles: LA Strong: Return and Rebuild, Rebuilding
Tier 2: trade bodies, public companies, market research (2)
- Realtor.com Economic Research: Swimming Pools in the Housing Market: A Cooling Trend in Premium, but Still a Hot Commodity (21 May 2025)
- Arizona Municipal Water Users Association: Scottsdale Offers Arizona's First Pool Removal Rebate (29 Aug 2016)
Tier 3: journalism and expert commentary (1)
Sources
- LA Department of Building and Safety. Building and Safety: Building Permits Issued from 2020 to Present (N). Accessed 2026-10-06.
- LA Department of Building and Safety. Building and Safety: Building Permits Issued Between 2010 and 2019 (N). Accessed 2026-10-06.
- City of San Diego Development Services. Development permits: approvals issued. Accessed 2026-10-03.
- City of Austin. Issued Construction Permits. Accessed 2026-10-06.
- City of Orlando. Permit Applications. Accessed 2026-10-06.
- City of Mesa. Building Permits. Accessed 2026-10-06.
- City of Cape Coral. Building Permits (OpenData layer 1). Accessed 2026-10-06.
- City of New Orleans. Permits. Accessed 2026-10-06.
- City of Raleigh. Building Permits. Accessed 2026-10-03.
- Montgomery County Government, MD. Residential Permit. Accessed 2026-10-06.
- City of Fort Worth. Development Permits. Accessed 2026-10-06.
- Metropolitan Government of Nashville and Davidson County. Building Permits Issued. Accessed 2026-10-06.
- City of Baton Rouge / Parish of East Baton Rouge. EBR Building Permits. Accessed 2026-10-06.
- LA Department of Building and Safety. Information Bulletin P/BC 2026-111: Backfill of Swimming Pools. Accessed 2026-10-06.
- Office of the Mayor, City of Los Angeles. Emergency Executive Order No. 1: Expedited Community Rebuilding and Recovery (revised 18 March 2025). Accessed 2026-10-06.
- City of San Diego Development Services. Information Bulletin 710: Permit Instructions, Procedures for Building Demolition/Removal (September 2026). Accessed 2026-10-06.
- City of Austin Development Services. Demolition Permit. Accessed 2026-10-06.
- Maricopa County Planning & Development. Pool and Spa Demolition, Directive DD-5015-01. Accessed 2026-10-06.
- City of Scottsdale (Scottsdale Water). Water conservation rebates. Accessed 2026-10-06.
- Pool Construction & Service. Pool Construction Statistics (new pool permit counts by city). Accessed 2026-10-03.
- Realtor.com Economic Research. Swimming Pools in the Housing Market: A Cooling Trend in Premium, but Still a Hot Commodity (21 May 2025). Accessed 2026-10-06.
- Arizona Municipal Water Users Association. Scottsdale Offers Arizona's First Pool Removal Rebate (29 Aug 2016). Accessed 2026-10-06.
- Angi. How Much Does Pool Removal Cost? [2026 Data] (updated 8 Jul 2026). Accessed 2026-10-06.
- City of Los Angeles. LA Strong: Return and Rebuild, Rebuilding. Accessed 2026-10-06.
Related pool research
Pool Construction Statistics: New Pool Permits in 14 US Markets, 2015 to 2026
Number of Swimming Pools in the US: Published Estimates Reconciled
Pool Permit Processing Time: Days From Application to Issue in 12 US Cities, 2019 to 2026
Percentage of Homes With Pools by Metro and State: Backyard Pool Prevalence Index

How Many Homes Have a Hot Tub? US State Atlas of Hot Tub and Spa Ownership, 2024

Pool Industry Market Size: US Revenue Estimates Reconciled, 2017 to 2026
All pool industry research (40 reports)