Public Pools by City: Pools per Resident in 99 Large US Cities, 2026
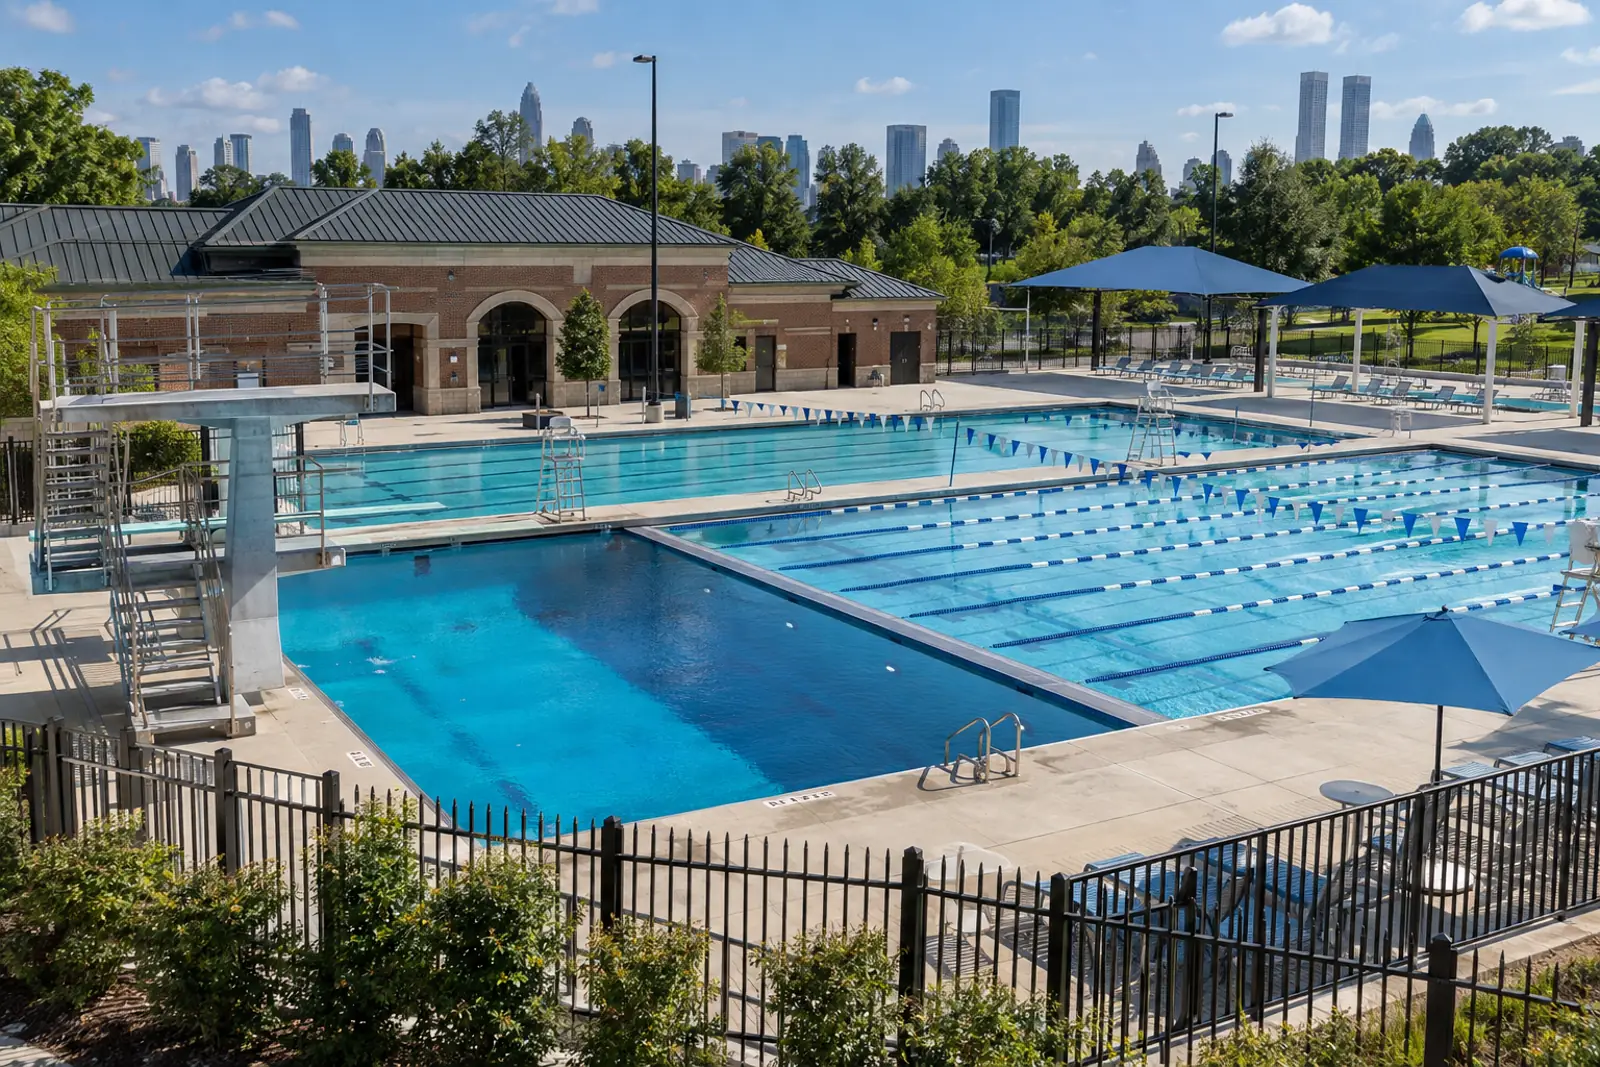
Public pools by city vary about 30-fold across large US cities. In Trust for Public Land's 2026 data, Cleveland has 10.73 public pools per 100,000 residents (2025 Census population), Pittsburgh 7.8 and Cincinnati 7.63, while Madison has 0.35 and Fort Worth 0.49. The median city has 1.85, one pool per 54,034 residents.
At a glance
- Trust for Public Land counted 1,354 public swimming pools in 99 of the 100 largest US cities in its 2026 City Park Facts, or 2.09 pools per 100,000 residents using July 1, 2025 Census populations (Trust for Public Land, City Park Facts 2026; U.S. Census Bureau Vintage 2025).
- Cleveland, OH has the most public pools per resident among large US cities in 2026: 39 pools, or 10.73 per 100,000 residents and one pool per 9,323 residents (Trust for Public Land).
- Chicago has the largest number of public pools of any large US city in 2026, with 78, followed by Philadelphia (73), New York (69) and Los Angeles (58) (Trust for Public Land).
- In 2026, 13 of 94 large US cities with at least one public pool have fewer than 1 pool per 100,000 residents, led by Madison, WI at 0.35 and Fort Worth, TX at 0.49 (Trust for Public Land; Census Bureau).
- Across 88 large US cities reported in every City Park Facts edition from 2018 to 2026, the pool count rose from 1,252 to 1,282 (+2.4%), slightly behind population growth of +2.8% (TPL data tables).
- Warmer large US metros do not have more public pools per resident in 2026: cities in metros with 180 or more swim-season days average 2.44 pools per 100,000, below the 2.69 in metros with 100 to 179 days (rank correlation 0.16; NOAA NCEI normals, Trust for Public Land).
- Splash pads outnumber pools in the 99 large US cities: TPL’s 2026 tables list 2,062 splash pads and 1,354 pools, and splash pads outnumber pools in 41 of the 99 cities (Trust for Public Land).
Public pools by city: 2026 ranking of 99 large US cities
Cleveland, Pittsburgh and Cincinnati lead large US cities on public pools per resident in 2026, followed by Atlanta, Washington, DC and Kansas City, MO. At the other end, several Texas, California and Arizona cities, along with Madison, Minneapolis and New York, have fewer than one pool per 100,000 residents.
Source: PC&S analysis of Trust for Public Land City Park Facts 2026 and U.S. Census Bureau Vintage 2025 estimates. Download chart data (CSV)
Cleveland had 39 public pools in Trust for Public Land’s 2026 count, which works out to 10.73 pools per 100,000 residents on the city’s July 1, 2025 Census population (Trust for Public Land; Census Bureau). Pittsburgh followed at 7.8 and Cincinnati at 7.63. Atlanta (6.24), Washington, DC (5.48) and Kansas City, MO (5.37) complete the top six. 14 of the 94 large US cities with at least one pool have 4 or more pools per 100,000 residents in 2026.
Source: PC&S analysis of Trust for Public Land City Park Facts 2026 and U.S. Census Bureau Vintage 2025 estimates. Download chart data (CSV)
| Rank (pools per 100k, Census) | City (TPL geography) | Public swimming pools (TPL 2026) | Population used by TPL (Esri 2025) | Pools per 100,000 residents (TPL published) | Census population July 1, 2025 (Vintage 2025) | Census geography used | Pools per 100,000 residents (Census 2025) | Residents per pool (Census 2025) | Pools in 2018 edition | Change in pool count, 2018 to 2026 editions | Data note |
|---|---|---|---|---|---|---|---|---|---|---|---|
| 1 | Cleveland, OH | 39 | 367331 | 10.62 | 363608 | Cleveland city | 10.73 | 9323 | 42 | -3 | |
| 2 | Pittsburgh, PA | 24 | 308545 | 7.78 | 307632 | Pittsburgh city | 7.8 | 12818 | 19 | 5 | |
| 3 | Cincinnati, OH | 24 | 317536 | 7.56 | 314367 | Cincinnati city | 7.63 | 13099 | 23 | 1 | |
| 4 | Atlanta, GA | 33 | 534033 | 6.18 | 529110 | Atlanta city | 6.24 | 16034 | 23 | 10 | |
| 5 | Washington, DC | 38 | 709428 | 5.36 | 693645 | Washington city | 5.48 | 18254 | 35 | 3 | |
| 6 | Kansas City, MO | 28 | 521818 | 5.37 | 521220 | Kansas City city | 5.37 | 18615 | 9 | 19 | |
| 7 | Tucson, AZ | 27 | 547288 | 4.93 | 548371 | Tucson city | 4.92 | 20310 | 38 | -11 | |
| 8 | New Orleans, LA | 17 | 376001 | 4.52 | 362154 | New Orleans city | 4.69 | 21303 | 16 | 1 | |
| 9 | Philadelphia, PA | 73 | 1590580 | 4.59 | 1574281 | Philadelphia city | 4.64 | 21565 | 75 | -2 | |
| 10 | Richmond, VA | 11 | 233928 | 4.7 | 237257 | Richmond city | 4.64 | 21569 | 9 | 2 | |
| 11 | St. Petersburg, FL | 12 | 263134 | 4.56 | 264033 | St. Petersburg city | 4.54 | 22003 | 9 | 3 | |
| 12 | Boston, MA | 30 | 661763 | 4.53 | 672973 | Boston city | 4.46 | 22432 | 24 | 6 | |
| 13 | Denver, CO | 32 | 762261 | 4.2 | 740613 | Denver city | 4.32 | 23144 | 29 | 3 | |
| 14 | Baltimore, MD | 24 | 563225 | 4.26 | 569997 | Baltimore city | 4.21 | 23750 | 22 | 2 | |
| 15 | Santa Clarita, CA | 9 | 231478 | 3.89 | 228430 | Santa Clarita city | 3.94 | 25381 | |||
| 16 | Milwaukee, WI | 21 | 563343 | 3.73 | 562407 | Milwaukee city | 3.73 | 26781 | 22 | -1 | |
| 17 | Austin, TX | 35 | 1028149 | 3.4 | 1002632 | Austin city | 3.49 | 28647 | 35 | 0 | TPL code prefixed PS; Census figure is for the whole incorporated place. |
| 18 | Miami, FL | 17 | 465603 | 3.65 | 489812 | Miami city | 3.47 | 28812 | 12 | 5 | |
| 19 | Jacksonville, FL | 35 | 1008868 | 3.47 | 1017689 | Jacksonville city | 3.44 | 29077 | 35 | 0 | |
| 20 | Henderson, NV | 12 | 350828 | 3.42 | 353289 | Henderson city | 3.4 | 29441 | 13 | -1 | TPL code prefixed PS; Census figure is for the whole incorporated place. |
| 21 | Tampa, FL | 14 | 408696 | 3.43 | 413554 | Tampa city | 3.39 | 29540 | 12 | 2 | |
| 22 | Laredo, TX | 9 | 259225 | 3.47 | 269515 | Laredo city | 3.34 | 29946 | 8 | 1 | |
| 23 | Orlando, FL | 11 | 337174 | 3.26 | 333888 | Orlando city | 3.29 | 30353 | 11 | 0 | |
| 24 | Omaha, NE | 16 | 493472 | 3.24 | 488797 | Omaha city | 3.27 | 30550 | 22 | -6 | |
| 25 | Winston-Salem, NC | 8 | 258120 | 3.1 | 257271 | Winston-Salem city | 3.11 | 32159 | 9 | -1 | |
| 26 | Plano, TX | 9 | 290698 | 3.1 | 293028 | Plano city | 3.07 | 32559 | 9 | 0 | |
| 27 | Lincoln, NE | 9 | 300613 | 2.99 | 301522 | Lincoln city | 2.98 | 33502 | 9 | 0 | |
| 28 | Buffalo, NY | 8 | 280445 | 2.85 | 274613 | Buffalo city | 2.91 | 34327 | 10 | -2 | |
| 29 | St. Louis, MO | 8 | 277903 | 2.88 | 278144 | St. Louis city | 2.88 | 34768 | 11 | -3 | |
| 30 | Chicago, IL | 78 | 2635574 | 2.96 | 2731585 | Chicago city | 2.86 | 35020 | 79 | -1 | |
| 31 | Memphis, TN | 17 | 614450 | 2.77 | 609647 | Memphis city | 2.79 | 35862 | 18 | -1 | |
| 32 | El Paso, TX | 18 | 670285 | 2.69 | 683012 | El Paso city | 2.64 | 37945 | 16 | 2 | |
| 33 | Sacramento, CA | 14 | 539961 | 2.59 | 536449 | Sacramento city | 2.61 | 38318 | 12 | 2 | |
| 34 | Spokane, WA | 6 | 239389 | 2.51 | 230783 | Spokane city | 2.6 | 38464 | |||
| 35 | Riverside, CA | 8 | 318983 | 2.51 | 323057 | Riverside city | 2.48 | 40382 | 7 | 1 | |
| 36 | Aurora, CO | 10 | 411009 | 2.43 | 410053 | Aurora city | 2.44 | 41005 | 8 | 2 | |
| 37 | Irving, TX | 6 | 259715 | 2.31 | 257076 | Irving city | 2.33 | 42846 | 6 | 0 | |
| 38 | Arlington, TX | 9 | 402662 | 2.24 | 402134 | Arlington city | 2.24 | 44682 | 7 | 2 | |
| 39 | Albuquerque, NM | 12 | 566056 | 2.12 | 556588 | Albuquerque city | 2.16 | 46382 | 12 | 0 | |
| 40 | Chandler, AZ | 6 | 284403 | 2.11 | 278748 | Chandler city | 2.15 | 46458 | 6 | 0 | |
| 41 | Honolulu County, HI | 21 | 1030625 | 2.04 | 988703 | Honolulu County, Hawaii | 2.12 | 47081 | 22 | -1 | |
| 42 | Arlington, VA | 5 | 254257 | 1.97 | 243931 | Arlington County, Virginia | 2.05 | 48786 | 4 | 1 | |
| 43 | Toledo, OH | 5 | 264251 | 1.89 | 263423 | Toledo city | 1.9 | 52685 | 6 | -1 | |
| 44 | Bakersfield, CA | 8 | 417614 | 1.92 | 422165 | Bakersfield city | 1.89 | 52771 | 9 | -1 | |
| 45 | Corpus Christi, TX | 6 | 318339 | 1.88 | 317247 | Corpus Christi city | 1.89 | 52874 | 6 | 0 | |
| 46 | Houston, TX | 45 | 2267722 | 1.98 | 2397315 | Houston city | 1.88 | 53274 | 42 | 3 | TPL code prefixed PS; Census figure is for the whole incorporated place. |
| 47 | Newark, NJ | 6 | 313217 | 1.92 | 323808 | Newark city | 1.85 | 53968 | 6 | 0 | |
| 48 | Stockton, CA | 6 | 323667 | 1.85 | 324597 | Stockton city | 1.85 | 54100 | 4 | 2 | |
| 49 | Lexington-Fayette County, KY | 6 | 325983 | 1.84 | 329751 | Lexington-Fayette urban county | 1.82 | 54958 | 7 | -1 | |
| 50 | San Antonio, TX | 28 | 1450229 | 1.93 | 1548422 | San Antonio city | 1.81 | 55301 | 25 | 3 | |
| 51 | Reno, NV | 5 | 284270 | 1.76 | 283621 | Reno city | 1.76 | 56724 | 4 | 1 | |
| 52 | Mesa, AZ | 9 | 523187 | 1.72 | 513656 | Mesa city | 1.75 | 57073 | 9 | 0 | |
| 53 | Phoenix, AZ | 29 | 1680720 | 1.73 | 1665481 | Phoenix city | 1.74 | 57430 | 29 | 0 | |
| 54 | Anchorage, AK | 5 | 286721 | 1.74 | 287155 | Anchorage municipality | 1.74 | 57431 | 5 | 0 | |
| 55 | Portland, OR | 11 | 664411 | 1.66 | 635109 | Portland city | 1.73 | 57737 | 13 | -2 | |
| 56 | Norfolk, VA | 4 | 234596 | 1.71 | 231013 | Norfolk city | 1.73 | 57753 | 6 | -2 | |
| 57 | Huntsville, AL | 4 | 234876 | 1.7 | 233627 | Huntsville city | 1.71 | 58407 | |||
| 58 | Boise, ID | 4 | 242489 | 1.65 | 238429 | Boise City city | 1.68 | 59607 | 7 | -3 | |
| 59 | Scottsdale, AZ | 4 | 249257 | 1.6 | 243006 | Scottsdale city | 1.65 | 60752 | 4 | 0 | |
| 60 | Greensboro, NC | 5 | 306925 | 1.63 | 308667 | Greensboro city | 1.62 | 61733 | 4 | 1 | |
| 61 | Santa Ana, CA | 5 | 307387 | 1.63 | 315586 | Santa Ana city | 1.58 | 63117 | 5 | 0 | |
| 62 | Raleigh, NC | 8 | 489209 | 1.64 | 506306 | Raleigh city | 1.58 | 63288 | 10 | -2 | |
| 63 | Virginia Beach, VA | 7 | 456754 | 1.53 | 453737 | Virginia Beach city | 1.54 | 64820 | 7 | 0 | |
| 64 | Nashville-Davidson County, TN | 11 | 730276 | 1.51 | 721074 | Nashville-Davidson metropolitan government (balance) | 1.53 | 65552 | 10 | 1 | |
| 65 | Los Angeles, CA | 58 | 3814386 | 1.52 | 3869089 | Los Angeles city | 1.5 | 66708 | 66 | -8 | |
| 66 | Wichita, KS | 6 | 402497 | 1.49 | 400987 | Wichita city | 1.5 | 66831 | 9 | -3 | |
| 67 | San Francisco, CA | 12 | 866216 | 1.39 | 826079 | San Francisco city | 1.45 | 68840 | 11 | 1 | |
| 68 | Fresno, CA | 8 | 552888 | 1.45 | 555549 | Fresno city | 1.44 | 69444 | 9 | -1 | |
| 69 | Dallas, TX | 19 | 1319030 | 1.44 | 1329491 | Dallas city | 1.43 | 69973 | 17 | 2 | |
| 70 | Gilbert, AZ | 4 | 289542 | 1.38 | 287285 | Gilbert town | 1.39 | 71821 | 4 | 0 | |
| 71 | Oakland, CA | 6 | 445655 | 1.35 | 440838 | Oakland city | 1.36 | 73473 | 6 | 0 | |
| 72 | North Las Vegas, NV | 4 | 293010 | 1.37 | 296653 | North Las Vegas city | 1.35 | 74163 | 4 | 0 | |
| 73 | Durham, NC | 4 | 304921 | 1.31 | 305561 | Durham city | 1.31 | 76390 | 5 | -1 | |
| 74 | St. Paul, MN | 4 | 315526 | 1.27 | 306684 | St. Paul city | 1.3 | 76671 | 3 | 1 | |
| 75 | Seattle, WA | 10 | 773833 | 1.29 | 784777 | Seattle city | 1.27 | 78478 | 10 | 0 | |
| 76 | Frisco, TX | 3 | 236070 | 1.27 | 236955 | Frisco city | 1.27 | 78985 | |||
| 77 | Irvine, CA | 4 | 324586 | 1.23 | 318764 | Irvine city | 1.25 | 79691 | 4 | 0 | |
| 78 | Detroit, MI | 8 | 625512 | 1.28 | 649095 | Detroit city | 1.23 | 81137 | 8 | 0 | |
| 79 | Tulsa, OK | 5 | 425469 | 1.18 | 416209 | Tulsa city | 1.2 | 83242 | 13 | -8 | |
| 80 | San Diego, CA | 15 | 1384281 | 1.08 | 1406106 | San Diego city | 1.07 | 93740 | 13 | 2 | |
| 81 | Colorado Springs, CO | 5 | 507798 | 0.98 | 494743 | Colorado Springs city | 1.01 | 98949 | 5 | 0 | |
| 82 | Jersey City, NJ | 3 | 314337 | 0.95 | 302013 | Jersey City city | 0.99 | 100671 | 4 | -1 | |
| 83 | Charlotte-Mecklenburg County, NC | 12 | 1206110 | 0.99 | 1233383 | Mecklenburg County, North Carolina | 0.97 | 102782 | 5 | 7 | |
| 84 | Minneapolis, MN | 4 | 435667 | 0.92 | 430324 | Minneapolis city | 0.93 | 107581 | 3 | 1 | |
| 85 | Oklahoma City, OK | 6 | 718231 | 0.84 | 719849 | Oklahoma City city | 0.83 | 119975 | 5 | 1 | |
| 86 | New York, NY | 69 | 8688336 | 0.79 | 8584629 | New York city | 0.8 | 124415 | 53 | 16 | |
| 87 | Garland, TX | 2 | 252488 | 0.79 | 249625 | Garland city | 0.8 | 124812 | 5 | -3 | |
| 88 | Louisville-Jefferson County, KY | 5 | 636226 | 0.79 | 641962 | Louisville/Jefferson County metro government (balance) | 0.78 | 128392 | 6 | -1 | |
| 89 | Glendale, AZ | 2 | 259019 | 0.77 | 260572 | Glendale city | 0.77 | 130286 | 2 | 0 | |
| 90 | Chula Vista, CA | 2 | 281855 | 0.71 | 275533 | Chula Vista city | 0.73 | 137766 | 2 | 0 | |
| 91 | Long Beach, CA | 3 | 450339 | 0.67 | 450469 | Long Beach city | 0.67 | 150156 | 3 | 0 | TPL code prefixed PS; Census figure is for the whole incorporated place. |
| 92 | Fort Worth, TX | 5 | 1009355 | 0.5 | 1028117 | Fort Worth city | 0.49 | 205623 | 2 | 3 | |
| 93 | Fremont, CA | 1 | 237191 | 0.42 | 226442 | Fremont city | 0.44 | 226442 | 0 | 1 | |
| 94 | Madison, WI | 1 | 288249 | 0.35 | 286233 | Madison city | 0.35 | 286233 | 1 | 0 | |
| Anaheim, CA | 0 | 342462 | 0.0 | 341008 | Anaheim city | 0.0 | 1 | -1 | TPL recorded no pools meeting its definition (indoor or outdoor, 4 ft minimum depth) | ||
| Chesapeake, VA | 0 | 258308 | 0.0 | 255332 | Chesapeake city | 0.0 | 0 | 0 | TPL recorded no pools meeting its definition (indoor or outdoor, 4 ft minimum depth) | ||
| Lubbock, TX | 0 | 269205 | 0.0 | 273071 | Lubbock city | 0.0 | 4 | -4 | TPL recorded no pools meeting its definition (indoor or outdoor, 4 ft minimum depth) | ||
| Port St. Lucie, FL | 0 | 243412 | 0.0 | 268062 | Port St. Lucie city | 0.0 | TPL recorded no pools meeting its definition (indoor or outdoor, 4 ft minimum depth) | ||||
| San Jose, CA | 0 | 1007904 | 0.0 | 989814 | San Jose city | 0.0 | 6 | -6 | Reported 0 in the 2026 edition after 6 in every edition from 2018 to 2025; the City of San Jose aquatics page lists Camden, Fair, Mayfair and Rotary Ryland pools in 2026. Treated as a reporting gap, not a closure. |
Source: Trust for Public Land, City Park Facts 2026 (pool counts, Esri 2025 populations); U.S. Census Bureau Vintage 2025 (July 1, 2025 populations); PC&S calculations. Download CSV
Cities with the most public pools in total, 2026
Raw counts favor the biggest park systems. Chicago, Philadelphia and New York each report between 69 and 78 pools, but New York ranks near the bottom per resident because its 69 pools serve 8,584,629 residents (Census, July 1, 2025).
Source: Trust for Public Land, City Park Facts 2026. Download chart data (CSV)
Chicago reported 78 public pools in TPL’s 2026 count, the most of any large US city, equal to 2.86 per 100,000 residents (Trust for Public Land). Philadelphia reported 73 pools (4.64 per 100,000), New York 69 (0.8 per 100,000) and Los Angeles 58 (1.5 per 100,000).
Houston reported 45 public pools in 2026, the most in Texas, but 1.88 per 100,000 residents (Trust for Public Land). Phoenix reported 29 pools, 1.74 per 100,000, despite 232 swim-season days a year at its airport (Swim Season Index).
How many residents one public pool serves in large US cities
The median large US city has one public pool for every 54,034 residents in 2026. That is well below NRPA’s median of 143,541 residents per outdoor pool for jurisdictions of 500,000 or more, but the two sources count different things.
Across the 94 large US cities with at least one pool, the median is 54,034 residents per public pool in 2026, on July 1, 2025 Census populations (Trust for Public Land; Census Bureau). Pooling all 99 cities, there are 47,873 residents per pool. Cleveland has one pool per 9,323 residents; Madison has one per 286,233.
13 large US cities with at least one pool have more than 100,000 residents per pool in 2026, including New York (124,415), Fort Worth (205,623) and Long Beach (150,156) (Trust for Public Land).
| Population of jurisdiction | NRPA median residents per outdoor swimming pool (2026 APR, agencies with pools) | TPL 2026 cities in band with 1+ pool | TPL 2026 median residents per pool (indoor + outdoor, all agencies; Census 2025) | Ratio, TPL median to NRPA median |
|---|---|---|---|---|
| 100,000 to 249,999 | 59742 | 11 | 58407 | 0.98 |
| 250,000 to 499,999 | 102121 | 47 | 52874 | 0.52 |
| 500,000 or more | 143541 | 36 | 54287 | 0.38 |
| All jurisdiction sizes | 48461 | 94 | 54034 | 1.11 |
Source: NRPA 2026 Agency Performance Review, Figure 3; Trust for Public Land, City Park Facts 2026; U.S. Census Bureau Vintage 2025; PC&S calculations. Download CSV
NRPA’s 2026 Agency Performance Review puts the median at 48,461 residents per outdoor swimming pool for all agencies, 102,121 for jurisdictions of 250,000 to 499,999 and 143,541 for jurisdictions of 500,000 or more (NRPA). The 36 TPL cities of 500,000 or more with at least one pool have a median of 54,287 residents per pool in 2026.
Public pool counts in large US cities, 2018 to 2026
TPL’s own data shows no broad wave of closures in large US cities since 2018. Counts in a fixed set of 88 cities rose slightly, about in line with population, while individual cities moved in both directions, some because of reporting changes.
Year-to-year jumps in single cities often reflect agencies added to or dropped from the survey.
Source: PC&S analysis of Trust for Public Land City Park Facts data tables, 2018 to 2026 editions. Download chart data (CSV)
The 88 large US cities with a pool count in every City Park Facts edition from 2018 to 2026 reported 1,252 pools in the 2018 edition and 1,282 in the 2026 edition, a change of +30 (+2.4%) (TPL data tables). Their combined population in TPL’s tables rose +2.8%, so pools per 100,000 residents moved from 2.09 to 2.08.
| TPL City Park Facts edition | Cities listed in pool table | Cities with a pool count | Total pools, all cities with a count | Median pools per 100k (cities with 1+ pool, TPL populations) | Balanced panel: cities | Balanced panel: total pools | Balanced panel: population (TPL, that edition) | Balanced panel: pools per 100k |
|---|---|---|---|---|---|---|---|---|
| 2018 | 100 | 100 | 1350 | 2.07 | 88 | 1252 | 59957106 | 2.09 |
| 2019 | 100 | 95 | 1275 | 1.84 | 88 | 1220 | 60853234 | 2.0 |
| 2020 | 100 | 94 | 1290 | 1.82 | 88 | 1245 | 61139207 | 2.04 |
| 2021 | 99 | 98 | 1332 | 1.85 | 88 | 1255 | 61127151 | 2.05 |
| 2022 | 100 | 98 | 1352 | 1.95 | 88 | 1259 | 60924477 | 2.07 |
| 2023 | 101 | 101 | 1370 | 1.85 | 88 | 1265 | 61826496 | 2.05 |
| 2024 | 101 | 101 | 1347 | 1.94 | 88 | 1250 | 61254078 | 2.04 |
| 2025 | 100 | 100 | 1370 | 1.92 | 88 | 1282 | 61364879 | 2.09 |
| 2026 | 99 | 99 | 1354 | 1.89 | 88 | 1282 | 61614971 | 2.08 |
Source: Trust for Public Land, City Park Facts data tables 2010 to 2026; PC&S calculations. Download CSV
Between the 2018 and 2026 editions, 33 of the 88 cities reported more pools (a combined +110), 29 reported fewer (-80) and 26 were unchanged (TPL data tables). The largest declines were Tucson (38 to 27), Los Angeles (66 to 58) and Tulsa (13 to 5). The largest increases were Kansas City, MO (9 to 28), New York (53 to 69) and Atlanta (23 to 33).
| City | Pools, 2018 edition | Pools, 2026 edition | Change | Count by edition 2018 to 2026 | Data note |
|---|---|---|---|---|---|
| Tucson, AZ | 38 | 27 | -11 | 38 / 28 / 28 / 28 / 28 / 28 / 27 / 27 / 27 | |
| Los Angeles, CA | 66 | 58 | -8 | 66 / 65 / 67 / 64 / 64 / 64 / 62 / 61 / 58 | |
| Tulsa, OK | 13 | 5 | -8 | 13 / 5 / 5 / 5 / 5 / 5 / 5 / 5 / 5 | |
| Omaha, NE | 22 | 16 | -6 | 22 / 18 / 18 / 18 / 18 / 18 / 17 / 16 / 16 | |
| San Jose, CA | 6 | 0 | -6 | 6 / 6 / 6 / 6 / 6 / 6 / 6 / 6 / 0 | Reported 0 in the 2026 edition after 6 in every edition from 2018 to 2025; the City of San Jose aquatics page lists Camden, Fair, Mayfair and Rotary Ryland pools in 2026. Treated as a reporting gap, not a closure. |
| Lubbock, TX | 4 | 0 | -4 | 4 / 4 / 4 / 4 / 4 / 4 / 1 / 1 / 0 | |
| Boise, ID | 7 | 4 | -3 | 7 / 7 / 7 / 7 / 7 / 7 / 7 / 4 / 4 | |
| Cleveland, OH | 42 | 39 | -3 | 42 / 42 / 41 / 41 / 40 / 40 / 39 / 39 / 39 | |
| Garland, TX | 5 | 2 | -3 | 5 / 5 / 5 / 5 / 5 / 3 / 1 / 1 / 2 | |
| St. Louis, MO | 11 | 8 | -3 | 11 / 9 / 8 / 8 / 8 / 8 / 8 / 8 / 8 | |
| Wichita, KS | 9 | 6 | -3 | 9 / 9 / 10 / 10 / 6 / 6 / 6 / 6 / 6 | |
| Buffalo, NY | 10 | 8 | -2 | 10 / 9 / 9 / 9 / 11 / 9 / 9 / 8 / 8 | |
| Philadelphia, PA | 75 | 73 | -2 | 75 / 72 / 72 / 72 / 72 / 72 / 73 / 73 / 73 | |
| Portland, OR | 13 | 11 | -2 | 13 / 12 / 12 / 12 / 12 / 12 / 11 / 11 / 11 | |
| Raleigh, NC | 10 | 8 | -2 | 10 / 8 / 8 / 8 / 8 / 8 / 8 / 8 / 8 | |
| Anaheim, CA | 1 | 0 | -1 | 1 / 1 / 1 / 1 / 1 / 1 / 0 / 0 / 0 | |
| Bakersfield, CA | 9 | 8 | -1 | 9 / 7 / 7 / 7 / 7 / 7 / 8 / 8 / 8 | |
| Chicago, IL | 79 | 78 | -1 | 79 / 78 / 78 / 79 / 79 / 79 / 79 / 79 / 78 | |
| Durham, NC | 5 | 4 | -1 | 5 / 5 / 5 / 5 / 5 / 5 / 5 / 5 / 4 | |
| Fresno, CA | 9 | 8 | -1 | 9 / 9 / 9 / 9 / 9 / 9 / 11 / 9 / 8 | |
| Henderson, NV | 13 | 12 | -1 | 13 / 13 / 13 / 13 / 13 / 13 / 13 / 11 / 12 | |
| Honolulu County, HI | 22 | 21 | -1 | 22 / 22 / 21 / 21 / 21 / 21 / 21 / 21 / 21 | |
| Jersey City, NJ | 4 | 3 | -1 | 4 / 4 / 4 / 4 / 4 / 3 / 3 / 3 / 3 | |
| Lexington-Fayette County, KY | 7 | 6 | -1 | 7 / 7 / 6 / 6 / 6 / 6 / 5 / 5 / 6 | |
| Louisville-Jefferson County, KY | 6 | 5 | -1 | 6 / 1 / 4 / 4 / 5 / 5 / 5 / 5 / 5 | |
| Memphis, TN | 18 | 17 | -1 | 18 / 18 / 18 / 18 / 18 / 18 / 17 / 17 / 17 | |
| Milwaukee, WI | 22 | 21 | -1 | 22 / 22 / 22 / 22 / 22 / 22 / 22 / 21 / 21 | |
| Toledo, OH | 6 | 5 | -1 | 6 / 6 / 6 / 6 / 6 / 6 / 6 / 6 / 5 | |
| Winston-Salem, NC | 9 | 8 | -1 | 9 / 9 / 10 / 8 / 8 / 8 / 8 / 8 / 8 | |
| Arlington, VA | 4 | 5 | 1 | 4 / 1 / 4 / 4 / 5 / 5 / 5 / 5 / 5 | |
| Cincinnati, OH | 23 | 24 | 1 | 23 / 23 / 23 / 23 / 24 / 24 / 23 / 24 / 24 | |
| Fremont, CA | 0 | 1 | 1 | 0 / 1 / 1 / 1 / 1 / 1 / 1 / 1 / 1 | |
| Greensboro, NC | 4 | 5 | 1 | 4 / 5 / 5 / 5 / 5 / 5 / 5 / 5 / 5 | |
| Laredo, TX | 8 | 9 | 1 | 8 / 8 / 8 / 9 / 9 / 9 / 9 / 9 / 9 | |
| Minneapolis, MN | 3 | 4 | 1 | 3 / 4 / 4 / 4 / 4 / 4 / 4 / 4 / 4 | |
| Nashville-Davidson County, TN | 10 | 11 | 1 | 10 / 10 / 10 / 10 / 10 / 10 / 11 / 11 / 11 | |
| New Orleans, LA | 16 | 17 | 1 | 16 / 15 / 17 / 19 / 18 / 17 / 17 / 17 / 17 | |
| Oklahoma City, OK | 5 | 6 | 1 | 5 / 5 / 5 / 5 / 5 / 5 / 6 / 6 / 6 | |
| Reno, NV | 4 | 5 | 1 | 4 / 4 / 4 / 4 / 4 / 4 / 4 / 5 / 5 | |
| Riverside, CA | 7 | 8 | 1 | 7 / 7 / 7 / 7 / 7 / 7 / 7 / 8 / 8 | |
| San Francisco, CA | 11 | 12 | 1 | 11 / 11 / 9 / 12 / 12 / 12 / 12 / 12 / 12 | |
| St. Paul, MN | 3 | 4 | 1 | 3 / 4 / 4 / 4 / 4 / 4 / 4 / 4 / 4 | |
| Arlington, TX | 7 | 9 | 2 | 7 / 5 / 5 / 5 / 6 / 5 / 6 / 9 / 9 | |
| Aurora, CO | 8 | 10 | 2 | 8 / 9 / 9 / 20 / 10 / 10 / 11 / 11 / 10 | |
| Baltimore, MD | 22 | 24 | 2 | 22 / 22 / 22 / 22 / 23 / 20 / 20 / 24 / 24 | |
| Dallas, TX | 17 | 19 | 2 | 17 / 20 / 19 / 19 / 19 / 19 / 19 / 19 / 19 | |
| El Paso, TX | 16 | 18 | 2 | 16 / 17 / 16 / 17 / 16 / 13 / 16 / 18 / 18 | |
| Sacramento, CA | 12 | 14 | 2 | 12 / 12 / 12 / 13 / 13 / 14 / 13 / 13 / 14 | |
| San Diego, CA | 13 | 15 | 2 | 13 / 13 / 13 / 13 / 13 / 14 / 15 / 15 / 15 | |
| Stockton, CA | 4 | 6 | 2 | 4 / 4 / 4 / 4 / 5 / 5 / 5 / 4 / 6 | |
| Denver, CO | 29 | 32 | 3 | 29 / 31 / 31 / 31 / 31 / 32 / 33 / 33 / 32 | |
| Fort Worth, TX | 2 | 5 | 3 | 2 / 3 / 3 / 3 / 3 / 3 / 3 / 4 / 5 | |
| Houston, TX | 42 | 45 | 3 | 42 / 42 / 41 / 42 / 39 / 39 / 41 / 42 / 45 | |
| San Antonio, TX | 25 | 28 | 3 | 25 / 28 / 29 / 29 / 26 / 28 / 28 / 28 / 28 | |
| St. Petersburg, FL | 9 | 12 | 3 | 9 / 9 / 9 / 9 / 9 / 9 / 12 / 12 / 12 | |
| Washington, DC | 35 | 38 | 3 | 35 / 30 / 35 / 33 / 33 / 33 / 33 / 38 / 38 | |
| Pittsburgh, PA | 19 | 24 | 5 | 19 / 19 / 19 / 19 / 19 / 24 / 24 / 24 / 24 | |
| Boston, MA | 24 | 30 | 6 | 24 / 20 / 20 / 21 / 29 / 28 / 30 / 30 / 30 | |
| Charlotte-Mecklenburg County, NC | 5 | 12 | 7 | 5 / 5 / 5 / 5 / 5 / 9 / 11 / 11 / 12 | |
| Atlanta, GA | 23 | 33 | 10 | 23 / 20 / 20 / 20 / 33 / 33 / 33 / 33 / 33 | |
| New York, NY | 53 | 69 | 16 | 53 / 72 / 72 / 72 / 72 / 66 / 66 / 69 / 69 | |
| Kansas City, MO | 9 | 28 | 19 | 9 / 9 / 9 / 9 / 9 / 9 / 11 / 28 / 28 |
Source: Trust for Public Land, City Park Facts data tables; PC&S calculations. Download CSV
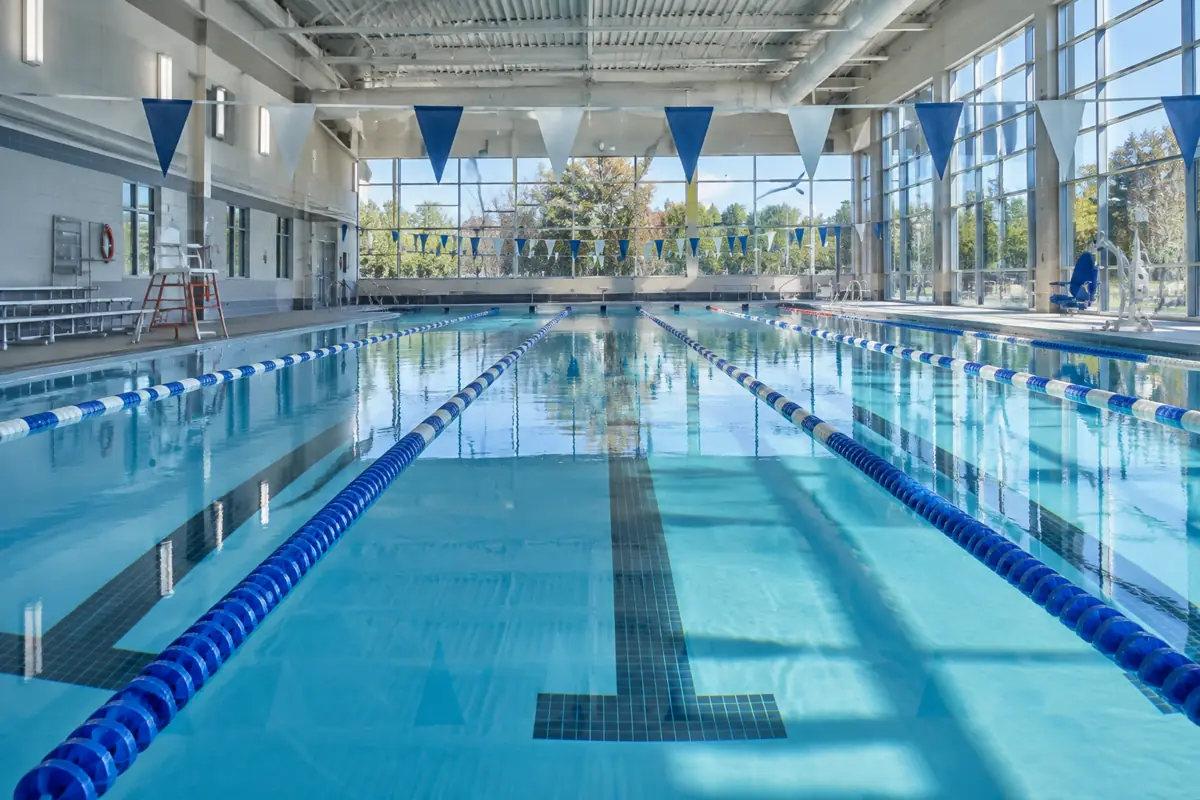
Do warmer cities have more public pools per resident?
No clear relationship appears between climate and public pool supply in large US cities. The warmest metros do not have the most pools per resident; the Pacific coast cities, where the 1991-2020 normal daily high never reaches 80F at the metro airport, have the fewest.
Association only. Cities are assigned their metro's airport climate.
Source: PC&S analysis of TPL City Park Facts 2026, Census Vintage 2025 and the PC&S Swim Season Index (NOAA NCEI normals). Download chart data (CSV)
PC&S matched 74 large US cities with at least one pool to 48 metros in its Swim Season Index, which counts days with a 1991-2020 normal daily high of 80F or more at each metro’s primary airport (NOAA NCEI). The rank correlation between swim-season days and pools per 100,000 residents is 0.16, which is weak.
Cities in metros with 180 or more swim-season days have 2.44 pools per 100,000 residents in aggregate (median city 2.14), compared with 2.69 (median 2.39) for 100 to 179 days and 1.89 (median 1.85) for 1 to 99 days (Trust for Public Land). The 11 Pacific coast cities in metros with 0 days at 80F, including Los Angeles, San Diego, San Francisco and Seattle, have 1.37 per 100,000 (median 1.27).
| Swim-season band (days with 1991-2020 normal high >= 80F, metro airport) | Cities | Metros | Public pools (TPL 2026) | Census population 2025 | Pools per 100k (aggregate) | Median city pools per 100k |
|---|---|---|---|---|---|---|
| 0 days (Pacific coast marine climate) | 11 | 4 | 125 | 9142113 | 1.37 | 1.27 |
| 1 to 99 days | 13 | 10 | 305 | 16144480 | 1.89 | 1.85 |
| 100 to 179 days | 32 | 23 | 477 | 17708230 | 2.69 | 2.39 |
| 180 days or more | 18 | 11 | 315 | 12903109 | 2.44 | 2.14 |
Source: Trust for Public Land, City Park Facts 2026; U.S. Census Bureau Vintage 2025; PC&S Swim Season Index from NOAA NCEI U.S. Climate Normals 1991-2020; PC&S calculations. Download CSV
Cities with the fewest public pools per resident, 2026
The lowest-access cities include Texas, California and Arizona cities as well as Madison, Minneapolis and New York. Lubbock closed its pools and opened splash pads in 2024, and splash pads now outnumber pools in 41 large cities.
13 of the 94 large US cities with at least one pool had fewer than 1 public pool per 100,000 residents in 2026: Madison, Fremont, Fort Worth, Long Beach, Chula Vista, Glendale (AZ), Louisville-Jefferson County, Garland, New York, Oklahoma City, Minneapolis, Charlotte-Mecklenburg County and Jersey City (Trust for Public Land; Census Bureau).
Lubbock, TX reported 4 pools in every TPL edition from 2018 to 2023, then 1 in 2024 and 2025 and 0 in 2026 (TPL data tables). Lubbock’s council voted in 2022 to close and demolish three pools and replace them with splash pads funded with $5.1 million in ARPA money, according to KCBD (May 31, 2024, Tier 3). The Texas Tribune reported in July 2024 that none of Lubbock’s four former public pools were open (The Texas Tribune, Tier 3).
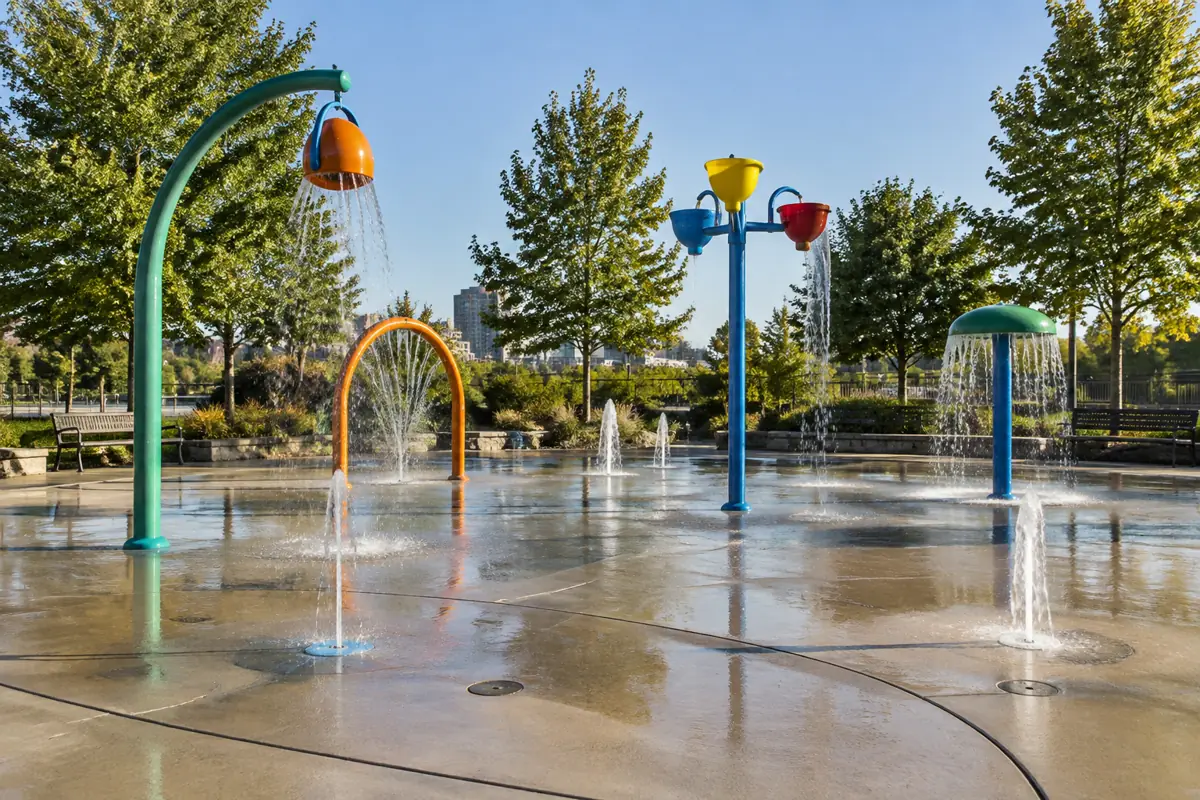
TPL’s 2026 tables list 2,062 splash pads and 1,354 pools in the same 99 large US cities, and splash pads outnumber pools in 41 of them (Trust for Public Land). New York lists 593 splash pads, Chicago 243 and Boston 100. TPL’s 2018 report noted that splash pads had replaced some pools but saw no noticeable downward trend in pool numbers (TPL).
City-published pool counts, closures and admission, 2024 to 2026
Official city pages add context TPL’s counts cannot: how many pools actually opened, which are closed for repairs, and whether entry is free. The closures documented here were attributed to repairs, operating cost and lifeguard staffing.
| City | TPL 2026 count (indoor + outdoor, 4 ft minimum, all agencies) | City-published figure | What the city figure covers | Admission (as published) | Source | Source URL |
|---|---|---|---|---|---|---|
| New York, NY | 69 | 91 pools at 64 locations | NYC Parks pools incl. 24 wading pools (1 to 2.5 ft) and 17 mini-pools (3 ft); 2023 | Free (outdoor pools) | NYC Council Data Team; NYC Parks | https://council.nyc.gov/data/pools/ |
| Philadelphia, PA | 73 | More than 60 outdoor pools | Outdoor pools run by Parks & Recreation; 7 closed in 2026 for capital work | Free | City of Philadelphia | https://www.phila.gov/2026-06-12-philadelphia-2026-public-pool-opening-schedule/ |
| Pittsburgh, PA | 24 | 17 open Citiparks pools | Pools operated by Citiparks in 2026 | Daily fee or pool tag | City of Pittsburgh | https://www.pittsburghpa.gov/Recreation-Events/CitiParks/Aquatics |
| Baltimore, MD | 24 | 22 indoor and outdoor pools | Baltimore City Recreation and Parks pools, 2026 | Not stated (Civic Rec account required) | Baltimore City Recreation and Parks | https://web.archive.org/web/20260728203355/https://www.baltimorecity.gov/bcrp/pools |
| San Antonio, TX | 28 | 23 outdoor pools plus 1 indoor natatorium | Outdoor pools opening June 20, 2026 (Cassiano Pool closed for construction) | Free (outdoor pools) | City of San Antonio | https://www.sa.gov/Directory/News-Releases/23-Outdoor-City-Pools-Opening-for-Summer-Season |
| San Jose, CA | 0 | Camden, Fair, Mayfair and Rotary Ryland pools listed, plus 2 partner-run pools | City aquatics page, 2026 season; Alviso and Biebrach pools run by a partner | Not stated on page | City of San Jose | https://www.sanjoseca.gov/your-government/departments-offices/parks-recreation-neighborhood-services/athletics-fitness/swimming-and-pools |
| Lubbock, TX | 0 | 0 open pools (July 2024); 3 splash pads | City had 4 public pools in 2022; none open in July 2024 | Splash pads free | The Texas Tribune; KCBD (Tier 3) | https://www.texastribune.org/2024/07/11/texas-public-pools-lubbock-longview/ |
Source: city park department pages and New York City Council (links in table); Texas Tribune and KCBD for Lubbock (Tier 3); Trust for Public Land City Park Facts 2026. Download CSV
Philadelphia listed 10 pools that would not open in 2024 and 10 that would not open in 2025 because of repairs (City of Philadelphia, 2024; City of Philadelphia, 2025). For 2026 the city kept 7 neighborhood pools closed for a combined $70 million in upgrades and reconstruction (City of Philadelphia).
Fort Wayne, IN set August 1, 2026 as the last day for its city pools, as staff headed back to school and the department lacked the required number of lifeguards, according to WPTA 21Alive (Tier 3; Fort Wayne is not in TPL’s 2026 city list). In July 2023, 10 of Boston’s 18 public pools were closed for repairs during a heat wave, Marketplace reported (Marketplace, Tier 3).
Admission rules vary. New York advertises free outdoor pools (NYC Parks), Philadelphia describes its outdoor pools as a free place to cool down (City of Philadelphia) and San Antonio states that all its outdoor pools are free in 2026 (City of San Antonio). Pittsburgh requires a daily admission fee or a pool tag (City of Pittsburgh), and Davenport, IA charges $5 per person for public swim (City of Davenport).
How these public pool figures compare with other published numbers
Other widely shared figures measure different things. The national public pool estimate covers all public aquatic venues, including those at apartments, hotels and clubs, and older city rankings use earlier TPL editions.
- CDC cited an estimate of 309,000 public aquatic venues in the United States in 2011, from aquatic-sector marketing data, and classifies such venues by setting, including apartments and condominiums, hotels and motels, membership clubs and municipal facilities (CDC). That figure covers far more than park-system pools; see our report on the number of swimming pools in the US for the full reconciliation.
- TPL’s 1,354 pools cover only the 99 large cities with a 2026 count, which TPL says hold about 20% of the US population across its 100 cities (TPL).
- Marketplace’s 2023 figure of 10.8 pools per 100,000 residents for Cleveland matches TPL’s 2023 edition (40 pools, 10.77 per 100,000); the 2026 edition gives Cleveland 39 pools and 10.62 per 100,000 on TPL’s population, or 10.73 on the Census 2025 population (Marketplace; TPL).
- TPL’s ParkScore index does not score swimming pools. Its seven amenity measures are basketball hoops, dog parks, playgrounds, splash pads and water play, sports fields, recreation and senior centers, and restrooms (TPL, May 20, 2026).
- NRPA counts pools per agency, not per city, and 34% of agencies operate indoor swimming facilities or indoor water parks in its 2026 review (NRPA).
- For residential pool construction by city, see pool construction statistics; for drowning data, see pool drowning statistics by state.
Fifteen numbers that matter
- Cleveland, OH had 39 public pools in TPL’s 2026 count, 10.73 per 100,000 residents on a July 1, 2025 Census population of 363,608 (Trust for Public Land; Census Bureau).
- Pittsburgh, PA had 24 public pools in 2026, 7.8 per 100,000 residents, the second-highest rate among large US cities (Trust for Public Land).
- Cincinnati, OH had 24 public pools in 2026, 7.63 per 100,000 residents, third among large US cities (Trust for Public Land).
- Madison, WI had 1 public pool in TPL’s 2026 count, 0.35 per 100,000 residents, or 286,233 residents per pool, the lowest nonzero rate among large US cities (Trust for Public Land).
- Fort Worth, TX had 5 public pools for 1,028,117 residents in 2026, one pool per 205,623 residents (Trust for Public Land; Census Bureau).
- New York, NY had 69 pools in TPL’s 2026 count, 0.8 per 100,000 residents; the NYC Council lists 91 NYC Parks pools, a total that includes 24 wading pools and 17 mini-pools shallower than TPL’s 4 ft minimum (Trust for Public Land; New York City Council, 2023).
- Five of the 99 large US cities reported zero pools meeting TPL’s definition in 2026: Anaheim, Chesapeake, Lubbock, Port St. Lucie and San Jose; San Jose’s zero follows 6 pools in every edition from 2018 to 2025 and conflicts with the city’s own 2026 pool list (Trust for Public Land; City of San Jose).
- The median large US city with at least one public pool had 1.85 pools per 100,000 residents in 2026 on Census populations; TPL’s published median on its own Esri populations is 1.84 (Trust for Public Land).
- Across all 99 large US cities, there were 47,873 residents per public pool in 2026 (Trust for Public Land; Census Bureau).
- Among the 88 large US cities with a pool count in all nine editions from 2018 to 2026, 33 gained pools, 29 lost pools and 26 were unchanged (TPL data tables).
- Los Angeles reported 58 public pools in the 2026 edition, down from 66 in the 2018 edition, with declines in five of the eight edition-to-edition steps (TPL data tables).
- Kansas City, MO reported 28 pools in the 2025 and 2026 editions, up from 11 in the 2024 edition and 9 in each edition from 2018 to 2023; TPL’s tables do not say whether the jump reflects new pools or newly reporting organizations (TPL data tables).
- The 2026 NRPA Agency Performance Review reports that 53% of park and recreation agencies have outdoor swimming pools, with a median of 48,461 residents per pool, based on 2023 to 2025 data from more than 850 US agencies (NRPA).
- For US jurisdictions of 500,000 or more, NRPA’s 2026 median is 143,541 residents per outdoor pool; the 36 TPL cities of that size with at least one pool have a median of 54,287 residents per pool counting indoor and outdoor pools of all agencies (NRPA; Trust for Public Land).
- Philadelphia kept 7 neighborhood pools closed for the 2026 season for a combined $70 million in capital work, after 10 pools did not open in 2025 because of repairs (City of Philadelphia, 2026; City of Philadelphia, 2025).
Rates, trends and severity we calculated
Residents per public pool ranking
How many residents share each public pool in each large US city?
Residents per pool = Census July 1, 2025 population / TPL 2026 pool count; ranked among cities with at least one poolInputs: facts.csv TPL 2026 pool rows and Census population rows (one pair per city); derived rows D1 to D99, D104, D106
Limitations: TPL counts all park organizations’ pools in a city; geographies are places, consolidated cities or counties as TPL defines them; five zero-reporting cities have no ratio.
Pools per 100,000 residents vs swim-season length
Do cities with longer warm seasons provide more public pools?
Spearman rank correlation of pools per 100,000 (Census 2025) against metro swim-season days (normal high of 80F or more, 1991-2020); aggregate and median rates by season bandInputs: Swim Season Index rows (48 metros) in facts.csv; city rows D1 to D99; D128 to D132
Limitations: Association only; one airport station per metro; suburbs share their metro’s climate; 20 cities outside the index metros excluded.
Change in public pool supply, 2018 to 2026 editions
Are large US cities adding or losing public pools?
Balanced panel of 88 cities with a count in all nine editions; change in total pools and in pools per 100,000 using each edition's TPL populationsInputs: TPL history rows in facts.csv (one per city); D115 to D127
Limitations: Single-city changes mix real openings and closures with changes in which organizations report; TPL population sources vary by edition.
Cities with very few public pools per resident
Which large US cities have the least public pool access?
Count of cities with fewer than 1 pool per 100,000 residents or more than 100,000 residents per pool; list of zero-reporting citiesInputs: D109, D110, D112; city rows D1 to D99
Limitations: Cities with beaches, lakes or many private and HOA pools may have lower demand for park pools; TPL excludes pools under 4 ft.
Recalculating TPL rates on Census populations
Do the rankings depend on the population source?
Compare TPL rates (Esri 2025) with rates on Census Vintage 2025; median percentage gap and largest rank shiftInputs: D113, D114
Limitations: Census figures for three county-based TPL geographies (Honolulu, Charlotte-Mecklenburg, Arlington VA) use county estimates.
Splash pads vs pools
Are water play features replacing pools in large US cities?
Sum of TPL 2026 splash pads vs sum of pools; count of cities where splash pads exceed poolsInputs: D137 and the TPL splash pad definition row
Limitations: A cross-section, not a replacement count; splash pads serve mostly younger children and do not offer swimming.
New in this edition
- Trust for Public Land released the 2026 City Park Facts data tables (methodology updated May 2026), with 1,354 pools across 99 cities (TPL).
- The Census Bureau released Vintage 2025 city population estimates for July 1, 2025, used here in place of TPL’s Esri populations (Census Bureau).
- TPL published the 2026 ParkScore index; its seven amenity measures include splash pads but not swimming pools (TPL).
- NRPA released the 2026 Agency Performance Review: 53% of agencies have outdoor pools, median 48,461 residents per pool (NRPA).
- Philadelphia began opening more than 60 outdoor pools on June 12, 2026, with 7 closed for $70 million in capital work; San Antonio opened 23 free outdoor pools from June 20, 2026, with Cassiano Pool closed for construction (City of Philadelphia; City of San Antonio).
- Fort Wayne, IN announced its city pools would close for the season on August 1, 2026 because returning-to-school staff left it short of required lifeguards (WPTA 21Alive, Tier 3).
- Between the 2025 and 2026 TPL editions, 11 cities reported more pools and 12 fewer; Detroit went from 1 to 8, Houston from 42 to 45 and Los Angeles from 61 to 58 (TPL data tables).
What people ask
Which city has the most public pools?
Chicago has the most public pools of any large US city, with 78 in Trust for Public Land’s 2026 count, followed by Philadelphia (73) and New York (69) (Trust for Public Land). Per resident, Cleveland leads with 10.73 pools per 100,000 residents.
How many public pools are in the US?
CDC cited an estimated 309,000 public aquatic venues in the United States in 2011, a count of all public aquatic venues, including apartment, hotel and club settings (CDC). Park-system pools are a small share: TPL counted 1,354 in 99 of the largest US cities in 2026 (Trust for Public Land). See number of swimming pools in the US.
Why are public pools closing?
The cities documented here cite repairs, cost and lifeguard staffing. Philadelphia kept 7 pools closed in 2026 for $70 million in capital work (City of Philadelphia), Lubbock replaced its pools with splash pads after a 2022 council vote (KCBD, Tier 3) and Fort Wayne ended its 2026 pool season on August 1 for lack of lifeguards (WPTA 21Alive, Tier 3). Across 88 large US cities, though, TPL’s counts rose 2.4% from the 2018 to the 2026 edition.
How many people does one public pool serve?
In 2026 the median large US city with at least one public pool has one pool per 54,034 residents, on Census July 1, 2025 populations (Trust for Public Land). NRPA’s 2026 median is 48,461 residents per outdoor pool across all agencies (NRPA).
Are public pools free?
Some are. New York (NYC Parks), Philadelphia (City of Philadelphia) and San Antonio (City of San Antonio) offer free outdoor pools in 2026. Pittsburgh charges a daily fee or sells a pool tag (City of Pittsburgh), and Davenport, IA charges $5 for public swim (City of Davenport).
Common questions
What counts as a public pool in this data?
Trust for Public Land counts indoor and outdoor pools with a minimum four-foot depth run by any public or private park organization in the city (Trust for Public Land). Wading pools and splash pads are excluded, which is why New York’s 2026 count is 69 while the NYC Council lists 91 NYC Parks pools (New York City Council).
Which large US city has the fewest public pools per resident?
Among cities with at least one pool, Madison, WI has the fewest: 1 pool, or 0.35 per 100,000 residents, in 2026 (Trust for Public Land). Five cities, including Anaheim and Lubbock, reported zero qualifying pools.
How many public pools does New York City have?
TPL’s 2026 count for New York is 69 pools at least 4 ft deep, or 0.8 per 100,000 residents (Trust for Public Land). The NYC Council’s data team lists 91 pools at 64 NYC Parks locations, including wading and mini pools, and 18 council districts with no pool (New York City Council, 2023).
How many public pools does Los Angeles have?
Los Angeles reported 58 public pools in TPL’s 2026 edition, down from 66 in the 2018 edition, or 1.5 per 100,000 residents (TPL).
Do hot cities like Phoenix have more public pools?
Not per resident. Phoenix had 29 public pools in 2026, 1.74 per 100,000 residents, below the 1.85 median, despite 232 swim-season days a year at its airport (Trust for Public Land; Swim Season Index).
Is the number of public pools in big cities falling?
Not in TPL’s counts. The same 88 large US cities reported 1,252 pools in the 2018 edition and 1,282 in 2026, while pools per 100,000 residents moved from 2.09 to 2.08 (TPL). 29 of those cities did report fewer pools.
Are splash pads replacing public pools?
Splash pads are now more numerous than pools in large US cities: 2,062 vs 1,354 in TPL’s 2026 tables, with splash pads ahead in 41 of 99 cities (Trust for Public Land). Lubbock is a documented case of pools being replaced by splash pads (The Texas Tribune, Tier 3).
Why does this report use Census populations instead of TPL's?
TPL’s tables use Esri 2025 block-group estimates (TPL). This report uses the Census Bureau’s Vintage 2025 estimates for July 1, 2025, released May 14, 2026 (Census Bureau). The median difference is -0.3%.
Does TPL's ParkScore ranking include swimming pools?
No. The 2026 ParkScore index, released May 20, 2026, scores seven amenities including splash pads, but not swimming pools (TPL). Pool counts come from TPL’s separate City Park Facts tables.
How often is public pool data by city updated?
Trust for Public Land compiles City Park Facts each year (TPL). The 2026 survey ran from October 2025 to January 30, 2026 and covered 582 organizations (TPL methodology).
Method and data notes
- Downloaded the Trust for Public Land City Park Facts 2026 data tables and the archive of earlier editions (2010 to 2026) from TPL’s ParkServe downloads page; read the ‘Swimming pools’ sheet of each edition from 2016 and 2018 to 2026.
- Kept TPL’s pool counts as published for 99 cities in 2026 (Las Vegas, NV has no pool row). Harmonized older place labels (for example ‘Charlotte/Mecklenburg, NC’) to the 2026 names.
- Matched each TPL geography to the Census Bureau’s Vintage 2025 estimate for July 1, 2025: incorporated places and consolidated cities from SUB-EST2025, and Honolulu, Mecklenburg and Arlington (VA) counties from CO-EST2025.
- Computed pools per 100,000 residents and residents per pool for every city, and ranked the 94 cities with at least one pool.
- Built a balanced panel of 88 cities with a pool count in all nine editions from 2018 to 2026 to measure change without city-list effects.
- Joined cities to the PC&S Swim Season Index (NOAA NCEI 1991-2020 normals) by metro and computed a Spearman rank correlation and season-band rates.
- Compared medians with the NRPA 2026 Agency Performance Review, and checked TPL counts against pool lists on city park department pages opened on 2026-10-05.
Included: Pool counts from TPL City Park Facts (Tier 2), population from the Census Bureau (Tier 1), benchmarks from NRPA (Tier 2), climate from NOAA normals via the PC&S index (Tier 1), and city government pages (Tier 1). Local reporting (Texas Tribune, KCBD, WPTA 21Alive, Marketplace) is used only for closure context and flagged Tier 3.
Excluded: Market research, unsourced listicles and pages without a primary source were excluded. Statista’s 2024 chart (paywalled), a Swimply blog built on 2023 TPL data and a 2014-based podcast page were opened as competing pages but not used as sources. See excluded.md.
Conflicting numbers: Where a city’s own pool list differs from TPL’s count, both are shown with what each covers (New York, Philadelphia, Pittsburgh, Baltimore, San Antonio, San Jose). San Jose’s 2026 zero conflicts with the city’s 2026 pool list and is treated as a reporting gap; its rate is not ranked.
Derived metrics: All rates, medians, panel totals, correlations and band averages are computed by scripts in scripts/ (parse_tpl.py, build.py, make_facts.py) from the raw files in raw/, and logged in derived.csv with their input rows.
Caveats
- TPL data is self-reported by park organizations; 19% of organizations reused prior-year data in 2026.
- TPL counts exclude wading pools, pools under 4 ft and pools run by organizations outside its survey of park agencies and park nonprofits (for example hotels, apartment complexes and homeowners associations).
- Year-to-year changes for single cities often reflect reporting changes rather than openings or closures.
- TPL’s 2026 pool table omits some large cities that appeared in earlier editions (for example Columbus, OH and Indianapolis, IN), and Las Vegas has no 2026 pool count.
- Climate comparisons are associations at metro level and cover 74 of the 94 cities with pools.
- NRPA and TPL measure different units (agency outdoor pools vs all pools in a city).
Method last reviewed October 5, 2026.
For reporters and researchers
Quotable statistics
- Cleveland had 10.73 public swimming pools per 100,000 residents in 2026, the most of any large US city (Trust for Public Land counts, Census 2025 population). (Trust for Public Land)
- The median large US city had one public pool for every 54,034 residents in 2026. (Trust for Public Land)
- Chicago had 78 public pools in 2026, more than any other large US city. (Trust for Public Land)
- Madison, WI had one public pool for 286,233 residents in 2026, the lowest access among large US cities with at least one pool. (Trust for Public Land)
- In 88 large US cities, public pool counts rose 2.4% between TPL’s 2018 and 2026 editions while population rose 2.8%. (Trust for Public Land)
- Large US cities had 2,062 splash pads and 1,354 swimming pools in 2026, per Trust for Public Land. (Trust for Public Land)
- Warm-climate US metros do not have more public pools per resident: 180-plus swim-season-day metros average 2.44 pools per 100,000 vs 2.69 in metros with 100 to 179 days (2026). (NOAA National Centers for Environmental Information)
Best-sourced figures
- City Park Facts 2026: Amenities & Facilities data tables (Swimming pools, Splashpads), Trust for Public Land
- City Park Facts data tables 2010 to 2026 (archive, incl. 2016 to 2018 reports), Trust for Public Land
- Vintage 2025 sub-county population estimates (SUB-EST2025), U.S. Census Bureau
- 2026 NRPA Agency Performance Review, National Recreation and Park Association
- Public Swimming Pools in NYC (Data Team), New York City Council
- Philadelphia Parks & Recreation 2026 public pool opening schedule, City of Philadelphia
150-word brief
Public pool access in large US cities varies about 30-fold, according to a Pool Construction & Service analysis of Trust for Public Land’s 2026 City Park Facts and Census Bureau population estimates for July 1, 2025. Cleveland has 10.73 public pools per 100,000 residents, followed by Pittsburgh (7.8) and Cincinnati (7.63). Madison, WI (0.35), Fremont, CA and Fort Worth, TX have the lowest nonzero rates, and 13 of 94 cities with pools fall below 1 per 100,000. Chicago has the most pools in total, 78. The median city has one pool per 54,034 residents. Across 88 cities tracked since TPL’s 2018 edition, pool counts rose 2.4%, roughly matching population growth, so per-resident access was flat, at 2.09 to 2.08 pools per 100,000. Warmer metros do not have more pools per resident. Splash pads (2,062) now outnumber pools (1,354) in these cities. Cities that closed pools cite repair backlogs, such as Philadelphia’s $70 million program, and lifeguard shortages.
Possible headlines
- Cleveland Leads Large US Cities With 10.73 Public Pools per 100,000 Residents
- Median Big US City Has One Public Pool per 54,034 Residents
- 13 Large US Cities Have Fewer Than One Public Pool per 100,000 People
- Public Pool Counts in 88 Big US Cities Rose 2.4% Since 2018, Slightly Behind Population
- Splash Pads Now Outnumber Public Pools in 41 Large US Cities
Citation
Pool Construction & Service. "Public Pools by City: Pools per Resident in 99 Large US Cities, 2026." PC&S Research Desk, October 5, 2026. https://poolconstructionandservice.com/research/public-pools-by-city/
License
The data tables and charts in this report are licensed under CC BY 4.0. Reuse them with this attribution: “Source: Pool Construction & Service (poolconstructionandservice.com), Public Pools by City: Pools per Resident in 99 Large US Cities, 2026.” Figures from third-party sources remain subject to their publishers’ terms.
Datasets
- Public pools by city: counts, rates and residents per pool, 99 large US cities, 2026 CSV
- Public pools in large US cities by TPL edition, 2018 to 2026 CSV
- Cities with a changed pool count, 2018 vs 2026 editions CSV
- Pools per 100,000 residents by swim-season band, 2026 CSV
- Residents per pool: TPL cities vs NRPA medians CSV
- City-published pool counts and admission vs TPL, 2023 to 2026 CSV
- Full fact sheet with sources and limitations CSV
Evidence tiers
Tier 1: primary and government sources (18)
- U.S. Census Bureau: Vintage 2025 sub-county population estimates (SUB-EST2025)
- U.S. Census Bureau: Vintage 2025 county population estimates (CO-EST2025-ALLDATA)
- U.S. Census Bureau: Largest Cities Faced Sharpest Declines in Population Growth (May 14, 2026)
- U.S. Census Bureau: City and Town Population Totals: 2020-2025
- Centers for Disease Control and Prevention: Immediate Closures and Violations Identified During Routine Inspections of Public Aquatic Facilities (MMWR SS 65(5), 2016)
- NOAA National Centers for Environmental Information: U.S. Climate Normals 1991-2020 (via PC&S Swim Season Index)
- New York City Council: Public Swimming Pools in NYC (Data Team)
- NYC Parks: Outdoor Pools (Wayback Machine capture, Oct 1, 2026)
- City of Philadelphia: Philadelphia Parks & Recreation 2026 public pool opening schedule
- City of Philadelphia: 2026 Philadelphia public pool closings schedule
- City of Philadelphia: Philadelphia 2025 public pool opening schedule
- City of Philadelphia: Philadelphia 2024 public pool opening schedule
- City of Philadelphia: Find a swimming pool
- City of Pittsburgh: Aquatics (CitiParks)
- Baltimore City Recreation and Parks: Pools (Wayback Machine capture, July 28, 2026)
- City of San Antonio: 23 Outdoor City Pools Opening for Summer Season (June 10, 2026)
- City of San Jose: Swimming and Pools
- City of Davenport: Pools and Splash Parks (aquatic centers)
Tier 2: trade bodies, public companies, market research (9)
- Trust for Public Land: City Park Facts 2026: Amenities & Facilities data tables (Swimming pools, Splashpads)
- Trust for Public Land: City Park Facts (2026 data and downloads)
- Trust for Public Land: City Park Fact Survey 2025-2026 Methodology Notes (updated May 2026)
- Trust for Public Land: City Park Facts 2026: Acreage & Park System Highlights (City Population Stats)
- Trust for Public Land: City Park Facts data tables 2010 to 2026 (archive, incl. 2016 to 2018 reports)
- Trust for Public Land (via GlobeNewswire): ParkScore 2026 rankings press release (May 20, 2026)
- Trust for Public Land: ParkScore Index 2026 FINAL (ranking table)
- National Recreation and Park Association: 2026 NRPA Agency Performance Review
- National Recreation and Park Association: New Benchmarking Report Shows One Park per 2,437 Residents (June 3, 2026)
Tier 3: journalism and expert commentary (4)
- The Texas Tribune: Just as the temperature climbs, Texas towns are closing public pools to cut costs (July 11, 2024)
- KCBD: Lubbock splash pads on track to open summer 2024 (May 31, 2024)
- WPTA 21Alive: City pools in Fort Wayne set to close for the season this weekend (July 28, 2026)
- Marketplace: Public swimming pools, by the numbers (Sep 18, 2023)
References
- Trust for Public Land. City Park Facts 2026: Amenities & Facilities data tables (Swimming pools, Splashpads). Accessed 2026-10-05.
- Trust for Public Land. City Park Facts (2026 data and downloads). Accessed 2026-10-05.
- Trust for Public Land. City Park Fact Survey 2025-2026 Methodology Notes (updated May 2026). Accessed 2026-10-05.
- Trust for Public Land. City Park Facts 2026: Acreage & Park System Highlights (City Population Stats). Accessed 2026-10-05.
- Trust for Public Land. City Park Facts data tables 2010 to 2026 (archive, incl. 2016 to 2018 reports). Accessed 2026-10-05.
- Trust for Public Land (via GlobeNewswire). ParkScore 2026 rankings press release (May 20, 2026). Accessed 2026-10-05.
- Trust for Public Land. ParkScore Index 2026 FINAL (ranking table). Accessed 2026-10-05.
- U.S. Census Bureau. Vintage 2025 sub-county population estimates (SUB-EST2025). Accessed 2026-10-05.
- U.S. Census Bureau. Vintage 2025 county population estimates (CO-EST2025-ALLDATA). Accessed 2026-10-05.
- U.S. Census Bureau. Largest Cities Faced Sharpest Declines in Population Growth (May 14, 2026). Accessed 2026-10-05.
- U.S. Census Bureau. City and Town Population Totals: 2020-2025. Accessed 2026-10-05.
- National Recreation and Park Association. 2026 NRPA Agency Performance Review. Accessed 2026-10-05.
- National Recreation and Park Association. New Benchmarking Report Shows One Park per 2,437 Residents (June 3, 2026). Accessed 2026-10-05.
- Centers for Disease Control and Prevention. Immediate Closures and Violations Identified During Routine Inspections of Public Aquatic Facilities (MMWR SS 65(5), 2016). Accessed 2026-10-05.
- NOAA National Centers for Environmental Information. U.S. Climate Normals 1991-2020 (via PC&S Swim Season Index). Accessed 2026-10-05.
- New York City Council. Public Swimming Pools in NYC (Data Team). Accessed 2026-10-05.
- NYC Parks. Outdoor Pools (Wayback Machine capture, Oct 1, 2026). Accessed 2026-10-05.
- City of Philadelphia. Philadelphia Parks & Recreation 2026 public pool opening schedule. Accessed 2026-10-05.
- City of Philadelphia. 2026 Philadelphia public pool closings schedule. Accessed 2026-10-05.
- City of Philadelphia. Philadelphia 2025 public pool opening schedule. Accessed 2026-10-05.
- City of Philadelphia. Philadelphia 2024 public pool opening schedule. Accessed 2026-10-05.
- City of Philadelphia. Find a swimming pool. Accessed 2026-10-05.
- City of Pittsburgh. Aquatics (CitiParks). Accessed 2026-10-05.
- Baltimore City Recreation and Parks. Pools (Wayback Machine capture, July 28, 2026). Accessed 2026-10-05.
- City of San Antonio. 23 Outdoor City Pools Opening for Summer Season (June 10, 2026). Accessed 2026-10-05.
- City of San Jose. Swimming and Pools. Accessed 2026-10-05.
- City of Davenport. Pools and Splash Parks (aquatic centers). Accessed 2026-10-05.
- The Texas Tribune. Just as the temperature climbs, Texas towns are closing public pools to cut costs (July 11, 2024). Accessed 2026-10-05.
- KCBD. Lubbock splash pads on track to open summer 2024 (May 31, 2024). Accessed 2026-10-05.
- WPTA 21Alive. City pools in Fort Wayne set to close for the season this weekend (July 28, 2026). Accessed 2026-10-05.
- Marketplace. Public swimming pools, by the numbers (Sep 18, 2023). Accessed 2026-10-05.
Related pool research
Public Pool Inspection Violations: Closure Rates and Most Common Citations in Six US Jurisdictions, 2019 to 2026
Pool Operator Certification Requirements by State: 2026 Matrix of Operator, Lifeguard and Inspection Rules
Swimming Participation Statistics: Who Swims in the US, How Often and for How Long, 2003 to 2025
Public Pool Admission Prices in 33 Large US Cities, 2026
Vacation Rentals With Pools: Share and Nightly Premium in 18 US Airbnb Markets (2026)
Pool Industry Market Size: US Revenue Estimates Reconciled, 2017 to 2026
All pool industry research (40 reports)