How Many Homes Have a Hot Tub? US State Atlas of Hot Tub and Spa Ownership, 2024
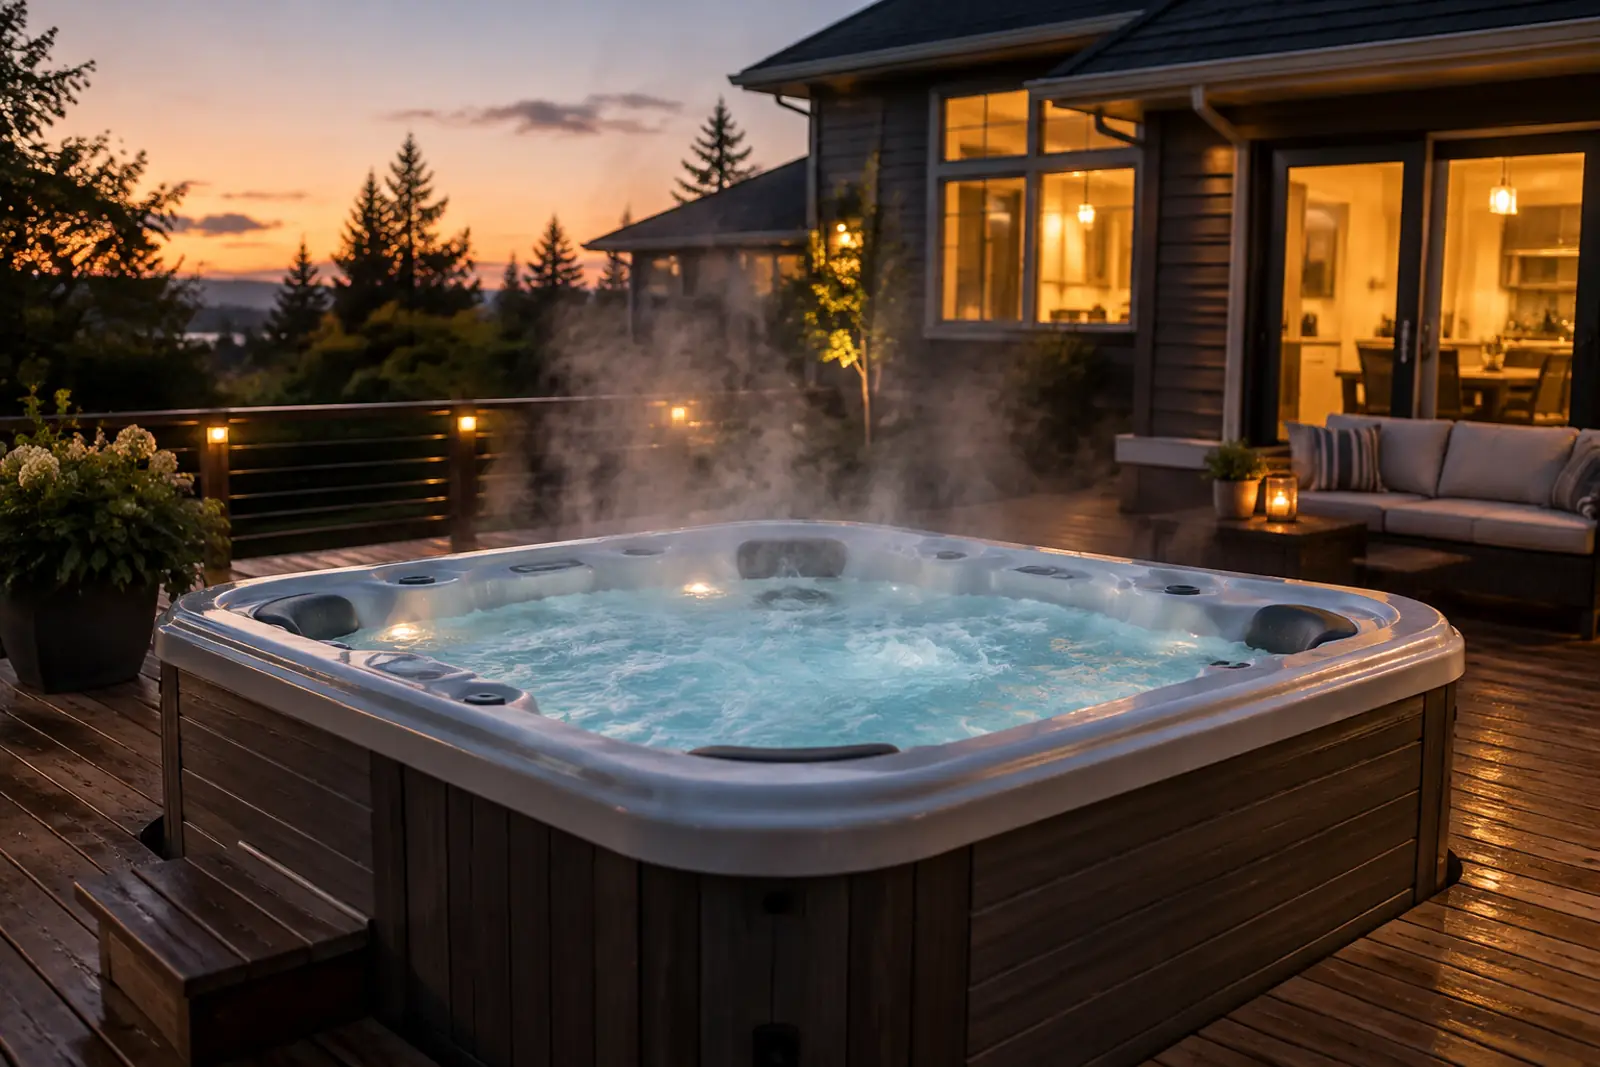
How many homes have a hot tub in the US: 10.1 million in 2024 (7.6% of occupied homes), per EIA's preliminary survey of any home hot tub, spa or Jacuzzi. That roughly equals the 9.6 million homes with a pool. About 31% of those tubs sat unused in the past year. Washington (12.6%) and Nevada (12.3%) lead the states.
Hot tub ownership by state, 2024
The share of homes with a hot tub ranges from about 3.5% in Kentucky to 12.6% in Washington in EIA’s 2024 survey, and the high-share states cluster in the West. State estimates rest on small samples, so the map should be read in tiers rather than as an exact ranking.
State estimates rest on 10 to 102 sample hot tub homes each; standard errors are in the state table.
Source: EIA RECS 2024 preliminary microdata, PC&S tabulation. Download chart data (CSV)
Seven states had a 2024 hot tub share significantly above the US figure of 7.6% at 90% confidence: Washington (12.6%), Nevada (12.3%), Montana (12.2%), Arizona (11.8%), Utah (11.7%), California (10.8%) and Florida (10.0%) (EIA RECS 2024 microdata, PC&S tabulation).
Six states with publishable estimates were significantly below the US figure in 2024: Pennsylvania (5.8%), North Carolina (5.5%), New York (4.9%), Arkansas (4.6%), Massachusetts (4.1%) and Kentucky (3.5%) (EIA RECS 2024 microdata).
By count, California had about 1.49 million homes with a hot tub in 2024, Florida about 915,000 and Texas about 811,000 (EIA RECS 2024 microdata). These three states held about 32% of US hot tub homes.
| state | state_name | homes_with_hot_tub_2024 | pct_homes_2024 | se_pts_2024 | rse_count_2024 | reliability_2024 | sample_hot_tub_homes_2024 | pct_homes_2020 | change_pts_2020_2024 | change_test_90pct | vs_us_average_2024 |
|---|---|---|---|---|---|---|---|---|---|---|---|
| WA | Washington | 398000 | 12.6 | 1.85 | 14.7 | reliable | 43 | 9.2 | 3.4 | not significant | above US (90%) |
| NV | Nevada | 152000 | 12.3 | 2.1 | 17.1 | reliable | 36 | 12.5 | -0.2 | not significant | above US (90%) |
| MT | Montana | 57000 | 12.2 | 1.67 | 13.7 | reliable | 40 | 8.7 | 3.5 | not significant | above US (90%) |
| AZ | Arizona | 351000 | 11.8 | 1.42 | 12.0 | reliable | 56 | 8.9 | 2.9 | significant at 90% | above US (90%) |
| UT | Utah | 138000 | 11.7 | 2.1 | 18.0 | reliable | 24 | 9.7 | 2.0 | not significant | above US (90%) |
| AK | Alaska | 30000 | 11.0 | 2.22 | 20.2 | reliable | 26 | 6.6 | 4.4 | significant at 90% | not different from US |
| CA | California | 1494000 | 10.8 | 1.18 | 10.9 | reliable | 102 | 9.5 | 1.3 | not significant | above US (90%) |
| FL | Florida | 915000 | 10.0 | 1.25 | 12.5 | reliable | 54 | 9.6 | 0.4 | not significant | above US (90%) |
| OR | Oregon | 171000 | 9.9 | 1.65 | 16.8 | reliable | 30 | 10.3 | -0.4 | not significant | not different from US |
| ID | Idaho | 71000 | 9.4 | 1.69 | 17.9 | reliable | 23 | 9.7 | -0.3 | not significant | not different from US |
| DE | Delaware | 38000 | 9.1 | 2.1 | 23.0 | reliable | 16 | Q | not shown (suppressed in a year) | not different from US | |
| IL | Illinois | 458000 | 9.0 | 1.68 | 18.7 | reliable | 33 | 6.0 | 3.0 | not significant | not different from US |
| WY | Wyoming | 23000 | 9.0 | 2.0 | 22.3 | reliable | 22 | 8.5 | 0.5 | not significant | not different from US |
| MN | Minnesota | 206000 | 8.7 | 2.02 | 23.2 | reliable | 20 | 6.8 | 1.9 | not significant | not different from US |
| MD | Maryland | 206000 | 8.6 | 1.53 | 17.9 | reliable | 30 | 8.6 | 0.0 | not significant | not different from US |
| SD | South Dakota | 33000 | 8.6 | 1.86 | 21.7 | reliable | 18 | 7.5 | 1.1 | not significant | not different from US |
| OK | Oklahoma | 137000 | 8.6 | 1.8 | 21.0 | reliable | 24 | 7.5 | 1.1 | not significant | not different from US |
| ND | North Dakota | 29000 | 8.2 | 1.56 | 19.0 | reliable | 23 | 7.2 | 1.0 | not significant | not different from US |
| SC | South Carolina | 182000 | 8.2 | 1.64 | 20.0 | reliable | 18 | 3.7 | 4.5 | significant at 90% | not different from US |
| NJ | New Jersey | 281000 | 7.9 | 1.24 | 15.6 | reliable | 39 | 6.7 | 1.2 | not significant | not different from US |
| KS | Kansas | 86000 | 7.1 | 2.03 | 28.5 | reliable | 13 | Q | not shown (suppressed in a year) | not different from US | |
| CO | Colorado | 176000 | 7.1 | 1.54 | 21.8 | reliable | 19 | 6.9 | 0.2 | not significant | not different from US |
| TX | Texas | 811000 | 7.1 | 0.78 | 11.0 | reliable | 69 | 8.4 | -1.3 | not significant | not different from US |
| NH | New Hampshire | 40000 | 7.1 | 1.71 | 24.2 | reliable | 17 | 7.4 | -0.3 | not significant | not different from US |
| TN | Tennessee | 203000 | 6.9 | 1.09 | 15.8 | reliable | 38 | 8.2 | -1.3 | not significant | not different from US |
| VT | Vermont | 19000 | 6.7 | 2.16 | 32.2 | use with caution | 12 | 7.8 | -1.1 | not significant | not different from US |
| OH | Ohio | 330000 | 6.7 | 1.38 | 20.5 | reliable | 25 | 6.2 | 0.5 | not significant | not different from US |
| NM | New Mexico | 56000 | 6.5 | 1.71 | 26.2 | reliable | 16 | 13.5 | -7.0 | significant at 90% | not different from US |
| MS | Mississippi | 77000 | 6.5 | 1.7 | 26.1 | reliable | 17 | 6.1 | 0.4 | not significant | not different from US |
| MI | Michigan | 270000 | 6.5 | 1.28 | 19.7 | reliable | 24 | 6.4 | 0.1 | not significant | not different from US |
| LA | Louisiana | 121000 | 6.5 | 1.56 | 23.8 | reliable | 19 | 4.7 | 1.8 | not significant | not different from US |
| WI | Wisconsin | 162000 | 6.4 | 1.99 | 31.2 | use with caution | 14 | 4.9 | 1.5 | not significant | not different from US |
| NE | Nebraska | 52000 | 6.3 | 1.73 | 27.2 | reliable | 15 | 4.7 | 1.6 | not significant | not different from US |
| MO | Missouri | 154000 | 6.0 | 1.32 | 21.9 | reliable | 17 | 4.4 | 1.6 | not significant | not different from US |
| IN | Indiana | 163000 | 5.9 | 1.16 | 19.9 | reliable | 18 | 5.8 | 0.1 | not significant | not different from US |
| CT | Connecticut | 86000 | 5.9 | 1.25 | 21.0 | reliable | 26 | 5.1 | 0.8 | not significant | not different from US |
| PA | Pennsylvania | 313000 | 5.8 | 0.99 | 17.0 | reliable | 35 | 5.6 | 0.2 | not significant | below US (90%) |
| RI | Rhode Island | 26000 | 5.8 | 1.56 | 27.0 | reliable | 13 | Q | not shown (suppressed in a year) | not different from US | |
| GA | Georgia | 245000 | 5.8 | 1.3 | 22.3 | reliable | 20 | 5.0 | 0.8 | not significant | not different from US |
| VA | Virginia | 198000 | 5.8 | 1.35 | 23.4 | reliable | 19 | 6.1 | -0.3 | not significant | not different from US |
| IA | Iowa | 76000 | 5.7 | 1.7 | 29.9 | reliable | 10 | 5.6 | 0.1 | not significant | not different from US |
| AL | Alabama | 116000 | 5.7 | 1.32 | 23.2 | reliable | 18 | 6.2 | -0.5 | not significant | not different from US |
| ME | Maine | 34000 | 5.6 | 1.58 | 28.4 | reliable | 12 | 7.3 | -1.7 | not significant | not different from US |
| NC | North Carolina | 245000 | 5.5 | 1.13 | 20.6 | reliable | 23 | 4.5 | 1.0 | not significant | below US (90%) |
| NY | New York | 383000 | 4.9 | 0.66 | 13.6 | reliable | 60 | 6.3 | -1.4 | not significant | below US (90%) |
| AR | Arkansas | 57000 | 4.6 | 1.42 | 31.0 | use with caution | 11 | 7.1 | -2.5 | not significant | below US (90%) |
| MA | Massachusetts | 116000 | 4.1 | 0.85 | 20.7 | reliable | 23 | 7.3 | -3.2 | significant at 90% | below US (90%) |
| KY | Kentucky | 66000 | 3.5 | 0.99 | 28.1 | reliable | 14 | 5.7 | -2.2 | not significant | below US (90%) |
| WV | West Virginia | Q | Q | 55.2 | suppressed | 5 | 4.4 | not shown (suppressed in a year) | |||
| DC | District of Columbia | Q | Q | 32.7 | suppressed | 9 | Q | not shown (suppressed in a year) | |||
| HI | Hawaii | Q | Q | 49.2 | suppressed | 4 | 6.8 | not shown (suppressed in a year) |
Source: PC&S tabulation of EIA RECS 2024 microdata (preliminary) and EIA RECS 2020 microdata; Q = withheld under EIA’s rule (fewer than 10 sample homes or RSE above 50%). Download CSV
How many homes have a hot tub: the national count, 2020 and 2024
EIA’s Residential Energy Consumption Survey (RECS) asks every sampled household, apartments included, whether the home has its own hot tub. It counted 8.84 million US homes with one in 2020 and 10.08 million in 2024, but the share of homes barely moved and the rise is within sampling error.
- US homes with a hot tub, 2024: 10.08 million of 132.54 million occupied homes, 7.6% (SE 0.24 points) (EIA RECS 2024, preliminary).
- US homes with a hot tub, 2020: 8.84 million of 123.53 million, 7.2% (SE 0.18 points) (EIA RECS 2020, final).
- Change 2020 to 2024: +1.25 million homes and +0.45 percentage points; z = 1.5, not significant at 90% (EIA RECS 2024 microdata). Part of the count growth reflects 9.0 million more occupied US homes in 2024.
- Single-family detached homes, 2024: 10.5% had a hot tub; single-family attached 4.0%; apartments in 2 to 4 unit buildings 2.7%; apartments in 5+ unit buildings 2.5%; mobile homes 3.1% (EIA RECS 2024 microdata).
- Owner-occupied homes, 2024: 10.1% had a hot tub; renter-occupied homes 2.4%, about 1.0 million rented homes (EIA RECS 2024 microdata).
Sample sizes behind the national estimates are large: 1,312 of 16,676 sampled households reported a hot tub in the 2024 file and 1,429 of 18,496 in the 2020 file (EIA RECS microdata). EIA describes the 2024 file as reflecting “preliminary household characteristics data” (EIA).
Hot tubs vs pools: which is more common in US homes
Nationally, hot tubs and private pools are about equally common, and which one looks ahead depends on whether apartments are counted. Regionally the two diverge sharply: pools dominate the Sun Belt and hot tubs dominate the cold Mountain states.
Across all occupied US homes in 2024, 10.08 million had a hot tub and 9.60 million had a pool; the 0.48 million difference has a standard error of 0.41 million, so it is not significant (EIA RECS 2024 microdata). The pool figure matches the PC&S report on the percentage of homes with pools.
Counting houses only (single-family and mobile homes, the only homes RECS asks about pools), 9.19 million US houses had a hot tub in 2024 against 9.60 million pool homes, about 0.96 hot tubs per pool, again within sampling error (EIA RECS 2024 microdata).
Hot tubs and pools often sit together: 2.84 million US homes had both in 2024, 29.5% of pool homes had a hot tub, and 28.1% of hot tub homes had a pool (EIA RECS 2024 microdata). Combined, 16.85 million US homes, 12.7%, had at least one of the two (EIA RECS 2024 microdata).
Source: EIA RECS 2024 preliminary microdata, PC&S tabulation. Download chart data (CSV)
| state | state_name | pct_houses_with_hot_tub_2024 | pct_houses_with_pool_2024 | houses_with_hot_tub_per_pool_home_2024 | ratio_se | more_common_at_90pct | pool_reliability_2024 |
|---|---|---|---|---|---|---|---|
| IL | Illinois | 11.8 | 5.2 | 2.29 | 0.76 | hot tubs | reliable |
| MD | Maryland | 8.7 | 4.0 | 2.2 | 0.78 | no clear difference | reliable |
| DE | Delaware | 11.0 | 6.6 | 1.67 | 0.69 | no clear difference | use with caution |
| MO | Missouri | 7.4 | 5.1 | 1.47 | 0.68 | no clear difference | use with caution |
| MI | Michigan | 7.9 | 6.3 | 1.26 | 0.38 | no clear difference | reliable |
| MS | Mississippi | 7.6 | 6.1 | 1.24 | 0.51 | no clear difference | reliable |
| SC | South Carolina | 9.8 | 8.7 | 1.12 | 0.38 | no clear difference | reliable |
| OK | Oklahoma | 9.6 | 8.7 | 1.11 | 0.3 | no clear difference | reliable |
| ME | Maine | 7.1 | 6.5 | 1.09 | 0.39 | no clear difference | reliable |
| NC | North Carolina | 6.2 | 5.8 | 1.07 | 0.33 | no clear difference | reliable |
| IN | Indiana | 7.2 | 6.8 | 1.05 | 0.33 | no clear difference | reliable |
| TN | Tennessee | 8.6 | 8.4 | 1.03 | 0.19 | no clear difference | reliable |
| AL | Alabama | 6.0 | 5.9 | 1.01 | 0.37 | no clear difference | reliable |
| CA | California | 14.3 | 14.3 | 1.0 | 0.11 | no clear difference | reliable |
| AR | Arkansas | 5.5 | 5.7 | 0.97 | 0.45 | no clear difference | use with caution |
| NV | Nevada | 15.3 | 16.1 | 0.95 | 0.16 | no clear difference | reliable |
| PA | Pennsylvania | 6.7 | 7.8 | 0.86 | 0.21 | no clear difference | reliable |
| GA | Georgia | 6.5 | 7.5 | 0.86 | 0.26 | no clear difference | reliable |
| NJ | New Jersey | 10.9 | 13.3 | 0.82 | 0.17 | no clear difference | reliable |
| TX | Texas | 8.5 | 10.9 | 0.78 | 0.09 | pools | reliable |
| NH | New Hampshire | 8.7 | 11.3 | 0.77 | 0.21 | no clear difference | reliable |
| OH | Ohio | 7.4 | 9.7 | 0.76 | 0.23 | no clear difference | reliable |
| VT | Vermont | 6.7 | 10.3 | 0.65 | 0.31 | no clear difference | reliable |
| LA | Louisiana | 7.3 | 11.5 | 0.63 | 0.16 | pools | reliable |
| MA | Massachusetts | 6.2 | 10.1 | 0.61 | 0.17 | pools | reliable |
| RI | Rhode Island | 8.5 | 14.2 | 0.6 | 0.21 | pools | reliable |
| CT | Connecticut | 8.5 | 14.7 | 0.58 | 0.13 | pools | reliable |
| AZ | Arizona | 13.1 | 23.7 | 0.55 | 0.07 | pools | reliable |
| NY | New York | 7.8 | 14.8 | 0.53 | 0.09 | pools | reliable |
| FL | Florida | 13.0 | 27.5 | 0.47 | 0.06 | pools | reliable |
| KY | Kentucky | 4.4 | 11.5 | 0.38 | 0.11 | pools | reliable |
Source: PC&S tabulation of EIA RECS 2024 microdata (preliminary). 17 states with reliable hot tub estimates, including Washington, Oregon, Utah, Colorado and Montana, are omitted because fewer than 10 sample homes reported a pool. Download CSV
Pools were significantly more common than hot tubs in nine states in 2024, led by Kentucky (0.38 hot tub houses per pool home), Florida (0.47), New York (0.53) and Arizona (0.55) (EIA RECS 2024 microdata). Illinois was the only state where hot tubs were significantly more common, at 2.29 per pool home (EIA RECS 2024 microdata).
Regional patterns: hot tub ownership by Census division
The West leads on hot tubs whether the climate is hot or cold: Mountain South, Pacific and Mountain North are the only divisions significantly above the US share. The Northeast and the East South Central states are significantly below it.
| division | pct_homes_with_hot_tub_2020 | pct_homes_with_hot_tub_2024 | se_pts_2024 | change_test_90pct | pct_homes_with_pool_2024 | houses_with_hot_tub_per_pool_home_2024 | ratio_se | pct_used_hot_tubs_electric_2024 |
|---|---|---|---|---|---|---|---|---|
| Mountain South | 10.6 | 11.0 | 0.97 | not significant | 14.3 | 0.69 | 0.07 | 63.7 |
| Pacific | 9.4 | 10.8 | 0.94 | not significant | 7.6 | 1.29 | 0.14 | 63.7 |
| Mountain North | 8.2 | 9.0 | 0.83 | not significant | 1.0 | 8.48 | 3.59 | 88.3 |
| South Atlantic | 6.7 | 7.5 | 0.46 | not significant | 9.6 | 0.71 | 0.06 | 78.5 |
| East North Central | 6.0 | 7.1 | 0.72 | not significant | 5.1 | 1.28 | 0.18 | 90.6 |
| West North Central | 5.3 | 7.0 | 0.68 | significant at 90% | 3.0 | 2.18 | 0.44 | 79.9 |
| West South Central | 7.8 | 7.0 | 0.63 | not significant | 7.9 | 0.8 | 0.08 | 68.0 |
| East South Central | 6.8 | 5.8 | 0.59 | not significant | 6.7 | 0.84 | 0.11 | 78.3 |
| Middle Atlantic | 6.2 | 5.8 | 0.47 | not significant | 7.2 | 0.69 | 0.08 | 84.3 |
| New England | 6.5 | 5.2 | 0.52 | not significant | 7.2 | 0.65 | 0.08 | 84.8 |
Source: PC&S tabulation of EIA RECS 2024 microdata (preliminary) and EIA RECS 2020 microdata. Download CSV
- Mountain South (Arizona, Nevada, New Mexico): 11.0% of homes had a hot tub in 2024 and 14.3% had a pool (EIA RECS 2024 microdata).
- Pacific (Alaska, California, Hawaii, Oregon, Washington): 10.8% hot tub, 7.6% pool in 2024 (EIA RECS 2024 microdata).
- Mountain North (Colorado, Idaho, Montana, Utah, Wyoming): 9.0% hot tub, 1.0% pool in 2024 (EIA RECS 2024 microdata).
- New England: 5.2% hot tub, 7.2% pool in 2024, the lowest hot tub share of the 10 divisions (EIA RECS 2024 microdata).
- West North Central was the only division with a significant 2020 to 2024 change, rising from 5.3% to 7.0% (EIA RECS 2024 microdata).
Older listing data point the same way on a few states: a 2015 analysis of about 1.5 million single-family listings found Nevada and Arkansas the states most likely to list a hot tub (Realtor.com). RECS 2024 confirms Nevada near the top but puts Arkansas below the US share at 4.6% (use with caution), a reminder that listings and occupied homes are different populations.
Hot tub heating fuel and how often hot tubs run
Most US hot tubs that run are electric, and the electric share grew between 2020 and 2024. A large minority of hot tubs, about three in ten, were not turned on at all in the past year, which matters for energy estimates and for anyone sizing the active market.
Source: EIA RECS 2020 and 2024 (preliminary) microdata, PC&S tabulation. Download chart data (CSV)
- Electricity heated 76.3% of US hot tubs used in the past year in 2024 (5.31 million homes), against 70.6% in 2020 (EIA RECS 2024 microdata; EIA RECS 2024).
- Natural gas heated 19.0% of used US hot tubs in 2024 (1.33 million homes), against 23.6% in 2020 (EIA RECS 2024 microdata).
- Propane heated 3.3% and fuel oil or other fuels 1.4% of used US hot tubs in 2024; the second figure has an RSE near 38% (EIA RECS 2024 microdata).
- The 5.7-point rise in the electric share from 2020 to 2024 has a standard error of 2.47 points (z = 2.31), significant at 95% (EIA RECS 2024 microdata, PC&S calculation).
| group | category | homes_million_2020 | pct_of_hot_tub_homes_2020 | pct_of_used_tubs_2020 | homes_million_2024 | pct_of_hot_tub_homes_2024 | pct_of_used_tubs_2024 | reliability_2024 |
|---|---|---|---|---|---|---|---|---|
| Heating fuel | Electricity | 4.406 | 49.8 | 70.6 | 5.311 | 52.7 | 76.3 | reliable |
| Heating fuel | Natural gas | 1.471 | 16.6 | 23.6 | 1.325 | 13.1 | 19.0 | reliable |
| Heating fuel | Propane | 0.246 | 2.8 | 3.9 | 0.228 | 2.3 | 3.3 | reliable |
| Heating fuel | Fuel oil or other | 0.116 | 1.3 | 1.9 | 0.098 | 1.0 | 1.4 | use with caution |
| Heating fuel | Not used in past year | 2.6 | 29.4 | 3.122 | 31.0 | reliable | ||
| Months used in past year | 0 months | 2.6 | 29.4 | 3.122 | 31.0 | reliable | ||
| Months used in past year | 1 to 3 | 1.617 | 18.3 | 2.119 | 21.0 | reliable | ||
| Months used in past year | 4 to 7 | 1.273 | 14.4 | 1.171 | 11.6 | reliable | ||
| Months used in past year | 8 to 11 | 0.628 | 7.1 | 0.651 | 6.5 | reliable | ||
| Months used in past year | 12 months | 2.722 | 30.8 | 3.021 | 30.0 | reliable |
Source: PC&S tabulation of EIA RECS 2024 microdata (preliminary) and EIA RECS 2020 microdata; totals match EIA RECS 2024 Table HC2.1. Download CSV
Fuel mix varies by region. Electricity heated 90.6% of used hot tubs in the East North Central division in 2024, while natural gas heated 33.1% in the Pacific division, 28.6% in West South Central and 26.3% in Mountain South (EIA RECS 2024 microdata). For the pool-side comparison of gas heaters and heat pumps, see the PC&S report on the cost to heat a pool.
Use is split: 31.0% of US hot tub homes did not turn the tub on in the past year, 21.0% ran it 1 to 3 months, 11.6% for 4 to 7 months, 6.5% for 8 to 11 months and 30.0% all 12 months (2024, EIA RECS 2024 microdata). That leaves about 6.96 million US homes with a hot tub that was used at least one month in the past year (PC&S calculation).
How much electricity a hot tub uses and what it costs in 2026
EIA’s latest end-use model, for 2020, puts an electrically heated hot tub at about 2,000 kWh a year and a year-round one at about 3,000 kWh. At January to July 2026 state electricity prices that is roughly $231 to $962 a year, depending mostly on the state’s price.
- Electric-heated US hot tubs used an average of 1,997 kWh in 2020 for the pump and heater combined (SE 52 kWh) (EIA RECS 2020 microdata, PC&S tabulation).
- Electric-heated US hot tubs used all 12 months averaged 3,004 kWh in 2020 (EIA RECS 2020 microdata).
- Gas-heated US hot tubs used about 3,929 thousand Btu of natural gas for heating plus 398 kWh of electricity for the pump in 2020 (EIA RECS 2020 microdata).
- Per household using each end use, US hot tub heaters averaged 1,479 kWh and hot tub pumps 484 kWh in 2020, against 2,384 kWh for pool pumps (EIA RECS 2020 Table CE5.3b).
- US hot tubs used about 9.5 billion kWh in 2020 (3.0 billion for pumps, 6.5 billion for heaters), about 0.49 times the 19.3 billion kWh used by pool pumps (EIA Table CE5.1b, PC&S calculation).
Average across hot tubs heated with electricity, including tubs used only part of the year. A tub run all 12 months used about 3,004 kWh in 2020.
Source: EIA RECS 2020 end-use microdata; EIA Electric Power Monthly Table 5.6.B (data through July 2026); PC&S calculation. Download chart data (CSV)
PC&S priced each state’s RECS division average for electric-heated hot tubs (2020 kWh) at the state’s average residential price for January to July 2026 (EIA Electric Power Monthly Table 5.6.B). The estimate ranges from about $231 a year in Louisiana to about $962 in Hawaii, with a median of $304 across the 50 states and DC. At the US average price of 18.19 cents per kWh, the average electric-heated hot tub costs about $363 a year and a year-round one about $546.
| state | state_name | recs_division | kwh_per_year_division_2020 | kwh_rse_pct | residential_cents_per_kwh_jan_jul_2026 | est_annual_cost_usd | est_annual_cost_at_us_avg_kwh_usd |
|---|---|---|---|---|---|---|---|
| HI | Hawaii | Pacific | 2078 | 5.9 | 46.28 | 962 | 924 |
| CA | California | Pacific | 2078 | 5.9 | 33.25 | 691 | 664 |
| AK | Alaska | Pacific | 2078 | 5.9 | 27.09 | 563 | 541 |
| NY | New York | Middle Atlantic | 1895 | 11.6 | 29.38 | 557 | 587 |
| MI | Michigan | East North Central | 2540 | 10.5 | 21.53 | 547 | 430 |
| MA | Massachusetts | New England | 1660 | 11.1 | 30.14 | 500 | 602 |
| ME | Maine | New England | 1660 | 11.1 | 29.99 | 498 | 599 |
| IL | Illinois | East North Central | 2540 | 10.5 | 19.22 | 488 | 384 |
| RI | Rhode Island | New England | 1660 | 11.1 | 29.22 | 485 | 584 |
| WI | Wisconsin | East North Central | 2540 | 10.5 | 19.0 | 483 | 379 |
| OH | Ohio | East North Central | 2540 | 10.5 | 18.7 | 475 | 373 |
| CT | Connecticut | New England | 1660 | 11.1 | 27.97 | 464 | 559 |
| NJ | New Jersey | Middle Atlantic | 1895 | 11.6 | 23.98 | 454 | 479 |
| NH | New Hampshire | New England | 1660 | 11.1 | 26.79 | 445 | 535 |
| DC | District of Columbia | South Atlantic | 1767 | 7.4 | 24.66 | 436 | 492 |
| IN | Indiana | East North Central | 2540 | 10.5 | 17.04 | 433 | 340 |
| PA | Pennsylvania | Middle Atlantic | 1895 | 11.6 | 21.04 | 399 | 420 |
| VT | Vermont | New England | 1660 | 11.1 | 23.95 | 398 | 478 |
| MD | Maryland | South Atlantic | 1767 | 7.4 | 21.3 | 376 | 425 |
| CO | Colorado | Mountain North | 2177 | 7.6 | 16.72 | 364 | 334 |
| MN | Minnesota | West North Central | 2082 | 7.9 | 16.25 | 338 | 325 |
| OR | Oregon | Pacific | 2078 | 5.9 | 15.4 | 320 | 308 |
| KS | Kansas | West North Central | 2082 | 7.9 | 15.21 | 317 | 304 |
| DE | Delaware | South Atlantic | 1767 | 7.4 | 17.86 | 316 | 357 |
| WY | Wyoming | Mountain North | 2177 | 7.6 | 13.95 | 304 | 279 |
| MT | Montana | Mountain North | 2177 | 7.6 | 13.95 | 304 | 279 |
| SD | South Dakota | West North Central | 2082 | 7.9 | 14.5 | 302 | 290 |
| WA | Washington | Pacific | 2078 | 5.9 | 14.4 | 299 | 288 |
| VA | Virginia | South Atlantic | 1767 | 7.4 | 16.83 | 297 | 336 |
| IA | Iowa | West North Central | 2082 | 7.9 | 14.2 | 296 | 284 |
| AZ | Arizona | Mountain South | 1896 | 11.4 | 15.44 | 293 | 308 |
| MO | Missouri | West North Central | 2082 | 7.9 | 13.96 | 291 | 279 |
| AL | Alabama | East South Central | 1759 | 12.4 | 16.54 | 291 | 330 |
| UT | Utah | Mountain North | 2177 | 7.6 | 13.16 | 286 | 263 |
| NM | New Mexico | Mountain South | 1896 | 11.4 | 15.08 | 286 | 301 |
| ID | Idaho | Mountain North | 2177 | 7.6 | 12.96 | 282 | 259 |
| SC | South Carolina | South Atlantic | 1767 | 7.4 | 15.93 | 281 | 318 |
| TX | Texas | West South Central | 1729 | 11.4 | 16.06 | 278 | 321 |
| WV | West Virginia | South Atlantic | 1767 | 7.4 | 15.47 | 273 | 309 |
| GA | Georgia | South Atlantic | 1767 | 7.4 | 15.4 | 272 | 308 |
| FL | Florida | South Atlantic | 1767 | 7.4 | 15.3 | 270 | 306 |
| NE | Nebraska | West North Central | 2082 | 7.9 | 12.9 | 269 | 258 |
| MS | Mississippi | East South Central | 1759 | 12.4 | 15.19 | 267 | 303 |
| NC | North Carolina | South Atlantic | 1767 | 7.4 | 14.94 | 264 | 298 |
| NV | Nevada | Mountain South | 1896 | 11.4 | 13.53 | 257 | 270 |
| ND | North Dakota | West North Central | 2082 | 7.9 | 12.36 | 257 | 247 |
| KY | Kentucky | East South Central | 1759 | 12.4 | 14.27 | 251 | 285 |
| TN | Tennessee | East South Central | 1759 | 12.4 | 13.87 | 244 | 277 |
| OK | Oklahoma | West South Central | 1729 | 11.4 | 13.58 | 235 | 271 |
| AR | Arkansas | West South Central | 1729 | 11.4 | 13.61 | 235 | 272 |
| LA | Louisiana | West South Central | 1729 | 11.4 | 13.35 | 231 | 267 |
Source: PC&S calculation from EIA RECS 2020 microdata end-use variables and EIA Electric Power Monthly Table 5.6.B (Jan to Jul 2026, preliminary). Download CSV
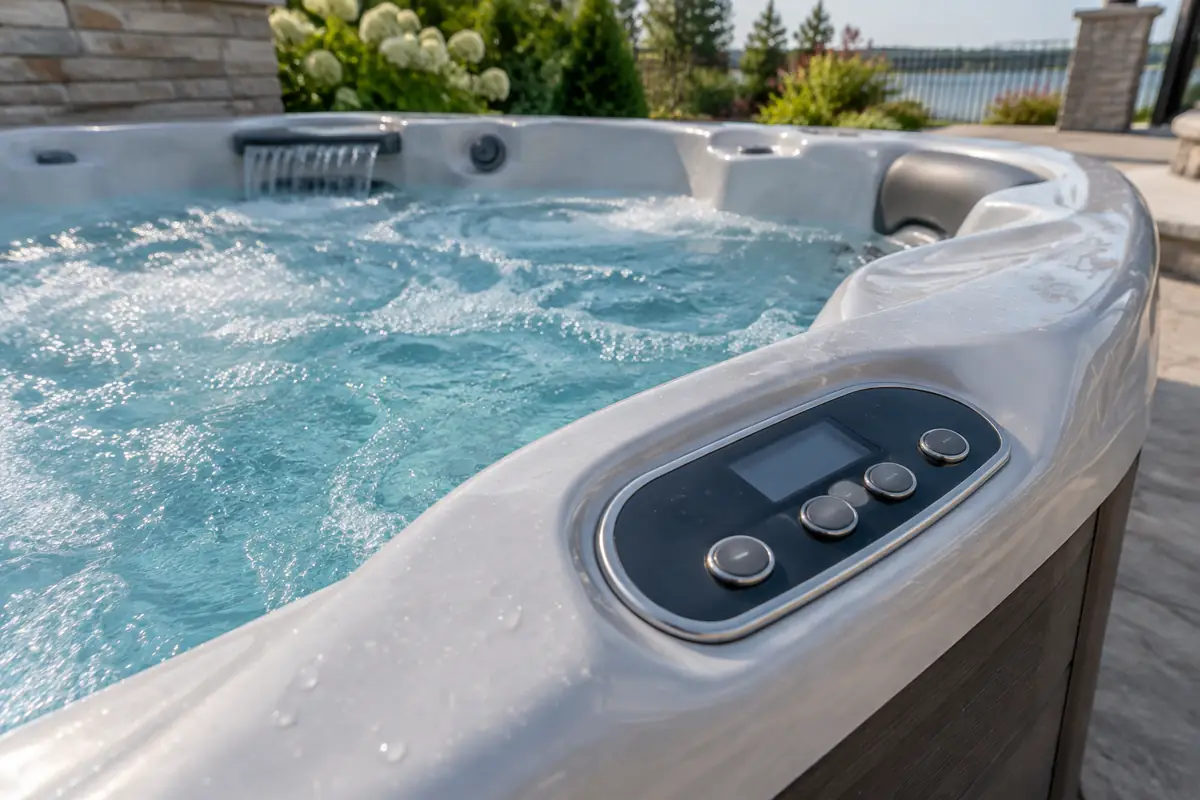
Standby rules give a second benchmark. California’s Title 20 limits normalized standby power for standard portable electric spas made since June 1, 2019 to 3.75 x V^(2/3) + 40 watts, where V is fill volume in gallons (20 CCR 1605.3(g)(7)). At that ceiling a 250-gallon spa may draw about 189 W, a 334-gallon spa about 221 W and a 500-gallon spa about 276 W, or about 1,654 to 2,420 kWh a year if held at test conditions all year (PC&S calculation). DOE separately estimated 1,699 kWh a year of standby energy for an average portable electric spa (87 FR 54123).
Why US hot tub counts disagree: 5.5 million vs 10.1 million
Industry sources usually cite about 5.5 million US hot tubs, while EIA counts 10.1 million homes with one. The gap mostly comes from what is counted: RECS includes idle tubs and gas-heated or built-in spas, while DOE’s industry-based figure excludes spas built into pools.
Source: EIA RECS; DOE (Federal Register 87 FR 54123); Leslie's 10-K; PC&S calculation. Download chart data (CSV)
| source | year | figure_million | what_is_counted | tier |
|---|---|---|---|---|
| EIA RECS 2024 (preliminary) | 2024 | 10.084 | Occupied primary homes with their own hot tub, spa or Jacuzzi (other than a bathtub), any housing type, used or not | 1 |
| EIA RECS 2024 (preliminary), PC&S calculation | 2024 | 6.962 | Same, excluding hot tubs turned on zero months in the past year | 1 |
| EIA RECS 2024 (preliminary) | 2024 | 5.311 | Hot tubs used in the past year and heated with electricity | 1 |
| EIA RECS 2020 (final) | 2020 | 8.839 | Occupied primary homes with their own hot tub, spa or Jacuzzi | 1 |
| DOE citing EIA RECS 2015 | 2015 | 8.4 | Installed base of spas in the US | 1 |
| DOE estimate from P.K. Data | 2019 | 5.5 | Residential hot tubs, excluding spas built into pools (about 95% electric) | 1 |
| PHTA/IHTA, California IOUs and ASAP via DOE | 2021 | 3.673 | Households operating portable electric spas regularly (RECS-based estimate) | 2 |
| Leslie's Form 10-K, fiscal 2025 | 2025 | 5.5 | Residential spas or hot tubs (company market estimate) | 2 |
Sources: EIA RECS 2024; EIA RECS 2020; DOE, 87 FR 54123; Leslie, Inc. Form 10-K FY2025; PC&S calculation. Download CSV
- Leslie’s, a pool and spa retailer, states that “the residential spa market consists of approximately 5.5 million spas or hot tubs” in its fiscal 2025 annual report (Leslie, Inc. 10-K).
- DOE, using P.K. Data, estimated about 5.5 million residential hot tubs in 2019, “separate from the stock of spas in residential pools”, about 95% of them electric (DOE, 87 FR 54123). That implies about 5.2 million electric hot tubs (PC&S calculation), close to the 5.31 million US homes that used an electrically heated hot tub in 2024 (EIA RECS 2024).
- DOE also cited RECS 2015 for an installed base of 8.4 million US spas in 2015 (DOE).
- A RECS-based estimate submitted to DOE by the hot tub trade associations, California utilities and ASAP put the number of US households operating portable electric spas regularly at 3.673 million (DOE, 87 FR 54123).
- Pool Corporation reports that the industry “services more than 14.0 million swimming pools and hot tubs in the United States” without splitting out hot tubs (Pool Corporation 10-K FY2025).
Hot tub efficiency rules: state standards and federal status
Hot tub efficiency is regulated by states, not by the federal government. California set the first standby limit and 13 other jurisdictions followed, while DOE’s attempt to cover portable electric spas has been proposed for withdrawal.
- California adopted the first state standard for portable electric spas in 2004, and 13 more jurisdictions have adopted standards: Arizona, Connecticut, Oregon, Washington, Vermont, Colorado, the District of Columbia, Massachusetts, New Jersey, Nevada, Rhode Island, Maine and Maryland (Appliance Standards Awareness Project).
- Washington requires portable electric spas to meet the California Title 20 section 1605.3 requirements in effect January 1, 2022, from January 1, 2024 (RCW 19.260.040).
- The District of Columbia requires portable electric spas to meet ANSI/APSP/ICC-14-2019 (DC DOEE).
- DOE determined on September 2, 2022 that portable electric spas are a covered consumer product, effective November 1, 2022 (87 FR 54123), and adopted a standby-loss test procedure on June 13, 2023 (88 FR 38600).
- DOE published data on potential standards on November 17, 2022 and January 16, 2025 (87 FR 69082; 90 FR 4605), then proposed on April 18, 2025 to withdraw coverage altogether (90 FR 16469).
ASAP estimates that a typical 334-gallon spa just meeting the most recent state standards uses more than 200 W of standby power, about 1,900 kWh a year (ASAP), consistent with the 1,932 kWh PC&S computes from the California formula. For hot tub installation as part of a pool project, see the PC&S page on spa construction.
The state picture in numbers
- Homes with a hot tub, United States, 2024: 10.08 million, 7.6% of occupied homes (EIA RECS 2024, Table HC2.1, preliminary).
- Homes with a hot tub, United States, 2020: 8.84 million, 7.2% of occupied homes (EIA RECS 2020, final).
- Single-family detached homes with a hot tub, United States, 2024: 10.5%, against 2.5% of apartments in buildings with 5 or more units (EIA RECS 2024 microdata).
- Owner-occupied US homes were about four times as likely as rented homes to have a hot tub in 2024: 10.1% vs 2.4% (EIA RECS 2024 microdata).
- 2.84 million US homes had both a hot tub and a pool in 2024, and 29.5% of US pool homes also had a hot tub (EIA RECS 2024 microdata).
- 16.85 million US homes, 12.7% of occupied homes, had a hot tub, a pool or both in 2024 (EIA RECS 2024 microdata).
- Mountain South (Arizona, Nevada, New Mexico) had the highest division share of homes with a hot tub in 2024 at 11.0%; New England had the lowest at 5.2% (EIA RECS 2024 microdata).
- Mountain North (Colorado, Idaho, Montana, Utah, Wyoming) had about 8.5 houses with a hot tub for every home with a pool in 2024, the widest ratio of any US division (EIA RECS 2024 microdata).
- Florida had about 0.47 houses with a hot tub per pool home in 2024 and Arizona 0.55, so pools clearly outnumber hot tubs in both states (EIA RECS 2024 microdata).
- Natural gas heated 19.0% of used US hot tubs in 2024 and 23.6% in 2020; the Pacific division had the highest gas share in 2024 at 33.1% (EIA RECS 2024 microdata).
- US hot tubs used about 9.5 billion kWh of electricity in 2020, about half the 19.3 billion kWh used by pool pumps (EIA RECS 2020 Table CE5.1b).
- Hot tub heaters averaged 1,479 kWh and hot tub pumps 484 kWh per US household using them in 2020 (EIA RECS 2020 Table CE5.3b).
- California’s Title 20 caps standby power for standard portable electric spas made since June 1, 2019 at 3.75 x V^(2/3) + 40 watts, about 221 W for a 334-gallon spa (Cal. Code Regs. tit. 20, sec. 1605.3).
- No US federal efficiency standard covers hot tubs: DOE proposed on April 18, 2025 to withdraw its 2022 coverage determination for portable electric spas (90 FR 16469).
State rankings and comparisons we derived
Hot tub homes by state, 2024, and change from 2020
Which states have the highest share of homes with a hot tub, and has that changed since 2020?
Share = sum of NWEIGHT for RECBATH = 1 / sum of NWEIGHT, by state; SE from 60 jackknife replicates; change SE = sqrt(SE2020^2 + SE2024^2)Inputs: fact rows #31, #32, #33, #14, #9
Limitations: Small state samples (10 to 102 hot tub homes); 2024 data preliminary; WV, DC and HI withheld for 2024.
Hot tub to pool ratio by state
Is a hot tub or a pool more common, and where?
Ratio = weighted houses with a hot tub / weighted homes with a pool, by state and division; jackknife SEInputs: fact rows #22, #36, #35, #11
Limitations: Ratio of two small-sample estimates; 17 states lack a reliable pool estimate; houses only, because RECS does not ask apartments about pools.
Heating fuel mix for hot tubs
How are US hot tubs heated, and is that changing?
Share of used tubs (MONTUB >= 1) by FUELTUB, weighted; change test with independent-sample SEInputs: fact rows #28, #29, #37, #72
Limitations: Fuel is self-reported; tubs not used in the past year have no fuel recorded.
Hot tub electricity cost by state at 2026 prices
How much does it cost to run an electric hot tub in each state?
Cost = RECS 2020 division mean kWh (electric-heated hot tubs, pump + heater) x state residential cents/kWh, Jan to Jul 2026 / 100Inputs: fact rows #40, #41, #44, #45, #46, #68
Limitations: 2020 usage applied to 2026 prices; division average applied to each state; average revenue price rather than marginal tariff.
Reconciling 5.5 million and 10.1 million
Why do industry and federal hot tub counts differ?
RECS 2024 count minus tubs unused in the past year minus used tubs not heated by electricity, compared with DOE/P.K. Data 5.5 million x 95% electricInputs: fact rows #1, #4, #5, #55, #70, #61, #71
Limitations: Different definitions and years (2019 vs 2024); industry sources do not publish their method.
Standby ceiling vs measured use
How does the California standby limit compare with average hot tub electricity use?
W = 3.75 x V^(2/3) + 40; kWh per year = W x 8.76Inputs: fact rows #48, #73, #56, #40, #52
Limitations: Test-condition ceiling, not field use; RECS average mixes sizes, climates and part-year use.
Questions searchers ask
How many homes have a hot tub?
10.08 million US homes had their own hot tub, spa or Jacuzzi in 2024, 7.6% of 132.54 million occupied homes (EIA RECS 2024, preliminary). In 2020 the figure was 8.84 million, 7.2% (EIA RECS 2020).
What state has the most hot tubs?
California has the most homes with a hot tub, about 1.49 million in 2024, followed by Florida (about 915,000) and Texas (about 811,000). By share, Washington leads at 12.6%, with Nevada (12.3%) and Montana (12.2%) statistically tied (EIA RECS 2024 microdata).
How much electricity does a hot tub use?
An electrically heated US hot tub used about 1,997 kWh a year in 2020, and one run all 12 months about 3,004 kWh (EIA RECS 2020 microdata). At the January to July 2026 US price of 18.19 cents per kWh that is about $363 and $546 a year (EIA, PC&S calculation).
Is a hot tub or pool more common?
About equally common nationally: 10.08 million US homes had a hot tub and 9.60 million had a pool in 2024, a difference within sampling error (EIA RECS 2024 microdata). Pools lead in Florida and Arizona; hot tubs lead in Illinois and the Mountain North states.
Do hot tubs add home value?
No federal or peer-reviewed national estimate of a hot tub’s effect on US sale prices was found for this report. Realtor.com advises that “a hot tub won’t hurt a home’s resale value; however, it may not add more to it” (March 2025, Realtor.com). For the pool comparison, see the PC&S review does a pool add value to a home.
Latest releases used
- EIA’s 2024 RECS remains preliminary; its consumption and end-use data, which will update hot tub energy use, are scheduled for spring 2027 (EIA RECS 2024 data page).
- EIA Electric Power Monthly added July 2026 data: the US residential price averaged 18.19 cents per kWh for January to July 2026, against 17.01 cents a year earlier. The next release is October 23, 2026 (EIA Table 5.6.B).
- EIA released version 1 of the 2024 RECS public microdata, which made the state and division hot tub tabulations in this report possible (EIA).
- EIA published preliminary 2024 housing-characteristics tables, including the national hot tub count of 10.08 million homes (EIA RECS 2024).
- DOE proposed withdrawing portable electric spas from federal appliance coverage; DOE’s program page still lists that proposal as the latest action as of October 2026 (DOE).
Frequently asked questions
What share of US homes have a hot tub?
7.6% of occupied US homes had a hot tub in 2024, up from 7.2% in 2020, a change within sampling error (EIA RECS 2024 microdata).
Are more homes getting hot tubs?
The count rose from 8.84 million US homes in 2020 to 10.08 million in 2024, but the share rose only 0.45 points (z = 1.5), not significant at 90%. More occupied homes explain part of the increase (EIA RECS 2024; EIA RECS 2020).
How many hot tubs are never used?
3.12 million US homes with a hot tub, 31.0% of hot tub homes, did not turn it on in the past year in 2024 (EIA RECS 2024; EIA RECS 2024 microdata).
Do apartments have hot tubs?
About 0.9 million US apartments reported their own hot tub, spa or Jacuzzi in 2024: 2.7% of units in 2 to 4 unit buildings and 2.5% in buildings with 5 or more units (EIA RECS 2024 microdata).
Do renters have hot tubs?
2.4% of renter-occupied US homes had a hot tub in 2024, about 1.0 million homes, against 10.1% of owner-occupied homes (EIA RECS 2024 microdata).
What fuel heats most hot tubs?
Electricity heated 76.3% of US hot tubs used in 2024 and natural gas 19.0% (EIA RECS 2024 microdata).
How many homes have both a pool and a hot tub?
2.84 million US homes, 2.1% of occupied homes, had both in 2024; 29.5% of pool homes also had a hot tub (EIA RECS 2024 microdata).
Which region has the fewest hot tubs?
New England had the lowest division share in 2024 at 5.2% of homes, and Kentucky the lowest reliable state share at 3.5% (EIA RECS 2024 microdata).
Is there a federal energy standard for hot tubs?
No. DOE made portable electric spas a covered product in 2022 but proposed on April 18, 2025 to withdraw that determination, and no federal standard has been set (90 FR 16469; DOE).
How many hot tubs are sold each year?
DOE estimated that about 230,000 electric spas were shipped in the US in 2019, based on P.K. Data (DOE, 87 FR 54123). No newer federal shipment figure was found.
Cite and reuse
Numbers to quote
- 10.08 million US homes had their own hot tub, spa or Jacuzzi in 2024, 7.6% of occupied homes, according to EIA’s preliminary Residential Energy Consumption Survey. (U.S. Energy Information Administration)
- In 2024 about as many US homes had a hot tub (10.08 million) as had a private swimming pool (9.60 million); the gap is within sampling error. (U.S. Energy Information Administration)
- 31.0% of US homes with a hot tub did not turn it on at all in the past year in 2024. (U.S. Energy Information Administration)
- Washington had the highest share of homes with a hot tub in 2024 at 12.6%, followed by Nevada at 12.3% and Montana at 12.2%. (U.S. Energy Information Administration)
- In the Mountain North states (Colorado, Idaho, Montana, Utah, Wyoming) about 8.5 houses had a hot tub for every home with a pool in 2024. (U.S. Energy Information Administration)
- Electricity heated 76.3% of US hot tubs used in 2024, up from 70.6% in 2020. (U.S. Energy Information Administration)
- An electrically heated US hot tub costs about $363 a year to run at the January to July 2026 average residential electricity price of 18.19 cents per kWh. (U.S. Energy Information Administration)
Start with these sources
- Residential Energy Consumption Survey 2024, Table HC2.1 Structural and geographic characteristics (preliminary), U.S. Energy Information Administration
- RECS 2024 public use microdata, version 1, U.S. Energy Information Administration
- RECS 2020 Table CE5.3b Detailed household site electricity end-use consumption, averages, U.S. Energy Information Administration
- Electric Power Monthly Table 5.6.B, average price of electricity by state, year to date through July 2026, U.S. Energy Information Administration
- Final Determination of Portable Electric Spas as a Covered Consumer Product, 87 FR 54123, U.S. Department of Energy
Newsroom summary
About 10.1 million US homes, 7.6% of occupied homes, had their own hot tub, spa or Jacuzzi in 2024, according to a Pool Construction & Service (PC&S) analysis of the U.S. Energy Information Administration’s preliminary 2024 Residential Energy Consumption Survey. That is roughly the same as the 9.6 million homes with a private pool. The share of homes with a hot tub was 7.2% in 2020, and the rise since then is within sampling error. Western states lead: Washington (12.6%), Nevada (12.3%), Montana (12.2%), Arizona (11.8%) and Utah (11.7%). In the Mountain North states, hot tubs outnumber pools about 8.5 to 1, while pools outnumber hot tubs in Florida and Arizona. About 31% of hot tubs were not used at all in the past year. Electricity heated 76% of hot tubs in use. At 2026 prices, an electrically heated hot tub costs about $363 a year in electricity, from about $231 in Louisiana to $962 in Hawaii.
Headline options
- About 10 million US homes have a hot tub, as many as have a pool
- Three in ten US hot tubs sat unused for a full year, federal survey shows
- Washington, Nevada and Montana lead the US in homes with hot tubs
- In the Mountain West, hot tubs outnumber backyard pools about 8 to 1
- Running an electric hot tub costs about $363 a year at 2026 power prices
Suggested citation
Pool Construction & Service. "How Many Homes Have a Hot Tub? US State Atlas of Hot Tub and Spa Ownership, 2024." PC&S Research Desk, October 7, 2026. https://poolconstructionandservice.com/research/homes-with-hot-tubs/
Reuse terms
The data tables and charts in this report are licensed under CC BY 4.0. Reuse them with this attribution: “Source: Pool Construction & Service (poolconstructionandservice.com), How Many Homes Have a Hot Tub? US State Atlas of Hot Tub and Spa Ownership, 2024.” Figures from third-party sources remain subject to their publishers’ terms.
State data files
- Homes with a hot tub by state, 2020 and 2024 (EIA RECS, PC&S tabulation) CSV
- Hot tubs per pool home by state, 2024 CSV
- Hot tub and pool ownership by Census division, 2020 and 2024 CSV
- Hot tub heating fuel and months used, 2020 and 2024 CSV
- Estimated hot tub electricity cost by state, 2026 prices CSV
- Published US hot tub counts compared, 2015 to 2025 CSV
- Full fact sheet with sources and limitations CSV
How we measured it
- Downloaded EIA RECS 2020 final microdata (v7) and 2024 preliminary microdata (v1, May 2026), with codebooks, questionnaire and the EIA microdata guide (copied read-only from sibling PC&S packages and checked against EIA pages on 2026-10-07).
- Tabulated RECBATH (has hot tub), MONTUB (months used), FUELTUB (heating fuel) and SWIMPOOL (has pool) with the final weight NWEIGHT, by state, RECS division, housing type and tenure (scripts/recs_hot_tubs.py).
- Estimated standard errors with EIA’s 60 jackknife replicate weights, variance = (59/60) x sum of squared replicate deviations, and withheld estimates under EIA’s rule (fewer than 10 sample homes or RSE above 50%); PC&S also labels RSE 30% to 50% as ‘use with caution’.
- Checked the code against EIA’s published Table HC2.1: national hot tub counts, months used and fuel categories match to the published rounding for 2020 and 2024.
- Computed hot tub electricity from 2020 end-use variables KWHHTBPMP and KWHHTBHEAT and checked the US total (9.53 billion kWh) against Table CE5.1b (3.0 + 6.5 billion kWh).
- Parsed state residential electricity prices for January to July 2026 from EIA Electric Power Monthly Table 5.6.B (released 2026-09-24) and multiplied them by RECS division average kWh.
- Collected definitions and counts from DOE Federal Register notices, California Title 20, state sources, ASAP, and Leslie’s and Pool Corporation 10-K filings, and opened the top Google results for the target queries.
Included: Federal survey data with published sampling errors; federal and state regulatory texts; company figures from SEC filings, labeled as company estimates; one dated journalism source for listing data and one for agent opinion on resale value.
Excluded: Market-research revenue forecasts, vendor blog statistics without a traceable source (for example the widely repeated 7.3 million figure), and any state or division estimate withheld under EIA’s reliability rule. See excluded.md.
Conflicting numbers: Counts of US hot tubs range from 3.7 million to 10.1 million because sources count different things; the report shows them side by side with definitions instead of picking one, and reconciles RECS with the DOE and industry figures.
Derived metrics: Every derived number is in derived.csv with its formula and input rows and is reproduced by scripts in scripts/ from files in raw/.
Caveats
- 2024 RECS housing characteristics are preliminary and may be revised in EIA’s final release.
- State estimates rest on small samples; rankings among the top states are not statistically distinct, and single-state changes since 2020 are within the range expected by chance.
- RECS records self-reported ownership of a hot tub, spa or Jacuzzi; it does not distinguish portable, in-ground or pool-attached spas.
- Hot tub energy use is from EIA’s 2020 end-use model; 2024 end-use estimates are due in spring 2027.
- Electricity cost estimates use average revenue per kWh and a division-level kWh average, not individual tariffs or state climate.
Method last reviewed October 7, 2026.
Source weighting
Tier 1: primary and government sources (20)
- U.S. Energy Information Administration: Residential Energy Consumption Survey 2024, Table HC2.1 Structural and geographic characteristics (preliminary)
- U.S. Energy Information Administration: RECS 2024 public use microdata, version 1
- U.S. Energy Information Administration: RECS 2020 Table HC2.1 Structural and geographic characteristics (final)
- U.S. Energy Information Administration: RECS 2020 public use microdata, version 7
- U.S. Energy Information Administration: RECS 2024 data page (release schedule)
- U.S. Energy Information Administration: How to Use the 2024 RECS Microdata File
- U.S. Energy Information Administration: RECS Form EIA-457A Household Questionnaire content
- U.S. Energy Information Administration: RECS 2020 Table CE5.1b Detailed household site electricity end-use consumption, totals
- U.S. Energy Information Administration: RECS 2020 Table CE5.3b Detailed household site electricity end-use consumption, averages
- U.S. Energy Information Administration: RECS 2020 Table CE5.7b Detailed household site electricity end-use expenditures, averages
- U.S. Energy Information Administration: Electric Power Monthly Table 5.6.B, average price of electricity by state, year to date through July 2026
- California Energy Commission (via Cornell LII): Cal. Code Regs. tit. 20, sec. 1605.3, state standards for non-federally-regulated appliances
- U.S. Department of Energy: Final Determination of Portable Electric Spas as a Covered Consumer Product, 87 FR 54123
- U.S. Department of Energy: Energy Conservation Standards for Portable Electric Spas, notice of data availability, 87 FR 69082
- U.S. Department of Energy: Test Procedure for Portable Electric Spas, 88 FR 38600
- U.S. Department of Energy: Energy Conservation Standards for Portable Electric Spas, notice of data availability, 90 FR 4605
- U.S. Department of Energy: Proposed Withdrawal of Determination of Portable Electric Spas as a Covered Consumer Product, 90 FR 16469
- U.S. Department of Energy: Portable Electric Spas (Appliance and Equipment Standards Program page)
- Washington State Legislature: RCW 19.260.040 Efficiency standards
- DC Department of Energy and Environment: Appliance Efficiency Standards: Portable Electric Spas
Tier 2: trade bodies, public companies, market research (3)
- Appliance Standards Awareness Project: Portable Electric Spas (state standards and timeline)
- Leslie's, Inc. (SEC EDGAR): Leslie's, Inc. Form 10-K for fiscal year ended October 4, 2025
- Pool Corporation (SEC EDGAR): Pool Corporation Form 10-K for fiscal year 2025
Tier 3: journalism and expert commentary (2)
Works cited
- U.S. Energy Information Administration. Residential Energy Consumption Survey 2024, Table HC2.1 Structural and geographic characteristics (preliminary). Accessed 2026-10-07.
- U.S. Energy Information Administration. RECS 2024 public use microdata, version 1. Accessed 2026-10-07.
- U.S. Energy Information Administration. RECS 2020 Table HC2.1 Structural and geographic characteristics (final). Accessed 2026-10-07.
- U.S. Energy Information Administration. RECS 2020 public use microdata, version 7. Accessed 2026-10-07.
- U.S. Energy Information Administration. RECS 2024 data page (release schedule). Accessed 2026-10-07.
- U.S. Energy Information Administration. How to Use the 2024 RECS Microdata File. Accessed 2026-10-07.
- U.S. Energy Information Administration. RECS Form EIA-457A Household Questionnaire content. Accessed 2026-10-07.
- U.S. Energy Information Administration. RECS 2020 Table CE5.1b Detailed household site electricity end-use consumption, totals. Accessed 2026-10-07.
- U.S. Energy Information Administration. RECS 2020 Table CE5.3b Detailed household site electricity end-use consumption, averages. Accessed 2026-10-07.
- U.S. Energy Information Administration. RECS 2020 Table CE5.7b Detailed household site electricity end-use expenditures, averages. Accessed 2026-10-07.
- U.S. Energy Information Administration. Electric Power Monthly Table 5.6.B, average price of electricity by state, year to date through July 2026. Accessed 2026-10-07.
- California Energy Commission (via Cornell LII). Cal. Code Regs. tit. 20, sec. 1605.3, state standards for non-federally-regulated appliances. Accessed 2026-10-07.
- U.S. Department of Energy. Final Determination of Portable Electric Spas as a Covered Consumer Product, 87 FR 54123. Accessed 2026-10-07.
- U.S. Department of Energy. Energy Conservation Standards for Portable Electric Spas, notice of data availability, 87 FR 69082. Accessed 2026-10-07.
- U.S. Department of Energy. Test Procedure for Portable Electric Spas, 88 FR 38600. Accessed 2026-10-07.
- U.S. Department of Energy. Energy Conservation Standards for Portable Electric Spas, notice of data availability, 90 FR 4605. Accessed 2026-10-07.
- U.S. Department of Energy. Proposed Withdrawal of Determination of Portable Electric Spas as a Covered Consumer Product, 90 FR 16469. Accessed 2026-10-07.
- U.S. Department of Energy. Portable Electric Spas (Appliance and Equipment Standards Program page). Accessed 2026-10-07.
- Washington State Legislature. RCW 19.260.040 Efficiency standards. Accessed 2026-10-07.
- DC Department of Energy and Environment. Appliance Efficiency Standards: Portable Electric Spas. Accessed 2026-10-07.
- Appliance Standards Awareness Project. Portable Electric Spas (state standards and timeline). Accessed 2026-10-07.
- Leslie's, Inc. (SEC EDGAR). Leslie's, Inc. Form 10-K for fiscal year ended October 4, 2025. Accessed 2026-10-07.
- Pool Corporation (SEC EDGAR). Pool Corporation Form 10-K for fiscal year 2025. Accessed 2026-10-07.
- Realtor.com. Where in America You'll Find Homes With Hot Tubs, in 2 Maps (May 21, 2015). Accessed 2026-10-07.
- Realtor.com. Are Hot Tubs Hurting Your Home Resale Value? (March 3, 2025). Accessed 2026-10-07.
Related pool research
Pool Construction Statistics: PC&S Pool Construction Index, September 2026
Number of Swimming Pools in the US: Published Estimates Reconciled

Pool Permit Processing Time: Days From Application to Issue in 12 US Cities, 2019 to 2026
Pool Removal Statistics: Permit Counts for US Cities, 2015 to 2026
Percentage of Homes With Pools by Metro and State: Backyard Pool Prevalence Index

Pool Industry Market Size: US Revenue Estimates Reconciled, 2017 to 2026
All pool industry research (43 reports)