Pool Industry Market Size: US Revenue Estimates Reconciled, 2017 to 2026
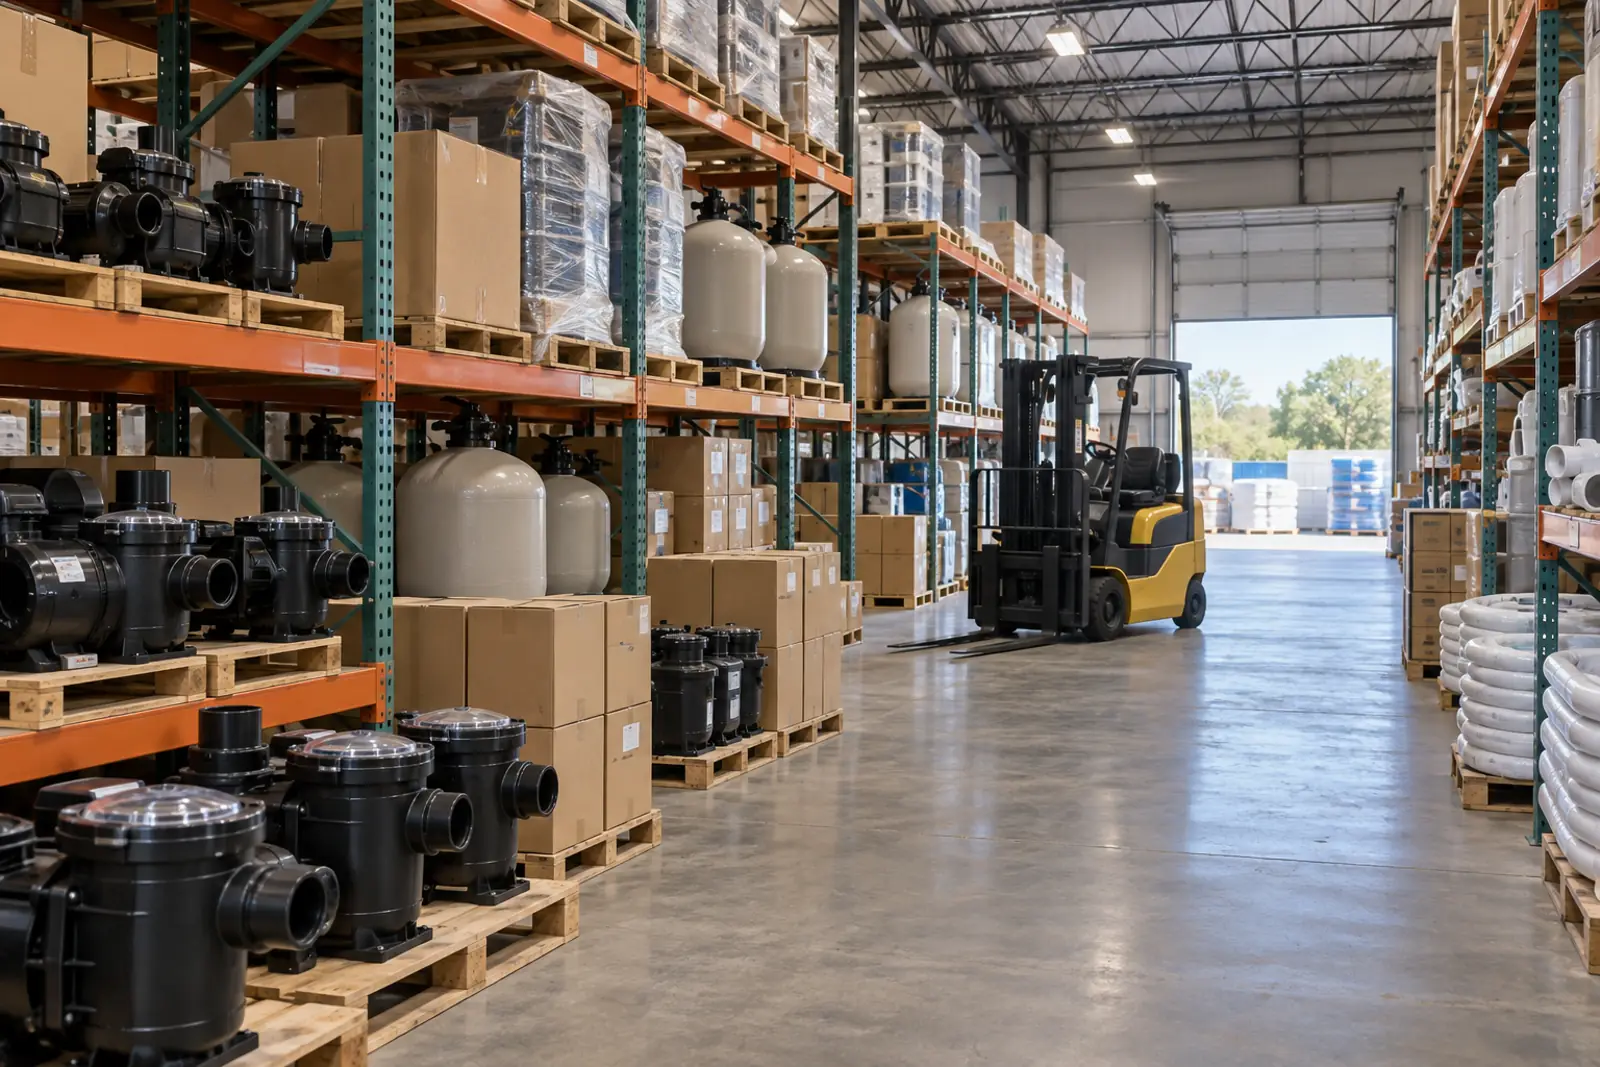
The US pool industry market size was about $35 billion to $43 billion in end-market revenue in 2022, the latest Census year; new in-ground pool starts then fell about 39% by 2025. Published figures span $2 billion to $62 billion because they count different things. PHTA's $62 billion measures economic contribution, not sales.
Summary
- US employer establishments did $22.9 billion of swimming pool construction work in 2022: $18.2 billion on new pools, $3.9 billion on renovations and $0.8 billion in a separate pool construction line (U.S. Census Bureau, 2022 Economic Census (EC2200NAPCSPRDIND)).
- Construction firms reported $19.8 billion of business as ‘swimming pool contractor’ in 2022, up 129.9% from $8.6 billion in 2017 in nominal dollars (U.S. Census Bureau, 2022 Economic Census (EC2223KOB); U.S. Census Bureau, 2017 Economic Census (EC1723KOB)).
- Leslie’s put the US pool and spa care aftermarket at $15 billion in its FY2025 10-K, including a $7.0 billion residential pool aftermarket that it had estimated at $8.5 billion in FY2022 (Leslie’s FY2025 10-K).
- PHTA’s $62 billion is the industry’s estimated 2022 contribution to the US economy, with 520,000 job equivalents, not a revenue total (PHTA).
- Vendor figures for US pool construction alone range from $2.63 billion (Expert Market Research, 2025) to $24.8 billion (IBISWorld, 2026), a 12.3-fold spread (Expert Market Research; IBISWorld).
- IBISWorld raised its 2025 US pool construction figure from $16.5 billion to $24.8 billion between its November 2025 and March 2026 editions, a 50.3% revision (IBISWorld, November 2025 page (Wayback); IBISWorld, March 2026 page (Wayback)).
- Pool Corp’s 2025 net sales were $5.29 billion, 14.4% below 2022, while Hayward, Latham and Pentair’s Pool segment grew 6.7%, 7.3% and 8.5% in 2025 (Pool Corp FY2025 10-K; Hayward FY2025 10-K; Latham FY2025 10-K; Pentair FY2025 10-K).
Pool industry market size: a reconciled range for 2022
The best-measured year is 2022, when the Census Bureau last benchmarked US businesses. Adding Census construction and retail lines to a company estimate of the aftermarket gives roughly $35 billion to $43 billion of end-market revenue. New in-ground construction has fallen since 2022, so the 2025 figure is likely lower.
PC&S Research built the range from four parts. Pool construction comes from the 2022 Economic Census product lines: $19.38 billion if only NAICS 238990 pool contractors are counted, $22.87 billion if every reporting establishment is counted (U.S. Census Bureau, 2022 Economic Census (EC2200NAPCSPRDIND)). The aftermarket for residential pools, spas and professional pool operators comes from Leslie’s FY2022 10-K: $8.5 billion, $0.9 billion and $4.4 billion, $13.8 billion in total. New spas and hot tubs span Leslie’s $1.4 billion estimate and the Census measure of $6.09 billion in retail sales of spas and hot tubs (U.S. Census Bureau, 2022 Economic Census (EC2200NAPCSPRDIND)).
The low build-up is $34.6 billion and the high build-up is $42.8 billion for 2022 in the United States. The midpoint, $38.7 billion, is arithmetic and not a best estimate.
| segment | low_usd_bn | high_usd_bn | low_source | high_source | overlap_or_caveat |
|---|---|---|---|---|---|
| New pool construction | 16.25 | 18.18 | Census: new-pool line, NAICS 238990 only | Census: new-pool line, all industries | High end includes about 1.93 billion reported by concrete, electrical, site and general contractors, part of it subcontracted work |
| Renovation, additions and alterations | 3.13 | 3.93 | Census: renovation line, NAICS 238990 only | Census: renovation line, all industries | Equipment installed during remodels can also sit in the aftermarket figure |
| Other pool construction (separate Census code) | 0.00 | 0.76 | Excluded | Census: 'Swimming pool constructions' | Half reported by commercial building contractors; CV 22.8% |
| Aftermarket products and services (residential pool, spa care, professional pool) | 13.80 | 13.80 | Leslie's FY2022 10-K | Leslie's FY2022 10-K | Single company estimate; no Census line isolates pool chemicals, parts or cleaning services |
| New spas and hot tubs | 1.40 | 6.09 | Leslie's FY2022 new spa market | Census: retail sales of spas and hot tubs | Census retail figure is 4.3 times Leslie's estimate |
| Total | 34.6 | 42.8 | D16 | D17 | Not a measured total; see limitations |
Source: PC&S calculation from U.S. Census Bureau, 2022 Economic Census (EC2200NAPCSPRDIND) and Leslie’s FY2022 10-K. Download CSV
Wholesale and manufacturing values are intermediate and overlap with contractor and retail values.
Source: U.S. Census Bureau, 2022 Economic Census; Leslie's FY2022 Form 10-K. Download chart data (CSV)
For how many pools sit behind these figures, see our count of US swimming pools; for new-pool volumes and permits, see pool construction statistics.
Why pool industry size estimates range from $2 billion to $62 billion
Published pool industry figures are not competing measurements of one thing. They differ on geography, on which activities count, on whether value is measured at the factory, warehouse, store or job site, and on whether the number is revenue at all.
- Geography. Fluidra’s EUR 17.4 billion and the vendor ‘pool and spa’ figures of $24.28 billion to $45.72 billion are global; Census and Leslie’s figures are US only (Fluidra 2025 Integrated Annual Report; Straits Research; Market Research Future).
- Activity. Mordor Intelligence’s $5.90 billion global ‘swimming pool market’ and IBISWorld’s $2.1 billion US ‘Swimming Pools’ industry measure pool operators selling memberships and admissions, not pool builders or suppliers (Mordor Intelligence; IBISWorld).
- Value level. Census counts $14.43 billion of wholesale pool and supply sales in 2022; those goods are resold by retailers or installed by contractors, so adding wholesale to end-market value double counts (U.S. Census Bureau, 2022 Economic Census (EC2200NAPCSPRDIND)).
- Gross versus net construction value. Census construction value includes ‘work performed for other contractors or builders’, and the Bureau has long noted that aggregate value of construction work ‘contains varying amounts of duplication’ (Census Economic Census glossary; Census of Construction Industries methodology).
- Revenue versus contribution. PHTA’s $62 billion is the industry’s 2022 contribution to the economy with 520,000 job equivalents, a different concept from sales (PHTA).
| estimate | value | currency | year | geography | what_it_counts | value_level | type | source_url |
|---|---|---|---|---|---|---|---|---|
| Census: pool construction work (new, renovation, other) | 22.87 | USD bn | 2022 | US | Value of construction work on swimming pools by all employer establishments | Contract value (end market) | Measured (Tier 1) | https://www2.census.gov/programs-surveys/economic-census/data/2022/sector00/EC2200NAPCSPRDIND.zip |
| Census: 'swimming pool contractor' value of business | 19.80 | USD bn | 2022 | US | Business done by construction establishments as pool contractors | Contract value (end market) | Measured (Tier 1) | https://www2.census.gov/programs-surveys/economic-census/data/2022/sector23/EC2223KOB.zip |
| Census: wholesale sales of pools and pool supplies | 14.43 | USD bn | 2022 | US | Merchant wholesale sales of pools, equipment and supplies | Wholesale (intermediate) | Measured (Tier 1) | https://www2.census.gov/programs-surveys/economic-census/data/2022/sector00/EC2200NAPCSPRDIND.zip |
| Census: retail sales of spas and hot tubs | 6.09 | USD bn | 2022 | US | Retail sales of spas and hot tubs | Retail (end market) | Measured (Tier 1) | https://www2.census.gov/programs-surveys/economic-census/data/2022/sector00/EC2200NAPCSPRDIND.zip |
| PHTA: industry contribution to the US economy | 62 | USD bn | 2022 | US | Economic contribution with 520,000 job equivalents (study method not public) | Economic contribution | Association estimate | https://www.phta.org/pub/?id=fbc17296-ee00-d4f3-d3ab-661d10d307ed |
| PHTA: industry contribution to the US economy | 50 | USD bn | 2020 | US | Economic contribution with 445,000 job equivalents (Pkdata, May 2021) | Economic contribution | Association estimate | https://downloads.regulations.gov/EERE-2022-BT-TP-0003-0006/attachment_1.pdf |
| PHTA: in-ground pool installation and construction revenue | 7.5 | USD bn | 2022 | US | Sales revenue from installing and constructing residential and commercial in-ground pools | Contract value (end market) | Association estimate | https://www.linkedin.com/posts/poolandhottuballiance_the-phta-economic-impact-study-reveals-that-activity-7132729847428091905-e9Sw |
| Leslie's: US pool and spa care industry | 15 | USD bn | FY2025 | US | Aftermarket chemicals, equipment, parts, services, plus new spas | Retail and service (end market) | Company estimate | https://www.sec.gov/Archives/edgar/data/1821806/000119312525323811/lesl-20251004.htm |
| Leslie's: residential pool aftermarket | 7.0 | USD bn | FY2025 | US | Aftermarket spend of about 9.0 million residential pools, 35% of it services | Retail and service (end market) | Company estimate | https://www.sec.gov/Archives/edgar/data/1821806/000119312525323811/lesl-20251004.htm |
| Fluidra: North America pool market | 9.3 | EUR bn | 2025 report | US and Canada | Pool equipment and products market (manufacturer view) | Manufacturer level | Company estimate | https://www.fluidra.com/wp-content/uploads/2026/03/1.-English_2025-Integrated-Anual-Report-ENG.pdf |
| Fluidra: global pool market | 17.4 | EUR bn | 2025 report | World | Pool equipment and products market (manufacturer view) | Manufacturer level | Company estimate | https://www.fluidra.com/wp-content/uploads/2026/03/1.-English_2025-Integrated-Anual-Report-ENG.pdf |
| IBISWorld: swimming pool construction | 24.8 | USD bn | 2026 | US | Pool builders, including repair and maintenance they perform | Contract value (end market) | Vendor estimate | https://www.ibisworld.com/united-states/industry/swimming-pool-construction/2021/ |
| IBISWorld: swimming pool cleaning services | 8.8 | USD bn | 2026 | US | Pool and spa cleaning businesses | Service (end market) | Vendor estimate | https://www.ibisworld.com/united-states/industry/swimming-pool-cleaning-services/4832/ |
| IBISWorld: swimming pool equipment stores | 8.0 | USD bn | 2026 | US | Stores selling pools, hot tubs and supplies | Retail (end market) | Vendor estimate | https://www.ibisworld.com/united-states/industry/swimming-pool-equipment-stores/4853/ |
| IBISWorld: swimming pools (facilities) | 2.1 | USD bn | 2026 | US | Public and private pool facilities (admission, membership) | Pool operators | Vendor estimate | https://www.ibisworld.com/united-states/industry/swimming-pools/5715/ |
| Straits Research: US swimming pool construction | 9.24 | USD bn | 2025 | US | Pool construction (scope by material and end user) | Not stated | Vendor estimate | https://straitsresearch.com/report/swimming-pool-construction-market/united-states |
| ResearchAndMarkets: US pool maintenance and cleaning | 8.08 | USD bn | 2023 | US | Pool maintenance and cleaning services | Service (end market) | Vendor estimate | https://www.businesswire.com/news/home/20240621892279/en/U.S.-Pool-Maintenance-Cleaning-Services-Market-Insights-Report-2024-2029-with-Data-on-60-Vendors-Including-Many-Prominent-Players–ResearchAndMarkets.com |
| Expert Market Research: US swimming pool construction | 2.63 | USD bn | 2025 | US | Pool construction | Not stated | Vendor estimate | https://www.expertmarketresearch.com/reports/united-states-swimming-pool-construction-market |
| Market Data Forecast: US swimming pool market | 2.01 | USD bn | 2025 | US | Swimming pools by type and application | Not stated | Vendor estimate | https://www.marketdataforecast.com/market-reports/united-states-swimming-pool-market |
| Market Research Future: global pool and spa market | 45.72 | USD bn | 2025 | World | Pools, hot tubs, spas and accessories | Not stated | Vendor estimate | https://www.marketresearchfuture.com/reports/pool-spa-market-24468 |
| Future Market Insights: global pool and spa market | 26.2 | USD bn | 2025 | World | Pools, spas and accessories | Not stated | Vendor estimate | https://www.futuremarketinsights.com/reports/pool-and-spa-market |
| Allied Market Research: global pool and spa market | 26.3 | USD bn | 2024 | World | Pools, hot tubs and swim spas | Not stated | Vendor estimate | https://www.prnewswire.com/news-releases/pool-and-spa-market-to-reach-49-1-billion-globally-by-2034-at-6-6-cagr-allied-market-research-302681111.html |
| Straits Research: global pool and spa market | 24.28 | USD bn | 2025 | World | Pools, spas, equipment and chemicals | Not stated | Vendor estimate | https://straitsresearch.com/report/pool-and-spa-market |
| Technavio: global swimming pool market, construction segment | 17.29 | USD bn | 2024 | World | Construction segment only | Not stated | Vendor estimate | https://www.technavio.com/report/swimming-pool-market-industry-analysis |
| IMARC: global swimming pool construction | 7.7 | USD bn | 2025 | World | Pool construction | Not stated | Vendor estimate | https://www.imarcgroup.com/swimming-pool-construction-market |
| Business Research Company: global swimming pool construction | 7.49 | USD bn | 2025 | World | Pool construction | Not stated | Vendor estimate | https://www.thebusinessresearchcompany.com/report/swimming-pool-construction-global-market-report |
| Grand View Research: global swimming pool market | 6.2 | USD bn | 2025 | World | Swimming pools | Not stated | Vendor estimate | https://www.grandviewresearch.com/industry-analysis/swimming-pool-market-report |
| Mordor Intelligence: global swimming pool market | 5.90 | USD bn | 2025 | World | Commercial and hospitality pool operations revenue | Pool operators | Vendor estimate | https://www.mordorintelligence.com/industry-reports/global-swimmingpool-market |
| Market Data Forecast: global swimming pool market | 3.59 | USD bn | 2025 | World | Swimming pools by type and application | Not stated | Vendor estimate | https://www.marketdataforecast.com/market-reports/swimming-pool-market |
| Pinch A Penny (citing PKdata): swimming pool industry | 21 | USD bn | Not stated | US | Residential swimming pool market | Not stated | Secondary citation (Tier 3) | https://pinchapennypoolfranchise.com/pool-industry/ |
Source: PC&S Research compilation; each row links to its source. Vendor figures are headline numbers from report landing pages and are shown as estimates, not facts. Download CSV
Global vendor figures are in US dollars but cover all countries. PHTA's figure is not revenue.
Source: U.S. Census Bureau; PHTA; Leslie's 10-K; IBISWorld; Straits Research; Expert Market Research; Market Data Forecast; Future Market Insights; Allied; Market Research Future; Grand View; IMARC; Business Research Company; PC&S calculation. Download chart data (CSV)
Where the $62 billion pool industry figure comes from
The most quoted pool industry size, $62 billion, traces to a PHTA economic impact study of 2022. PHTA describes it as a contribution to the economy measured alongside job equivalents. Trade media and statistics sites restate it as industry worth or annual sales.
In a letter to the incoming administration, PHTA described ‘an industry that contributed around $62 billion and nearly 520,000 job equivalents to the country’s economy in 2022’ and referred to ‘our recent economic impact study’ (PHTA). PHTA’s homepage repeats ‘the $62B pool, hot tub, and spa industry’ without a year (PHTA homepage).
The previous edition used 2020 data. PHTA told the Department of Energy in March 2022 that ‘during 2020, the U.S. swimming pool and hot tub industry contributed about $50 billion and almost 445,000 job equivalents’, citing ‘The Economic Impact of the Swimming Pool and Hot Tub Industry in the U.S.’, prepared by Pkdata in May 2021 (PHTA comments to the Department of Energy). The figure rose 24.0% between the two editions.
The same 2022 study, as summarised by PHTA, found about $7.5 billion in sales revenue from installing and constructing residential and commercial in-ground pools in the United States (PHTA). That construction figure is about 12.1% of the $62 billion headline, so the headline should not be read as construction plus retail and service sales without the study’s breakdown, which is sold to members and not public.
Secondary sources convert the figure into revenue language. Pool Magazine wrote that the industry ‘is worth roughly $62 billion’ and, in another article, that it is ‘estimated to generate more than $60 billion annually’ (PoolMagazine.com; PoolMagazine.com). PoolDial calls it ‘a $62 billion market’ (PoolDial).
What the 2022 Economic Census measures for the pool industry
The Census Bureau does not publish a single ‘pool industry’ total, but its 2022 product lines and kind-of-business tables isolate pool construction, pool wholesale and spa retail. They cover employer businesses only and measure gross value, so they bracket rather than pin down end-market revenue.
Pool businesses are spread across several NAICS codes. The Census 2022 NAICS index places outdoor pool construction in 238990, indoor pool construction in 236220, pool cleaning and maintenance in 561790, pool supply and hot tub stores in 459999, pool wholesalers in 423910 and pool chemical makers in 325998. Each code also covers non-pool businesses, so code totals overstate pool activity.
- Construction services for new swimming pools: $18.18 billion in 2022, up 144.6% from $7.43 billion in 2017 (U.S. Census Bureau, 2022 Economic Census (EC2200NAPCSPRDIND); U.S. Census Bureau, 2017 Economic Census (EC1700NAPCSPRDIND)).
- Additions, renovations and alterations to swimming pools: $3.93 billion in 2022, up 125.8% from $1.74 billion in 2017.
- A separate ‘swimming pool constructions’ line: $0.76 billion in 2022, down 39.7% from $1.26 billion in 2017; 48.9% of it was reported by commercial and institutional building contractors.
- Wholesale sales of swimming pools and pool supplies: $14.43 billion in 2022, 91.6% of it by NAICS 423910 merchant wholesalers.
- Retail sales of spas and hot tubs: $6.09 billion in 2022, 98% of it by NAICS 459999 retailers.
- Manufacturing shipments: pool chemicals $1.00 billion, plastics pool liners and covers $0.88 billion, large above-ground pools $0.25 billion in 2022.
| product_line | usd_bn_2017 | usd_bn_2022 | change_pct | establishments_2022 |
|---|---|---|---|---|
| Construction services for new swimming pools | 7.43 | 18.18 | 145 | 13660 |
| Additions, renovations and alterations to swimming pools | 1.74 | 3.93 | 126 | 9519 |
| Swimming pool constructions (separate code) | 1.26 | 0.76 | -40 | 2383 |
| Wholesale sales of swimming pools and pool supplies | 4.23 | 14.43 | 241 | 1023 |
| Retail sales of spas and hot tubs | 6.09 | 0 | ||
| Manufacturing: swimming pool chemical preparations | 1.00 | 33 | ||
| Manufacturing: plastics pool liners and covers | 0.88 | 53 | ||
| Manufacturing: above-ground pools (15 ft or more) | 0.25 | 20 |
Source: U.S. Census Bureau, 2022 Economic Census (EC2200NAPCSPRDIND); U.S. Census Bureau, 2017 Economic Census (EC1700NAPCSPRDIND). Download CSV
Wholesale value overlaps with contractor and retail value and is not additive.
Source: U.S. Census Bureau, 2017 and 2022 Economic Census, Products by Industry (EC1700NAPCSPRDIND, EC2200NAPCSPRDIND). Download chart data (CSV)
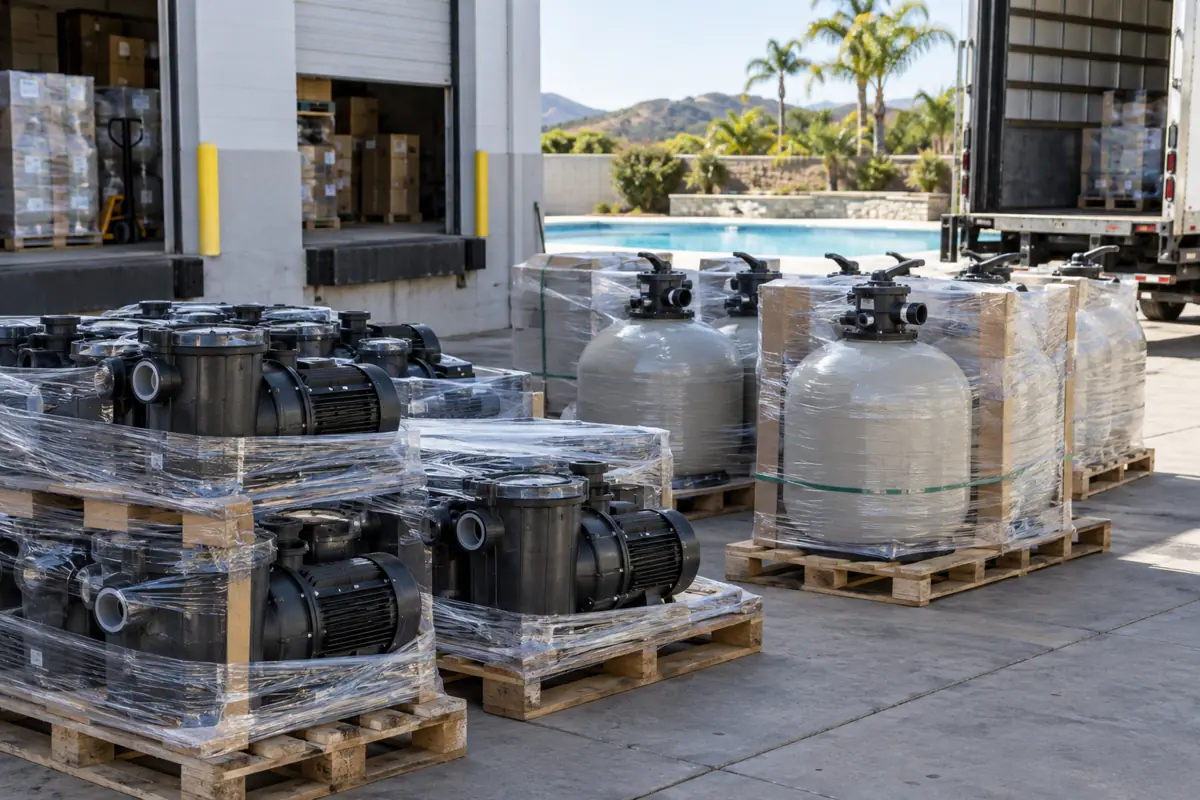
Pool contractor revenue by state, 2022
Three Sun Belt states account for half of US pool contractor business. The Census kind-of-business table assigns revenue to the state where the contractor’s establishment is located, which may differ from where the pool is built.
Texas establishments did $4.27 billion of swimming pool contractor business in 2022, Florida $3.30 billion and California $2.42 billion (U.S. Census Bureau, 2022 Economic Census (EC2223KOB)). Together the three states held 50.5% of the US total. Arizona followed at $0.96 billion.
Between 2017 and 2022, pool contractor business grew 180.9% in Texas, 144.3% in Florida, 133.1% in California and 68.7% in Arizona, in nominal dollars (U.S. Census Bureau, 2017 Economic Census (EC1723KOB); U.S. Census Bureau, 2022 Economic Census (EC2223KOB)).
Alaska and DC withheld or not shown in the Census table.
Source: U.S. Census Bureau, 2022 Economic Census, EC2223KOB (kind-of-business 8993). Download chart data (CSV)
| rank | state | code | usd_million | share_of_us_pct |
|---|---|---|---|---|
| 1 | Texas | TX | 4271.4 | 21.6 |
| 2 | Florida | FL | 3304.2 | 16.7 |
| 3 | California | CA | 2416.1 | 12.2 |
| 4 | Arizona | AZ | 961.1 | 4.9 |
| 5 | New Jersey | NJ | 678.8 | 3.4 |
| 6 | Pennsylvania | PA | 617.9 | 3.1 |
| 7 | North Carolina | NC | 538.1 | 2.7 |
| 8 | South Carolina | SC | 526.2 | 2.7 |
| 9 | Virginia | VA | 476.6 | 2.4 |
| 10 | Georgia | GA | 476.1 | 2.4 |
| 11 | Connecticut | CT | 417.8 | 2.1 |
| 12 | New York | NY | 413.9 | 2.1 |
| 13 | Michigan | MI | 324.9 | 1.6 |
| 14 | Massachusetts | MA | 306.4 | 1.5 |
| 15 | Indiana | IN | 293.7 | 1.5 |
| 16 | Washington | WA | 292.4 | 1.5 |
| 17 | Nevada | NV | 291.7 | 1.5 |
| 18 | Missouri | MO | 287.3 | 1.5 |
| 19 | Illinois | IL | 246.1 | 1.2 |
| 20 | Alabama | AL | 241.9 | 1.2 |
| 21 | Maryland | MD | 234.2 | 1.2 |
| 22 | Louisiana | LA | 232.7 | 1.2 |
| 23 | Oklahoma | OK | 217.6 | 1.1 |
| 24 | Ohio | OH | 210.7 | 1.1 |
| 25 | Utah | UT | 205.8 | 1.0 |
| 26 | Tennessee | TN | 174.0 | 0.9 |
| 27 | Wisconsin | WI | 163.6 | 0.8 |
| 28 | Colorado | CO | 159.0 | 0.8 |
| 29 | Minnesota | MN | 140.8 | 0.7 |
| 30 | Kansas | KS | 99.2 | 0.5 |
| 31 | Arkansas | AR | 94.7 | 0.5 |
| 32 | Kentucky | KY | 71.1 | 0.4 |
| 33 | New Mexico | NM | 68.2 | 0.3 |
| 34 | Hawaii | HI | 51.2 | 0.3 |
| 35 | Oregon | OR | 49.9 | 0.3 |
| 36 | Nebraska | NE | 46.4 | 0.2 |
| 37 | Idaho | ID | 37.1 | 0.2 |
| 38 | Mississippi | MS | 34.1 | 0.2 |
| 39 | New Hampshire | NH | 29.4 | 0.1 |
| 40 | Iowa | IA | 25.6 | 0.1 |
| 41 | Delaware | DE | 21.0 | 0.1 |
| 42 | North Dakota | ND | 20.1 | 0.1 |
| 43 | Montana | MT | 10.5 | 0.1 |
| 44 | West Virginia | WV | 8.4 | 0.0 |
| 45 | Maine | ME | 8.0 | 0.0 |
| 46 | Vermont | VT | 4.0 | 0.0 |
| 47 | Rhode Island | RI | 3.4 | 0.0 |
| 48 | Wyoming | WY | 1.2 | 0.0 |
| 49 | South Dakota | SD | 0.1 | 0.0 |
Source: U.S. Census Bureau, 2022 Economic Census (EC2223KOB), kind-of-business code 8993. Alaska and DC are not shown in the table. Download CSV
Listed pool companies: revenue and share of the market
Five listed pool companies reported $9.76 billion of revenue for 2025 (company totals, Pentair’s Pool segment only), but the figures overlap because the manufacturers sell through the distributors. Measured against like-for-like Census values, Pool Corp handles a large minority of US pool wholesale and Leslie’s a single-digit share of its own aftermarket estimate.
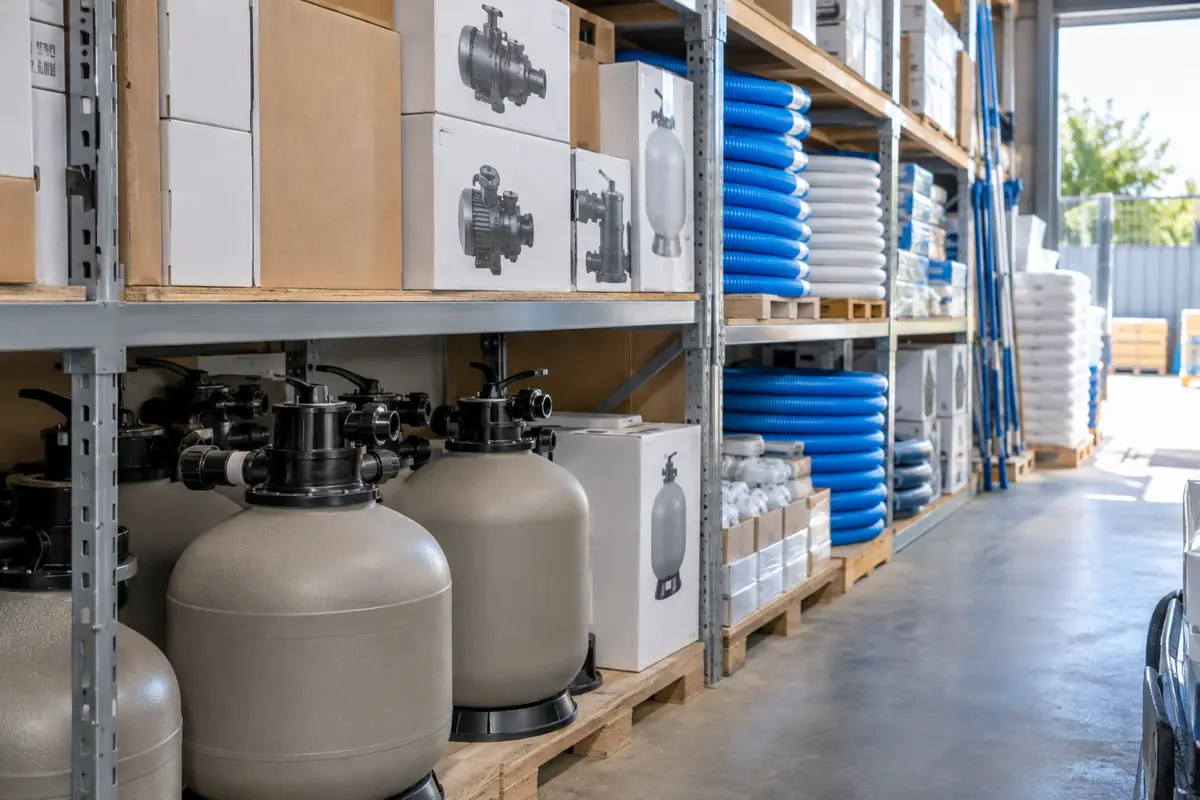
Pool Corporation, which describes itself as ‘the world’s largest wholesale distributor of swimming pool supplies, equipment and related leisure products’, reported $5.29 billion of net sales in 2025 (Pool Corp FY2025 10-K). Leslie’s reported $1.24 billion for fiscal 2025, Hayward $1.12 billion, Pentair’s Pool segment $1.56 billion and Latham $0.55 billion (Leslie’s FY2025 10-K; Hayward FY2025 10-K; Pentair FY2025 10-K; Latham FY2025 10-K).
Downstream companies (Pool Corp and Leslie’s) reported $6.53 billion in 2025 and upstream manufacturers (Hayward, Pentair Pool, Latham) $3.23 billion. The two groups cannot be added. Pool Corporation represented about 33% of Hayward’s 2025 net sales, roughly $0.37 billion (Hayward FY2025 10-K). One Pool-business customer accounted for about 18% of Pentair’s consolidated 2025 net sales, equal to about 48.2% of its Pool segment (Pentair FY2025 10-K).
In 2022, Pool Corp generated about 96% of sales in North America and 8% through its Horizon irrigation and landscape centers (Pool Corp FY2022 10-K). On that basis its pool-related North America sales were roughly $5.44 billion, about 37.7% of the $14.43 billion of US wholesale pool and supply sales measured by Census for 2022 (U.S. Census Bureau, 2022 Economic Census (EC2200NAPCSPRDIND)). Leslie’s net sales equalled 10.4% of its own $15 billion industry estimate in FY2022 and 8.3% in FY2025.
| year | pool_corp_usd_bn | leslies_usd_bn | hayward_usd_bn | pentair_pool_segment_usd_bn | latham_usd_bn |
|---|---|---|---|---|---|
| 2019 | 3.20 | 0.93 | 0.73 | 0.32 | |
| 2020 | 3.94 | 1.11 | 0.88 | 1.12 | 0.40 |
| 2021 | 5.30 | 1.34 | 1.40 | 1.57 | 0.63 |
| 2022 | 6.18 | 1.56 | 1.31 | 1.63 | 0.70 |
| 2023 | 5.54 | 1.45 | 0.99 | 1.34 | 0.57 |
| 2024 | 5.31 | 1.33 | 1.05 | 1.44 | 0.51 |
| 2025 | 5.29 | 1.24 | 1.12 | 1.56 | 0.55 |
Source: Form 10-K filings on SEC EDGAR; Pentair Pool segment from segment tables in the FY2022 and FY2025 10-Ks. Download CSV
Pentair Pool segment not reported for 2019 in the filings used. Revenues overlap: Pool Corp buys from the manufacturers.
Source: Form 10-K filings of Pool Corporation, Leslie's, Hayward Holdings, Pentair (Pool segment) and Latham Group; SEC EDGAR. Download chart data (CSV)
Deals that built today’s distributors and manufacturers are tracked in pool industry acquisitions; tariff exposure on imported equipment is covered in pool equipment tariffs.
How pool market estimates changed from 2019 to 2026
Published pool market figures from Leslie’s, PHTA and Fluidra all rose between their 2020 and 2022 or 2023 editions, but not all of the rise is growth. Several publishers widened their scope or revised the same year’s number between editions, and the measured Census series covers only 2017 and 2022.
Leslie’s described a ‘nearly $11 billion’ US pool and spa care industry in its FY2020 10-K and $15 billion from FY2022 onward, a 36.4% step that coincided with raising its professional pool opportunity from $2.4 billion to $4.4 billion (Leslie’s FY2020 10-K; Leslie’s FY2022 10-K). Fluidra’s global market grew from a EUR 7.1 billion addressable market in 2017 to EUR 11.5 billion for 2020, which Fluidra attributed to market growth plus the ‘inclusion of other product families/channels’ and ‘distribution outside North America’ (Fluidra Capital Markets Day 2021; Fluidra 2021 Integrated Report).
IBISWorld’s US pool construction figure for 2025 was $16.5 billion in November 2025 and $24.8 billion in March 2026 (IBISWorld, November 2025 page (Wayback); IBISWorld, March 2026 page (Wayback)). Its 2024 figure moved from $13.9 billion (February 2025) to $16.2 billion (November 2025), and its 2024 pool cleaning figure from $7.2 billion to $8.6 billion (IBISWorld, February 2025 page; IBISWorld, January 2025 page; IBISWorld, February 2026 page). Same-year revisions of 16.5% to 50.3% mean vendor time series should not be read as growth rates.
Company revenue, which is audited, tells a cleaner story. Net sales rose 93.1% at Pool Corp, 68.3% at Leslie’s, 79.3% at Hayward and 118.9% at Latham from 2019 to 2022. From 2022 to 2025 they fell 14.4%, 20.5%, 14.6% and 21.6% (Pool Corp FY2025 10-K; Leslie’s FY2025 10-K; Hayward FY2025 10-K; Latham FY2025 10-K).
| publisher | measure | earlier_value | later_value | change_pct | note | unit |
|---|---|---|---|---|---|---|
| Leslie's | US pool and spa care industry | nearly 11 (FY2020 10-K) | 15 (FY2022 to FY2025 10-Ks) | +36.4 (FY2021 to FY2022) | Professional pool opportunity raised from 2.4 to 4.4 in the same year | USD bn |
| Leslie's | Residential pool aftermarket | 6.9 (FY2021) | 7.0 (FY2025), after 8.5 (FY2022) and 8.4 (FY2023, FY2024) | +1.4 (FY2021 to FY2025) | Installed base cited rose from 8.6 to 9.0 million pools | USD bn |
| PHTA (Pkdata study) | Economic contribution | 50 (2020) | 62 (2022) | +24.0 | Job equivalents 445,000 to 520,000 | USD bn |
| Fluidra | Global pool market | 7.1 (2017) and 11.5 (2020) | 17.4 (2025 report) | +51.3 (2020 to 2025 figure) | Fluidra cites inclusion of other product families, channels and distribution outside North America | EUR bn |
| Fluidra | North America pool market | 5.7 (2020) | 9.3 (2025 report), after 8.2 (2023) | +63.2 | US and Canada | EUR bn |
| IBISWorld | US swimming pool construction, value for 2025 | 16.5 (November 2025 page) | 24.8 (March 2026 page) | +50.3 | Same year, revised between editions | USD bn |
| IBISWorld | US swimming pool construction, value for 2024 | 13.9 (February 2025 page) | 16.2 (November 2025 page) | +16.5 | Same year, revised between editions | USD bn |
| IBISWorld | US swimming pool cleaning, value for 2024 | 7.2 (January 2025 page) | 8.6 (February 2026 page) | +19.4 | Same year, revised between editions | USD bn |
| U.S. Census Bureau | Swimming pool contractor value of business | 8.62 (2017) | 19.80 (2022) | +129.9 | Measured; nominal | USD bn |
| U.S. Census Bureau | Wholesale sales of pools and pool supplies | 4.23 (2017) | 14.43 (2022) | +241.4 | Measured; nominal | USD bn |
Source: PC&S Research from the linked filings, annual reports, PHTA documents, Census tables and Wayback Machine copies of IBISWorld pages. Download CSV
Pool maintenance, service and retail: the segments Census does not isolate
Maintenance, chemicals and service are the recurring core of pool spending, yet no Census product line isolates them. The available figures are company and vendor estimates, which agree on order of magnitude but not on detail.
Leslie’s estimated the US residential pool aftermarket at about $7.0 billion for about 9.0 million pools in FY2025, with do-it-for-me services 35% of that spend, plus $4.9 billion for professional pool operators and service firms and $0.9 billion for spa chemicals and equipment (Leslie’s FY2025 10-K). In FY2021, Leslie’s estimated that the average in-ground pool owner spends $800 a year on chemicals, equipment, parts and accessories (Leslie’s FY2021 10-K).
Pool Corp estimated in its FY2025 10-K that about 64% of its net sales come from maintenance and minor repair products and 22% from remodel, renovation and upgrade products, leaving about 14% for new construction and other uses (Pool Corp FY2025 10-K). Fluidra reports a similar split for global demand: 60% residential maintenance, repair and remodel, 30% new residential construction and 10% commercial pools (Fluidra 2025 Integrated Annual Report).
For pool cleaning services, IBISWorld estimates $8.8 billion in 2026 across 78,817 businesses, and ResearchAndMarkets estimated $8.08 billion for 2023 (IBISWorld; ResearchAndMarkets via Business Wire). Census data cannot confirm either: pool cleaning sits inside NAICS 561790 with duct, chimney and exterior cleaning, and the nonemployer series reports $6.14 billion of 2024 receipts for the wider 56179 group (U.S. Census Bureau, Nonemployer Statistics 2024).
Chemical price trends behind aftermarket spending are in pool chemical prices, and spa ownership in homes with hot tubs. Operators sizing a service business can compare these figures with how to start a pool service business and pool routes for sale; contractors can find more in resources for pool pros.
Reconciling the estimates
Estimate reconciliation and defensible range
How large is the US pool and spa industry by end-market revenue?
Low = Census new + renovation pool construction by NAICS 238990 + Leslie's aftermarket (residential pool + spa + professional) + Leslie's new spa market. High = all Census pool construction lines + same aftermarket + Census retail sales of spas and hot tubs.Inputs: fact rows #8, #11, #6, #10, #12, #122, #127, #134, #130, #15; derived D1, D2, D14, D16, D17, D18
Limitations: Combines measured Census values with one company’s aftermarket estimate; gross construction value includes some duplicated subcontract work; equipment installed in renovations may also be in the aftermarket figure; excludes nonemployer contractors not captured by Census and commercial pool operating revenue.
Segment build-up from measured and company-disclosed figures
Which parts of the pool industry are largest?
Rank Census 2022 product lines and Leslie's FY2022 segment estimates by value; new share = new / (new + renovation).Inputs: fact rows #6, #10, #13, #15, #17, #18, #122, #134, #127; derived D3
Limitations: Census renovation may be understated if contractors file remodel work under new construction; Leslie’s segments are company estimates.
Share of the market held by listed companies
How much of the pool market do public companies represent?
Pool Corp pool-related North America sales = net sales x (North America share - Horizon share); share = that / Census wholesale pool line. Leslie's share = net sales / $15 billion.Inputs: fact rows #90, #138, #139, #13, #97, #100, #117, #148, #107, #156, #157, #155; derived D22 to D28
Limitations: Pool Corp’s North America figure includes Canada, Mexico and building materials; Census may classify some of those goods outside the pool wholesale line.
How estimates changed, 2019 to 2026
Is the pool industry growing, or are the estimates changing?
Percent change between editions or years for each publisher; company revenue change 2019 to 2022 and 2022 to 2025.Inputs: fact rows #116, #117, #173, #170, #167, #158, #168, #159, #178, #177, #3, #1; derived D5, D30, D31, D36 to D42
Limitations: Census benchmarks exist only for 2017 and 2022; vendor methods are not disclosed; Fluidra figures are in euros.
Census construction value versus PHTA's construction revenue
Why does PHTA’s in-ground construction revenue differ from Census?
Census 'new swimming pools' line / PHTA in-ground installation and construction revenue (2022).Inputs: fact rows #6, #175, #8; derived D10, D20
Limitations: Census covers all new pools including some above-ground installs, decks and features in the same contract and gross subcontract value; PHTA’s method is not public.
What holds up and what does not
- New pool construction was the largest measured US pool segment in 2022 at $18.18 billion, reported by 13,660 establishments (U.S. Census Bureau, 2022 Economic Census (EC2200NAPCSPRDIND)).
- Establishments classified as ‘all other specialty trade contractors’ (NAICS 238990) reported 89.4% of new-pool construction value in 2022, $16.25 billion (U.S. Census Bureau, 2022 Economic Census (EC2200NAPCSPRDIND)).
- Pool contractor work made up 23.4% of all NAICS 238990 revenue in 2022: $19.38 billion of $82.80 billion (U.S. Census Bureau, 2022 Economic Census (EC2223KOB); U.S. Census Bureau, 2022 Economic Census (EC2223BASIC)).
- Swimming pool contractor business rose from 0.43% to 0.68% of all US construction value of business between 2017 and 2022 (U.S. Census Bureau, 2022 Economic Census (EC2223KOB)).
- Texas establishments did $4.27 billion of pool contractor business in 2022, 21.6% of the US total, ahead of Florida ($3.30 billion) and California ($2.42 billion) (U.S. Census Bureau, 2022 Economic Census (EC2223KOB)).
- US merchant wholesale sales of swimming pools and pool supplies were $14.43 billion in 2022, up 241.4% from $4.23 billion in 2017 (U.S. Census Bureau, 2022 Economic Census (EC2200NAPCSPRDIND); U.S. Census Bureau, 2017 Economic Census (EC1700NAPCSPRDIND)).
- US retail sales of spas and hot tubs were $6.09 billion in 2022, 4.3 times the $1.4 billion new-spa market Leslie’s cited for FY2022 (U.S. Census Bureau, 2022 Economic Census (EC2200NAPCSPRDIND); Leslie’s FY2022 10-K).
- PHTA’s Economic Impact Study put 2022 revenue from installing and constructing US in-ground pools at about $7.5 billion, while the Census new-pool line for all pools was 2.4 times larger (PHTA; U.S. Census Bureau, 2022 Economic Census (EC2200NAPCSPRDIND)).
- Pool Corp’s estimated pool-related North America sales of about $5.44 billion in 2022 equal roughly 37.7% of US wholesale pool and supply sales measured by Census (Pool Corp FY2022 10-K; U.S. Census Bureau, 2022 Economic Census (EC2200NAPCSPRDIND)).
- Pool Corporation bought about 33% of Hayward’s net sales in fiscal 2025, so manufacturer and distributor revenues overlap and cannot be added (Hayward FY2025 10-K).
- Fluidra put the global pool market at about EUR 17.4 billion and the US and Canada market at EUR 9.3 billion (53%) in its 2025 annual report (Fluidra 2025 Integrated Annual Report).
- Fluidra’s global pool market figure rose from EUR 11.5 billion (2020) to EUR 17.4 billion (2025 report), partly because Fluidra widened the product families and channels it counts (Fluidra 2021 Integrated Report; Fluidra Capital Markets Day 2021).
- Pool Corp estimated in its FY2025 10-K that about 64% of its net sales come from maintenance and minor repair products and 22% from remodel and upgrade products (Pool Corp FY2025 10-K).
- US nonemployer businesses in NAICS 56179, which includes pool cleaning along with other building services, reported $6.14 billion of receipts in 2024 across 146,860 businesses (U.S. Census Bureau, Nonemployer Statistics 2024).
Most recent filings and releases
- Pool Corp reported second-quarter 2026 net sales up 2% to $1.8 billion (Pool Corp 10-Q).
- The Census Bureau’s 2022 Products by Industry file on its FTP site carries an April 2026 file date; this report uses that release (U.S. Census Bureau, 2022 Economic Census (EC2200NAPCSPRDIND)).
- IBISWorld’s March 2026 US pool construction edition shows $24.8 billion for 2025 and 2026, up from $16.5 billion for 2025 in its prior edition (IBISWorld, March 2026 page (Wayback)).
- Fluidra’s 2025 Integrated Annual Report puts the global pool market at EUR 17.4 billion and North America at EUR 9.3 billion (Fluidra 2025 Integrated Annual Report).
- FY2025 10-Ks: Pool Corp $5.29 billion, Hayward $1.12 billion, Pentair Pool segment $1.56 billion, Latham $0.55 billion (Pool Corp FY2025 10-K; Hayward FY2025 10-K; Pentair FY2025 10-K; Latham FY2025 10-K).
- Leslie’s FY2025 10-K cut its residential pool aftermarket estimate to $7.0 billion from $8.4 billion while keeping the $15 billion industry figure (Leslie’s FY2025 10-K).
Related questions
How big is the pool industry?
US pool and spa end-market revenue was about $34.6 billion to $42.8 billion in 2022 by PC&S’s reconciliation of U.S. Census Bureau, 2022 Economic Census (EC2200NAPCSPRDIND) product lines and Leslie’s FY2022 10-K aftermarket estimates. Pool construction alone was $22.87 billion in 2022.
How much is the pool industry worth?
PHTA says the US pool, hot tub and spa industry contributed about $62 billion to the economy in 2022, but that is an economic contribution figure, not sales (PHTA). Measured end-market revenue was $34.6 billion to $42.8 billion in 2022.
Is the pool industry growing?
Pool contractor business grew 129.9% from 2017 to 2022 in nominal terms (U.S. Census Bureau, 2022 Economic Census (EC2223KOB)). Since 2022, new in-ground pool starts fell about 39% to just below 60,000 in 2025 and Pool Corp’s net sales fell 14.4%, though Hayward (+6.7%), Latham (+7.3%) and Pentair Pool (+8.5%) grew in 2025 and Pool Corp’s sales rose 2% in the second quarter of 2026 (Pool Corp FY2025 10-K; Pool Corp 10-Q).
What is the biggest pool company?
By revenue, Pool Corporation is the largest listed pool company, with $5.29 billion of net sales in 2025, and it calls itself the world’s largest wholesale distributor of swimming pool supplies (Pool Corp FY2025 10-K). Among manufacturers, Fluidra reported EUR 2.184 billion of 2025 sales and a 13% share of the global pool market (Fluidra 2025 Integrated Annual Report).
How much do Americans spend on pools each year?
In 2022, US pool owners and operators spent about $22.87 billion on pool construction and renovation work (U.S. Census Bureau, 2022 Economic Census (EC2200NAPCSPRDIND)) and an estimated $13.8 billion on pool and spa aftermarket products and services (Leslie’s FY2022 10-K). Leslie’s FY2021 10-K put the average in-ground pool owner’s spend at $800 a year on chemicals, equipment, parts and accessories (Leslie’s FY2021 10-K).
Sources and method
- Searched for every published estimate of the US (and, for scope comparison, global) pool and spa industry size, including the top Google results for ‘pool industry market size’ and ‘how big is the pool industry’, and opened each source page.
- Downloaded the 2017 and 2022 Economic Census kind-of-business (construction) and products-by-industry files and the 2024 Nonemployer Statistics file from the Census FTP site, and extracted pool lines with scripts/census_extract.py.
- Read the Business sections and segment tables of Pool Corp, Leslie’s, Hayward, Latham and Pentair 10-K filings for fiscal 2019 to 2025 and Pool Corp’s Q2 2026 10-Q; revenue values were pulled from SEC XBRL company facts and matched to the filing text.
- Traced PHTA’s $62 billion and $50 billion figures to PHTA’s own documents and recorded how secondary sites restate them.
- Recorded IBISWorld figures from current pages and Wayback Machine copies to measure same-year revisions.
- Built the 2022 end-market range from Census construction and retail lines plus Leslie’s aftermarket estimates, and computed shares and changes in scripts/compute_derived.py.
Included: Figures with a named publisher, a stated year or edition, and a page that could be opened on 2026-10-08. Vendor figures are included as headline estimates with scope as described on the landing page.
Excluded: Figures without a traceable publisher or year as primary evidence (kept only as Tier 3 examples), paywalled report contents, and Census code totals that mix pool and non-pool businesses (used only as context). See excluded.md.
Conflicting numbers: Conflicting figures are shown side by side with their scope rather than averaged. Where one publisher revised the same year, both editions are shown. Measured Census values are preferred over estimates for the segments Census isolates.
Derived metrics: Every derived figure lists its formula and input rows in derived.csv; scripts in scripts/ regenerate facts.csv, derived.csv, tables and charts from the saved raw files.
Caveats
- The latest measured benchmark is 2022; the 2027 Economic Census is the next one.
- Census tables cover employer establishments only and report gross construction value, which includes some duplicated subcontract work.
- No Census line isolates pool chemicals at retail, pool parts, or pool cleaning services, so the aftermarket relies on Leslie’s company estimate.
- Vendor estimates are landing-page headline figures; their methods are not disclosed and several were revised between editions.
- PHTA’s economic impact study is not public, so the composition of its $62 billion figure cannot be checked.
- Company revenues include non-US sales and, in Pool Corp’s case, irrigation and landscape products.
Method last reviewed October 8, 2026.
Questions and answers
What does PHTA's $62 billion figure measure?
It measures the US pool, hot tub and spa industry’s contribution to the economy in 2022, reported with nearly 520,000 job equivalents, from a paid PHTA economic impact study (PHTA). The 2020 edition put the contribution at about $50 billion (PHTA comments to the Department of Energy).
Why do market research firms report much smaller pool market sizes?
Many vendor figures cover one activity or a different geography. Market Data Forecast puts the US swimming pool market at $2.01 billion for 2025 and Expert Market Research puts US pool construction at $2.63 billion (Market Data Forecast; Expert Market Research), while Census measured $18.18 billion of new US pool construction in 2022 (U.S. Census Bureau, 2022 Economic Census (EC2200NAPCSPRDIND)).
How much revenue do US pool contractors make?
US construction establishments reported $19.80 billion of business as swimming pool contractors in 2022, up from $8.62 billion in 2017 (U.S. Census Bureau, 2022 Economic Census (EC2223KOB); U.S. Census Bureau, 2017 Economic Census (EC1723KOB)).
Which states have the largest pool construction industries?
Texas ($4.27 billion), Florida ($3.30 billion) and California ($2.42 billion) led US pool contractor business in 2022, together 50.5% of the national total (U.S. Census Bureau, 2022 Economic Census (EC2223KOB)).
How big is the pool aftermarket?
Leslie’s estimated the US pool and spa care industry at $15 billion in its FY2025 10-K, including a $7.0 billion residential pool aftermarket and a $4.9 billion professional pool aftermarket (Leslie’s FY2025 10-K).
How big is US pool supply distribution?
US wholesale sales of swimming pools and pool supplies were $14.43 billion in 2022 (U.S. Census Bureau, 2022 Economic Census (EC2200NAPCSPRDIND)). Pool Corp, the largest distributor, reported $6.18 billion of total net sales that year (Pool Corp FY2022 10-K).
How big is the US pool cleaning and service market?
No Census figure isolates pool service. IBISWorld estimates US swimming pool cleaning services at $8.8 billion in 2026 (IBISWorld), a vendor estimate it revised from $7.2 billion to $8.6 billion for 2024 between editions.
How much of pool construction spending is new pools versus renovation?
New pools were $18.18 billion and renovations, additions and alterations $3.93 billion of US pool construction work in 2022, so new pools were 82.2% of the two lines combined (U.S. Census Bureau, 2022 Economic Census (EC2200NAPCSPRDIND)).
How big is the US hot tub and spa market?
US retail sales of spas and hot tubs were $6.09 billion in 2022 (U.S. Census Bureau, 2022 Economic Census (EC2200NAPCSPRDIND)). Leslie’s estimates a much smaller new-spa market, $1.6 billion in FY2025, plus $0.9 billion of spa aftermarket spending (Leslie’s FY2025 10-K).
How big is the global pool market?
Fluidra estimates the global pool market at about EUR 17.4 billion, with the United States and Canada at EUR 9.3 billion or 53%, in its 2025 Integrated Annual Report (Fluidra 2025 Integrated Annual Report). Vendor ‘pool and spa’ figures range from $24.28 billion to $45.72 billion for 2025 (Straits Research; Market Research Future).
Media and citation kit
Quotable figures
- US pool and spa end-market revenue was about $34.6 billion to $42.8 billion in 2022, by PC&S Research’s reconciliation of Census and company data. (U.S. Census Bureau)
- US businesses did $18.18 billion of new swimming pool construction work in 2022, according to the 2022 Economic Census. (U.S. Census Bureau)
- US construction firms reported $19.80 billion of swimming pool contractor business in 2022, up 129.9% from 2017. (U.S. Census Bureau)
- Texas, Florida and California accounted for 50.5% of US swimming pool contractor business in 2022. (U.S. Census Bureau)
- PHTA’s $62 billion figure is the US pool, hot tub and spa industry’s estimated contribution to the economy in 2022, not its sales. (Pool & Hot Tub Alliance)
- IBISWorld revised its estimate of 2025 US pool construction from $16.5 billion to $24.8 billion between November 2025 and March 2026. (IBISWorld)
- US new in-ground pool construction fell from about 98,000 units in 2022 to just below 60,000 in 2025, according to Pool Corp estimates. (Pool Corporation)
Sources worth citing directly
- 2022 Economic Census, Products by Industry for the U.S. (EC2200NAPCSPRDIND), U.S. Census Bureau
- 2022 Economic Census, Construction: Value of Business Done for Kind-of-Business (EC2223KOB), U.S. Census Bureau
- Make Pools Great Again (letter to the incoming administration), Pool & Hot Tub Alliance
- Form 10-K for fiscal year 2025, Leslie's, Inc.
- Form 10-K for fiscal year 2025, Pool Corporation
Press brief
The US pool industry market size was about $35 billion to $43 billion in end-market revenue in 2022, according to a PC&S Research reconciliation of 2022 Economic Census product lines and company filings. Pool construction work accounted for $19.4 billion to $22.9 billion of that, including up to $18.2 billion of new pools. The widely quoted $62 billion figure from the Pool & Hot Tub Alliance measures the industry’s contribution to the economy, with 520,000 job equivalents, rather than sales. Published market sizes range from $2 billion to more than $45 billion because they cover different activities, value chains and geographies, and some vendors revised the same year’s figure by up to 50% between editions. Census data show pool contractor business more than doubled from 2017 to 2022, led by Texas, Florida and California. Since then, new in-ground pool starts have fallen about 39% and four of five listed pool companies’ 2025 sales were 14% to 22% below 2022, though the three manufacturers grew in 2025.
Defensible headlines
- US pool industry generated $35 billion to $43 billion in 2022, Census-based reconciliation finds
- The pool industry's '$62 billion' is economic contribution, not sales
- Pool construction work more than doubled to $22.9 billion between 2017 and 2022, Census data show
- Texas, Florida and California account for half of US pool contractor revenue
- Pool market estimates shift by up to 50% between editions as vendors revise the same year
Cite this analysis
Pool Construction & Service. "Pool Industry Market Size: US Revenue Estimates Reconciled, 2017 to 2026." PC&S Research Desk, October 8, 2026. https://poolconstructionandservice.com/research/pool-industry-market-size/
Reuse
The data tables and charts in this report are licensed under CC BY 4.0. Reuse them with this attribution: “Source: Pool Construction & Service (poolconstructionandservice.com), Pool Industry Market Size: US Revenue Estimates Reconciled, 2017 to 2026.” Figures from third-party sources remain subject to their publishers’ terms.
Data files
- Published pool industry size estimates side by side, 2020 to 2026 CSV
- US pool and spa end-market revenue build-up by segment, 2022 CSV
- Census pool and spa product lines, 2017 and 2022 CSV
- Swimming pool contractor value of business by state, 2022 CSV
- Net sales of listed pool companies, 2019 to 2025 CSV
- Changes and revisions in published pool market figures, 2017 to 2026 CSV
- Full fact sheet with sources and limitations CSV
Source grading
Tier 1: primary and government sources (11)
- U.S. Census Bureau: 2022 Economic Census, Construction: Value of Business Done for Kind-of-Business (EC2223KOB)
- U.S. Census Bureau: 2017 Economic Census, Construction: Value of Business Done for Kind-of-Business (EC1723KOB)
- U.S. Census Bureau: 2022 Economic Census, Products by Industry for the U.S. (EC2200NAPCSPRDIND)
- U.S. Census Bureau: 2017 Economic Census, Products by Industry for the U.S. (EC1700NAPCSPRDIND)
- U.S. Census Bureau: 2022 Economic Census, Construction: Summary Statistics (EC2223BASIC)
- U.S. Census Bureau: Nonemployer Statistics 2024, US file
- U.S. Census Bureau: 2022 NAICS Index File
- U.S. Census Bureau: Glossary of Economic Census Fields and Variables
- U.S. Census Bureau: 1992 Census of Construction Industries, Summary (duplication in value of construction work)
- U.S. Census Bureau: 2022 About the Economic Census
- U.S. Census Bureau: 2022 NAICS Sector 23 Construction tables
Tier 2: trade bodies, public companies, market research (46)
- Pool Corporation: Form 10-K for fiscal year 2025
- Pool Corporation: Form 10-K for fiscal year 2023
- Pool Corporation: Form 10-K for fiscal year 2022
- Pool Corporation: Form 10-K for fiscal year 2019
- Pool Corporation: Form 10-Q for the quarter ended June 30, 2026
- Leslie's, Inc.: Form 10-K for fiscal year 2025
- Leslie's, Inc.: Form 10-K for fiscal year 2022
- Leslie's, Inc.: Form 10-K for fiscal year 2021
- Leslie's, Inc.: Form 10-K for fiscal year 2020
- Hayward Holdings, Inc.: Form 10-K for fiscal year 2025
- Hayward Holdings, Inc.: Form 10-K for fiscal year 2021
- Latham Group, Inc.: Form 10-K for fiscal year 2025
- Pentair plc: Form 10-K for fiscal year 2025
- Pentair plc: Form 10-K for fiscal year 2022
- Fluidra S.A.: 2025 Integrated Annual Report
- Fluidra S.A.: 2023 Integrated Annual Report
- Fluidra S.A.: Integrated Report 2021
- Fluidra S.A.: Capital Markets Day presentation, 2021
- Pool & Hot Tub Alliance: Make Pools Great Again (letter to the incoming administration)
- Pool & Hot Tub Alliance: Comments to the U.S. Department of Energy, docket EERE-2022-BT-TP-0003
- Pool & Hot Tub Alliance: Economic Impact Study post (LinkedIn)
- Pool & Hot Tub Alliance: Homepage
- IBISWorld: Swimming Pool Construction in the US
- IBISWorld: Swimming Pool Construction in the US, market size (Wayback copy, 2025-11-07)
- IBISWorld: Swimming Pool Construction in the US, market size (Wayback copy, 2026-03-08)
- IBISWorld: Swimming Pool Construction in the US, market size (Wayback copy, 2025-02-14)
- IBISWorld: Swimming Pool Cleaning Services in the US
- IBISWorld: Swimming Pool Cleaning Services in the US, market size (Wayback copy, 2025-01-22)
- IBISWorld: Swimming Pool Cleaning Services in the US, market size (Wayback copy, 2026-02-12)
- IBISWorld: Swimming Pool Equipment Stores in the US
- IBISWorld: Swimming Pools in the US
- Straits Research: United States Swimming Pool Construction Market
- Expert Market Research: United States Swimming Pool Construction Market
- Market Data Forecast: U.S. Swimming Pool Market
- ResearchAndMarkets.com: U.S. Pool Maintenance & Cleaning Services Market (press release)
- Market Data Forecast: Swimming Pool Market
- Mordor Intelligence: Swimming Pool Market
- Grand View Research: Swimming Pool Market
- The Business Research Company: Swimming Pool Construction Global Market Report
- IMARC Group: Swimming Pool Construction Market
- Technavio: Swimming Pool Market Analysis
- Future Market Insights: Pool and Spa Market
- Allied Market Research: Pool and Spa Market (press release)
- Straits Research: Pool and Spa Market
- Market Research Future: Pool And Spa Market
- Vertical IQ: Swimming Pool and Spa Retailers Industry Profile
Tier 3: journalism and expert commentary (4)
Bibliography
- U.S. Census Bureau. 2022 Economic Census, Construction: Value of Business Done for Kind-of-Business (EC2223KOB). Accessed 2026-10-08.
- U.S. Census Bureau. 2017 Economic Census, Construction: Value of Business Done for Kind-of-Business (EC1723KOB). Accessed 2026-10-08.
- U.S. Census Bureau. 2022 Economic Census, Products by Industry for the U.S. (EC2200NAPCSPRDIND). Accessed 2026-10-08.
- U.S. Census Bureau. 2017 Economic Census, Products by Industry for the U.S. (EC1700NAPCSPRDIND). Accessed 2026-10-08.
- U.S. Census Bureau. 2022 Economic Census, Construction: Summary Statistics (EC2223BASIC). Accessed 2026-10-08.
- U.S. Census Bureau. Nonemployer Statistics 2024, US file. Accessed 2026-10-08.
- U.S. Census Bureau. 2022 NAICS Index File. Accessed 2026-10-08.
- U.S. Census Bureau. Glossary of Economic Census Fields and Variables. Accessed 2026-10-08.
- U.S. Census Bureau. 1992 Census of Construction Industries, Summary (duplication in value of construction work). Accessed 2026-10-08.
- U.S. Census Bureau. 2022 About the Economic Census. Accessed 2026-10-08.
- U.S. Census Bureau. 2022 NAICS Sector 23 Construction tables. Accessed 2026-10-08.
- Pool Corporation. Form 10-K for fiscal year 2025. Accessed 2026-10-08.
- Pool Corporation. Form 10-K for fiscal year 2023. Accessed 2026-10-08.
- Pool Corporation. Form 10-K for fiscal year 2022. Accessed 2026-10-08.
- Pool Corporation. Form 10-K for fiscal year 2019. Accessed 2026-10-08.
- Pool Corporation. Form 10-Q for the quarter ended June 30, 2026. Accessed 2026-10-08.
- Leslie's, Inc.. Form 10-K for fiscal year 2025. Accessed 2026-10-08.
- Leslie's, Inc.. Form 10-K for fiscal year 2022. Accessed 2026-10-08.
- Leslie's, Inc.. Form 10-K for fiscal year 2021. Accessed 2026-10-08.
- Leslie's, Inc.. Form 10-K for fiscal year 2020. Accessed 2026-10-08.
- Hayward Holdings, Inc.. Form 10-K for fiscal year 2025. Accessed 2026-10-08.
- Hayward Holdings, Inc.. Form 10-K for fiscal year 2021. Accessed 2026-10-08.
- Latham Group, Inc.. Form 10-K for fiscal year 2025. Accessed 2026-10-08.
- Pentair plc. Form 10-K for fiscal year 2025. Accessed 2026-10-08.
- Pentair plc. Form 10-K for fiscal year 2022. Accessed 2026-10-08.
- Fluidra S.A.. 2025 Integrated Annual Report. Accessed 2026-10-08.
- Fluidra S.A.. 2023 Integrated Annual Report. Accessed 2026-10-08.
- Fluidra S.A.. Integrated Report 2021. Accessed 2026-10-08.
- Fluidra S.A.. Capital Markets Day presentation, 2021. Accessed 2026-10-08.
- Pool & Hot Tub Alliance. Make Pools Great Again (letter to the incoming administration). Accessed 2026-10-08.
- Pool & Hot Tub Alliance. Comments to the U.S. Department of Energy, docket EERE-2022-BT-TP-0003. Accessed 2026-10-08.
- Pool & Hot Tub Alliance. Economic Impact Study post (LinkedIn). Accessed 2026-10-08.
- Pool & Hot Tub Alliance. Homepage. Accessed 2026-10-08.
- IBISWorld. Swimming Pool Construction in the US. Accessed 2026-10-08.
- IBISWorld. Swimming Pool Construction in the US, market size (Wayback copy, 2025-11-07). Accessed 2026-10-08.
- IBISWorld. Swimming Pool Construction in the US, market size (Wayback copy, 2026-03-08). Accessed 2026-10-08.
- IBISWorld. Swimming Pool Construction in the US, market size (Wayback copy, 2025-02-14). Accessed 2026-10-08.
- IBISWorld. Swimming Pool Cleaning Services in the US. Accessed 2026-10-08.
- IBISWorld. Swimming Pool Cleaning Services in the US, market size (Wayback copy, 2025-01-22). Accessed 2026-10-08.
- IBISWorld. Swimming Pool Cleaning Services in the US, market size (Wayback copy, 2026-02-12). Accessed 2026-10-08.
- IBISWorld. Swimming Pool Equipment Stores in the US. Accessed 2026-10-08.
- IBISWorld. Swimming Pools in the US. Accessed 2026-10-08.
- Straits Research. United States Swimming Pool Construction Market. Accessed 2026-10-08.
- Expert Market Research. United States Swimming Pool Construction Market. Accessed 2026-10-08.
- Market Data Forecast. U.S. Swimming Pool Market. Accessed 2026-10-08.
- ResearchAndMarkets.com. U.S. Pool Maintenance & Cleaning Services Market (press release). Accessed 2026-10-08.
- Market Data Forecast. Swimming Pool Market. Accessed 2026-10-08.
- Mordor Intelligence. Swimming Pool Market. Accessed 2026-10-08.
- Grand View Research. Swimming Pool Market. Accessed 2026-10-08.
- The Business Research Company. Swimming Pool Construction Global Market Report. Accessed 2026-10-08.
- IMARC Group. Swimming Pool Construction Market. Accessed 2026-10-08.
- Technavio. Swimming Pool Market Analysis. Accessed 2026-10-08.
- Future Market Insights. Pool and Spa Market. Accessed 2026-10-08.
- Allied Market Research. Pool and Spa Market (press release). Accessed 2026-10-08.
- Straits Research. Pool and Spa Market. Accessed 2026-10-08.
- Market Research Future. Pool And Spa Market. Accessed 2026-10-08.
- Vertical IQ. Swimming Pool and Spa Retailers Industry Profile. Accessed 2026-10-08.
- PoolMagazine.com. The $62 Billion Paradox. Accessed 2026-10-08.
- PoolMagazine.com. Understanding the U.S. Pool Market in 2026. Accessed 2026-10-08.
- PoolDial. Pool Industry Statistics 2026. Accessed 2026-10-08.
- Pinch A Penny Pool Patio Spa. Pool Industry. Accessed 2026-10-08.
Related pool research
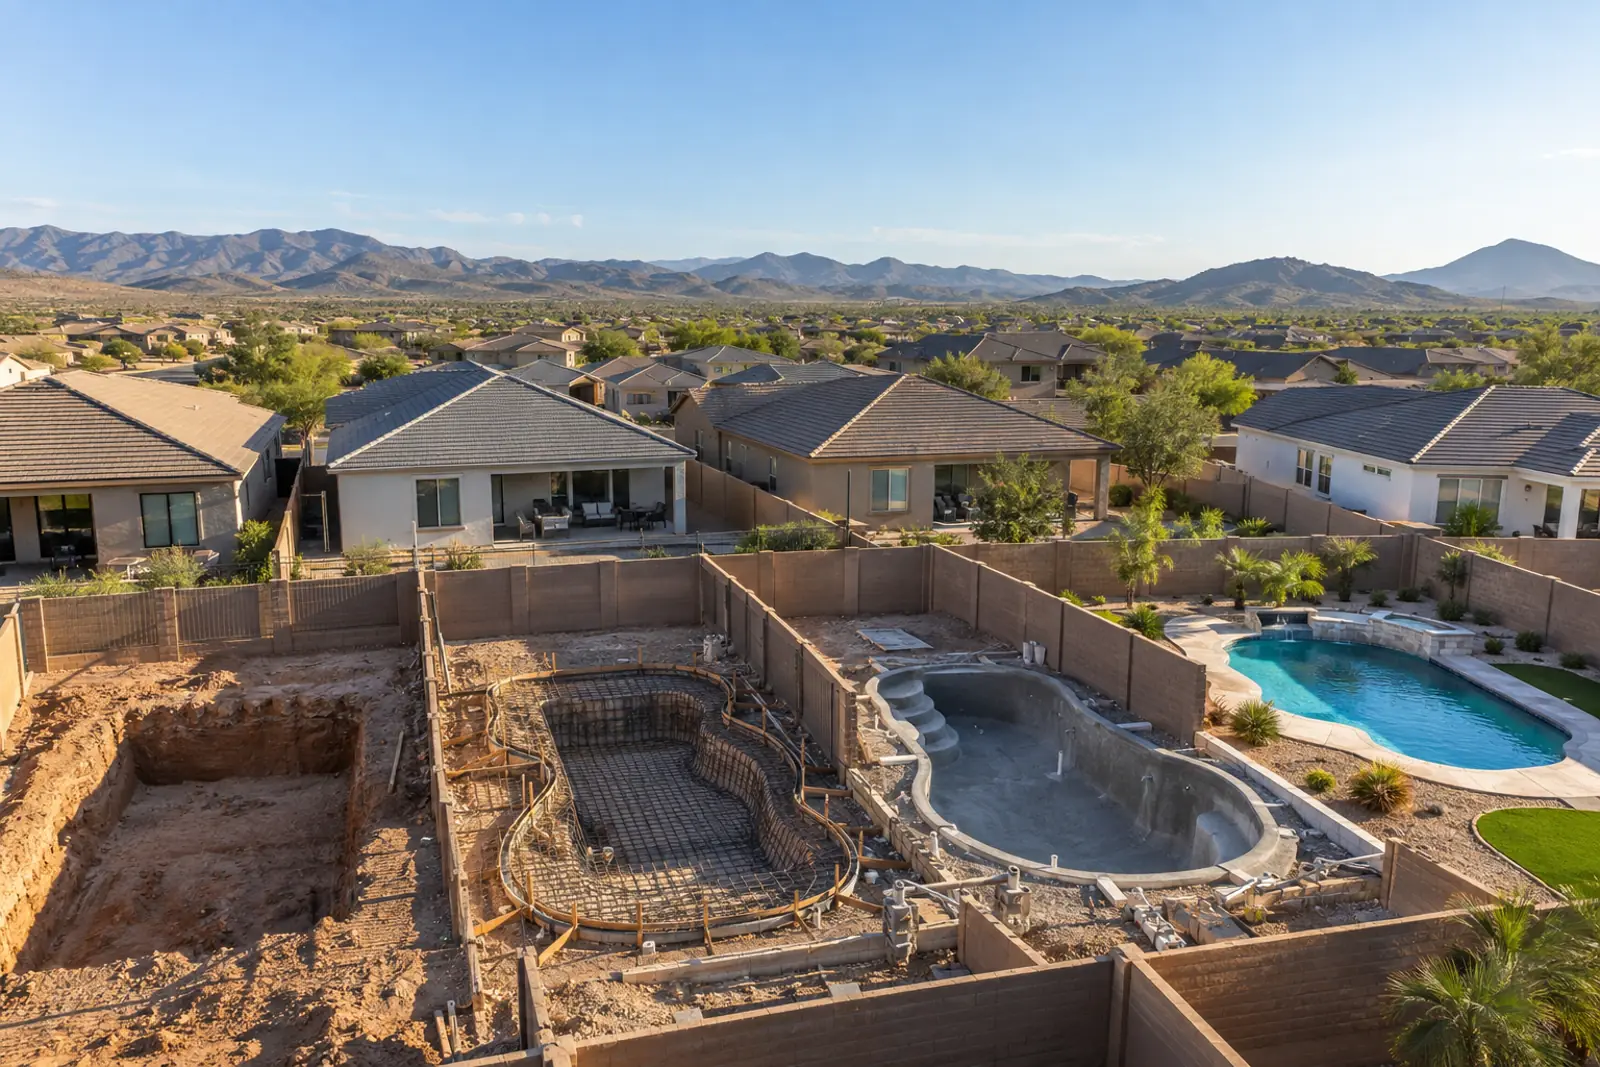
Pool Construction Statistics: New Pool Permits in 14 US Markets, 2015 to 2026
Number of Swimming Pools in the US: Published Estimates Reconciled

Pool Permit Processing Time: Days From Application to Issue in 12 US Cities, 2019 to 2026
Pool Removal Statistics: Permit Counts for US Cities, 2015 to 2026
Percentage of Homes With Pools by Metro and State: Backyard Pool Prevalence Index

How Many Homes Have a Hot Tub? US State Atlas of Hot Tub and Spa Ownership, 2024
All pool industry research (40 reports)