Neglected Pool Complaints: Green Pool Reports in Seven US Pool Markets, 2017 to 2026
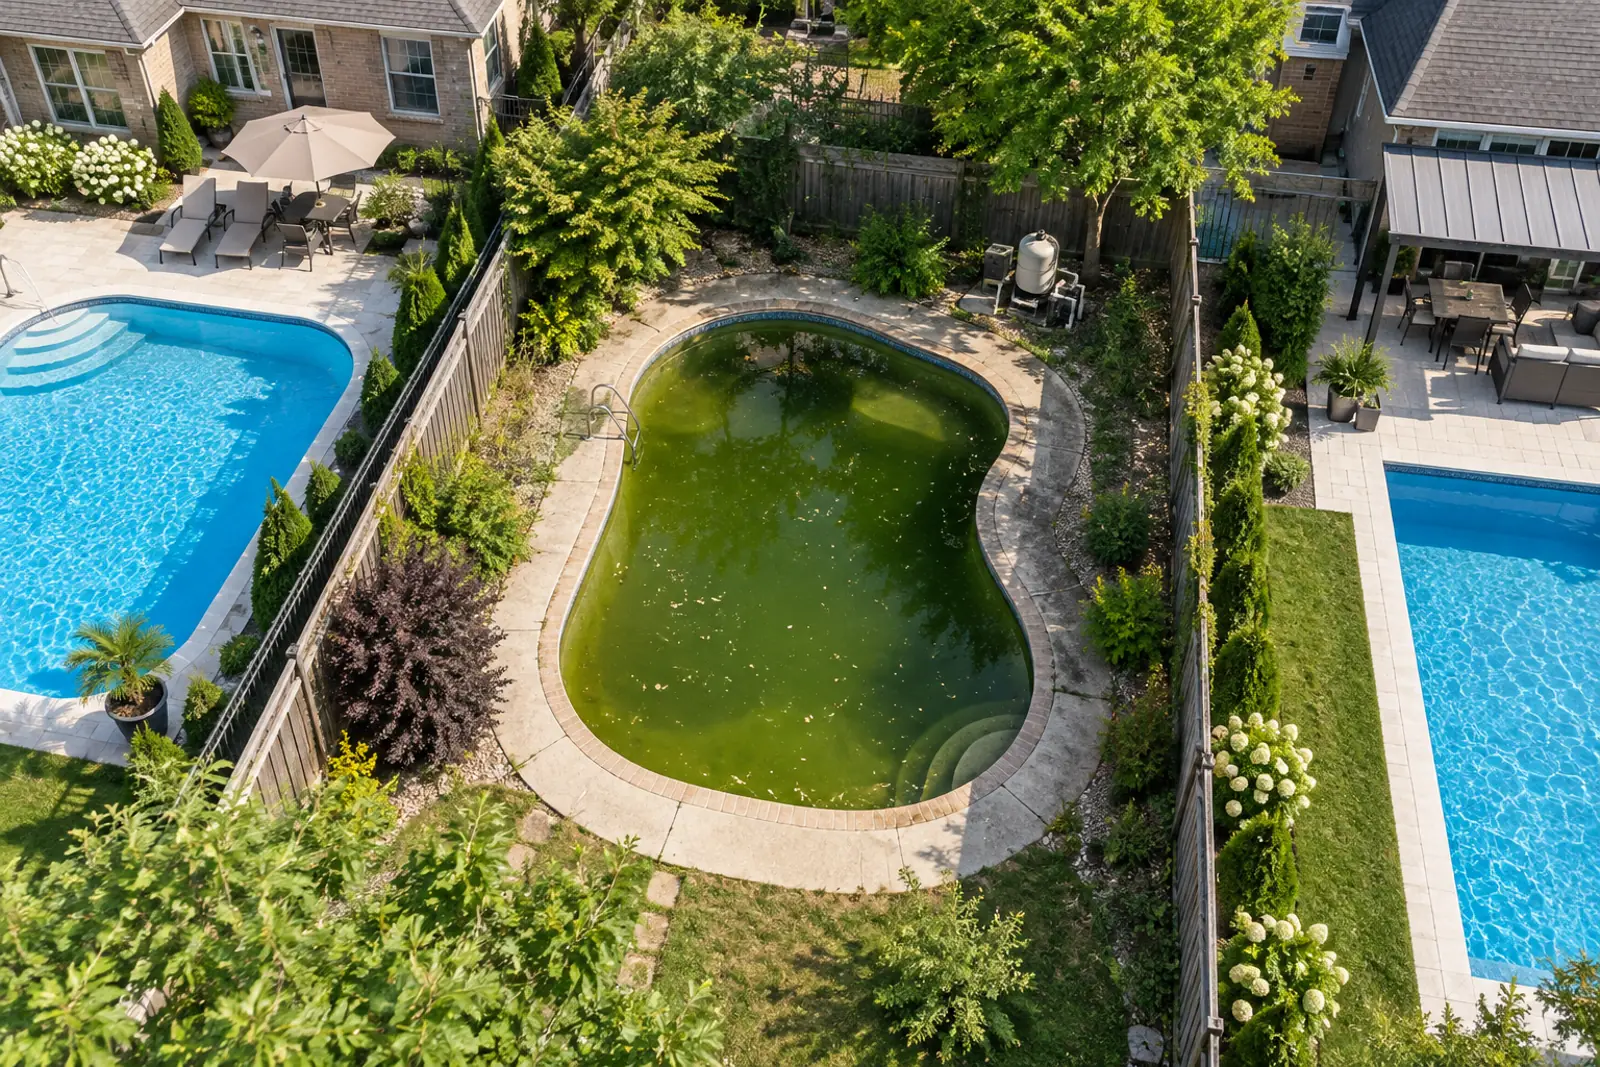
Neglected pool complaints to city code enforcement in major Sun Belt pool markets ran from 35 to 282 per city in the latest year of open data (2025 to September 2026), and 81% arrive April to October. These are floors: county vector control takes far more reports; Maricopa County logged about 9,500 mosquito or green pool complaints in 2021.
How we built the dataset
- Searched city, county and state open-data portals (Socrata, CKAN, ArcGIS) in Arizona, Nevada, Texas, Florida and California for code enforcement, 311 and vector control records with a pool field or text.
- Pulled every record mentioning a pool, spa or hot tub (or a pool-specific type or violation code) on October 8, 2026 via each portal’s API (scripts/pull.py).
- Classified free text with a rule that needs a pool word within 90 characters of a condition word; hand-checked 60 positives and 60 negatives.
- Removed repeat reports at the same address or parcel within 30 days; Phoenix, which has no dates, counts one per address per case year.
- Kept only years each source covers completely; 2026 is reported as year to date.
- Added published counts from vector control districts and Clark County, and ACS 2024 1-year households for rates.
- Computed every derived figure in scripts/ (analyze.py, build_derived.py) and listed it in derived.csv.
Included: City and county records describing a green, stagnant, algae-filled, mosquito-breeding or unmaintained pool or spa; typed records where the agency’s type or code names a pool condition.
Excluded: Pool fences, gates, barriers, permits, draining or backwashing complaints, pool businesses, public pool inspection records, and Miami-Dade 311 (no green pool type; its pool types cover fence barriers and unsecured pools). Sacramento city 311 stagnant water requests were excluded because they do not identify pools.
Conflicting numbers: Agencies count different things (complaints, citations, requests, inspection lists). Each is labelled as published and compared only within the same agency. Where NNDSS provisional West Nile counts were revised, the same-week comparison from one table was used.
Derived metrics: Rates per 100,000 households divide complaints by ACS 2024 1-year households (table B11001). Seasonal shares divide monthly complaints by each source’s complete-period total. Percent changes compare the same agency and measure.
Caveats
- City code records miss complaints sent to county vector control, which handles most green pool reports in Arizona and California.
- Open data rarely reach back before 2016, so the foreclosure-era comparison uses agency reports with changing measures.
- Free-text classification is imperfect: 53 of 60 sampled positives were clearly correct.
- Counts are small; year-to-year swings can reflect forms, staffing or sweeps.
- Las Vegas data cover 2023 only and San Antonio’s pool type began in mid-2025.
Method last reviewed October 8, 2026.
The short version
- Phoenix code enforcement logged 274 green pool complaints in 2025, up 58.4% from 173 in 2024 (City of Phoenix open data).
- San Antonio 311 received 282 swimming pool water complaints from October 2025 to September 2026, with 54 in June 2026 alone (City of San Antonio 311 data).
- Mesa, Arizona averaged 82.8 neglected pool complaints a year from 2018 to 2025 and logged 100 in 2025 (City of Mesa open data).
- Across seven US sources, 81.0% of neglected pool complaints were filed April to October and 11.8% November to February (PC&S calculation).
- Unincorporated Clark County, Nevada responded to 436 green pool complaints in 2024, up 159.5% from 168 in 2021 (Clark County; Clark County newsletter, July 2022).
- Maricopa County Vector Control received about 9,500 mosquito abundance or green pool complaints in 2021, roughly 34.7 times Phoenix’s 2025 city code count (CDC MMWR).
- The Sacramento-Yolo district’s list of pools needing annual inspection fell 44.9%, from 1,741 in 2022 to 959 in 2025 (SYMVCD 2025 report).
What the permit data shows
- Phoenix, Arizona: 274 green pool complaints in property maintenance cases in 2025 and 171 in 2026 through September (City of Phoenix open data).
- Phoenix, Arizona: green pool complaints were 0.71% of the 38,707 property maintenance cases with a 2025 case number (City of Phoenix open data).
- Mesa, Arizona: neglected pool complaints ranged from 58 (2024) to 104 (2019) a year between 2018 and 2025 (City of Mesa open data).
- Mesa, Arizona: 76 complaints from January 1 to September 30, 2026, up 40.7% from 54 in the same period of 2025 (City of Mesa open data).
- Tucson, Arizona: 53 neglected pool complaints in 2025 and 77 from January to September 2026, against 38 in the same period of 2025 (City of Tucson open data).
- Orlando, Florida: neglected pool complaints fell 64.3% from 98 in 2017 to 35 in 2025 (City of Orlando open data).
- San Antonio, Texas: 49.6 swimming pool water complaints per 100,000 households in the 12 months to September 2026 (City of San Antonio 311 data; households from ACS 2024 1-year).
- Las Vegas, Nevada: 265 parcels cited under pool waste water or imminent hazard pool codes in 2023, or 104.5 per 100,000 households (City of Las Vegas open data).
- San Joaquin County, California: 333 pool property inspection requests to the vector control district in 2024 and 345 in 2023 (San Joaquin County MVCD Annual Report 2024).
- Greater Los Angeles County: the vector control district monitors more than 5,000 improperly maintained pools (page accessed October 2026) (GLACVCD).
- Sacramento and Yolo counties: new pools added as mosquito breeding sources fell 51.3%, from 520 in 2012 to 253 in 2015 (SYMVCD 2012 report; SYMVCD 2015 report).
- Contra Costa County, California: swimming pool service requests rose 300 percent in 2008 during the foreclosure crisis (Contra Costa MVCD 2008 report).
- Kern County, California: notices of delinquency rose 300% in spring 2007 versus 2006, and 140 human West Nile virus cases were confirmed around Bakersfield that year; the study reports an association only (Reisen et al., Emerging Infectious Diseases).
How we counted neglected pool complaints in city open data
No agency publishes a national count of green pool complaints, so this report builds one from public records. We pulled every record that mentions a pool from seven city and county open-data sources, classified the text, and removed repeat reports.
The pull covered 6,052 records that mention a pool, from City of Phoenix open data, City of Mesa open data, City of Tucson open data, City of Las Vegas open data, City of San Antonio 311 data, City of Orlando open data and San Bernardino County Public Health. Of those, 3,823 described a neglected pool and 3,082 remained after removing repeat reports at the same address.
- Counted: a pool, spa or hot tub word within 90 characters of a condition word such as green, stagnant, algae, mosquito, murky, unmaintained, neglected, half-filled or standing water.
- Typed sources: San Antonio’s 311 type Water Concerns(Swimming Pool), Las Vegas violation codes 16.30 pool waste water and 9.04.010 imminent hazard pool, and San Bernardino County’s Mosquito / Green Pool service requests were counted as recorded.
- Excluded: pool fences and gates, permits, pool draining into streets, pool businesses, Orlando business tax receipts, and the word pooling.
- Deduplicated: a second report at the same address or parcel within 30 days is the same complaint. Phoenix has no dates, so it counts one complaint per address per case year.
- No addresses published: raw extracts keep only dates, types, matched terms and one-way address hashes.
| Jurisdiction | Agency | Record type used | Coverage in open data | Complete years used | Records mentioning a pool | Classified as neglected pool | Counted after 30-day dedupe |
|---|---|---|---|---|---|---|---|
| Phoenix, AZ | City of Phoenix Neighborhood Services Dept. | Property maintenance complaint notes | 2024 to Sep 2026 (case-number year) | 2024 to 2025 | 737 | 650 | 618 |
| Mesa, AZ | City of Mesa Code Compliance | Code case descriptions | Jun 2017 to Oct 2026 | 2018 to 2025 | 1314 | 825 | 788 |
| Tucson, AZ | City of Tucson Code Enforcement | Code case descriptions | 2022 to Oct 2026 (sparse before 2023) | 2023 to 2025 | 409 | 269 | 264 |
| Las Vegas, NV | City of Las Vegas Code Enforcement | Violation codes 16.30 pool waste water and 9.04.010 imminent hazard pool | 2015 to Feb 2024 (only 2023 well populated) | 2023 | 556 | 556 | 276 |
| San Antonio, TX | City of San Antonio 311 / Development Services | 311 type Water Concerns(Swimming Pool) | Jun 2025 to Sep 2026 (type first appears mid-2025) | Oct 2025 to Sep 2026 | 348 | 348 | 298 |
| Orlando, FL | City of Orlando Code Enforcement | Case comments and case type Pool | 1994 to Sep 2026 (complete from 2017) | 2017 to 2025 | 2109 | 596 | 511 |
| San Bernardino County, CA | San Bernardino County Public Health | Service requests Mosquito / Green Pool | Jul 2017 to Jun 2024 (sparse after 2021) | 2018 to 2021 | 579 | 579 | 327 |
Source: City of Phoenix open data, City of Mesa open data, City of Tucson open data, City of Las Vegas open data, City of San Antonio 311 data, City of Orlando open data, San Bernardino County Public Health; PC&S classification. Download CSV
Green pool complaints per year by city, 2017 to 2026
Annual counts are small, in the dozens to low hundreds per city. Phoenix and San Antonio log the most city complaints; Orlando has the fewest and has declined since 2017.
| Jurisdiction | 2017 | 2018 | 2019 | 2020 | 2021 | 2022 | 2023 | 2024 | 2025 | 2026 YTD |
|---|---|---|---|---|---|---|---|---|---|---|
| Phoenix, AZ | 173 | 274 | 171 | |||||||
| Mesa, AZ | 96 | 104 | 61 | 87 | 71 | 85 | 58 | 100 | 83 | |
| Tucson, AZ | 40 | 51 | 53 | 82 | ||||||
| Las Vegas, NV | 265 | |||||||||
| San Antonio, TX | 252 | |||||||||
| Orlando, FL | 98 | 61 | 56 | 54 | 39 | 29 | 23 | 33 | 35 | 28 |
| San Bernardino County, CA | 64 | 100 | 58 | 58 |
Source: PC&S analysis of City of Phoenix open data, City of Mesa open data, City of Tucson open data, City of Las Vegas open data, City of San Antonio 311 data, City of Orlando open data and San Bernardino County Public Health open data, pulled 2026-10-08. Download CSV
Years outside each source's complete coverage are blank.
Source: PC&S analysis of City of Phoenix, Mesa, Tucson, Orlando and San Bernardino County Public Health open data, pulled 2026-10-08. Download chart data (CSV)
Phoenix recorded 173 green pool complaints in 2024 and 274 in 2025 (City of Phoenix open data). Mesa ranged from 58 in 2024 to 104 in 2019 and logged 100 in 2025 (City of Mesa open data). Tucson logged 40 in 2023, 51 in 2024 and 53 in 2025 (City of Tucson open data).
Orlando logged 98 complaints in 2017, its first complete year in the file, then 35 in 2025 (City of Orlando open data). September 2017 alone held 25 Orlando complaints. San Bernardino County Public Health logged between 58 and 100 green pool service requests a year from 2018 to 2021 (San Bernardino County Public Health).
Neglected pool complaints per 100,000 households
Scaled by households, city code complaints run from 22.7 to 50.0 per 100,000 households a year in Arizona, Texas and Florida cities. Las Vegas pool citations and a California vector district’s pool inspection requests run at two to three times the Mesa rate.
| Jurisdiction | Period | Neglected pool complaints | Households (ACS 2024 1-year) | Complaints per 100,000 households |
|---|---|---|---|---|
| San Joaquin County, CA (vector district, pool inspection requests) | 2024 | 333 | 252693 | 131.8 |
| Las Vegas, NV | 2023 | 265 | 253523 | 104.5 |
| Mesa, AZ | 2025 | 100 | 199972 | 50.0 |
| San Antonio, TX | Oct 2025 to Sep 2026 | 282 | 568979 | 49.6 |
| Phoenix, AZ | 2025 | 274 | 631270 | 43.4 |
| Orlando, FL | 2025 | 35 | 137393 | 25.5 |
| Tucson, AZ | 2025 | 53 | 233314 | 22.7 |
Source: PC&S calculation from city open data, San Joaquin County MVCD Annual Report 2024 and US Census Bureau ACS 2024 1-year (table B11001). Download CSV
San Joaquin County counts vector district requests; the others count city code complaints.
Source: PC&S calculation from city open data, San Joaquin County MVCD and US Census Bureau ACS 2024 1-year (table B11001). Download chart data (CSV)
Mesa logged 50.0 complaints per 100,000 households in 2025, San Antonio 49.6 in the 12 months to September 2026, and Phoenix 43.4 in 2025. Orlando (25.5) and Tucson (22.7) were lowest in 2025. Green pools were 1.34% of all Mesa code cases in 2025, 0.71% of Phoenix property maintenance cases and 0.12% of Orlando code cases (City of Mesa open data; City of Phoenix open data; City of Orlando open data).
For context on pool density behind these rates, see the share of US homes with pools and the number of swimming pools in the US.
When green pool complaints peak: April to October
Complaints follow the mosquito season. Across 2,739 dated complaints from seven sources, 81.0% were filed April to October and only 11.8% November to February, with August (12.8%) and September (12.7%) the busiest months.
Source: PC&S analysis of Mesa, Tucson, Orlando, Las Vegas, San Bernardino County and San Antonio open data; San Joaquin County MVCD Annual Report 2024. Download chart data (CSV)
| Month | Mesa, AZ (% of year) | Tucson, AZ (% of year) | Orlando, FL (% of year) | Las Vegas, NV (% of year) | San Bernardino County, CA (% of year) | San Antonio, TX (% of year) | San Joaquin County, CA (% of year) | All seven sources pooled (%) |
|---|---|---|---|---|---|---|---|---|
| Jan | 2.1 | 0.7 | 4.0 | 1.1 | 2.9 | 3.5 | 3.7 | 2.8 |
| Feb | 4.4 | 0.7 | 3.5 | 1.5 | 2.1 | 2.1 | 2.7 | 2.9 |
| Mar | 8.0 | 9.0 | 9.3 | 1.9 | 3.6 | 4.3 | 9.6 | 7.2 |
| Apr | 11.9 | 9.0 | 8.6 | 6.0 | 13.2 | 11.7 | 15.0 | 11.6 |
| May | 8.8 | 13.9 | 8.4 | 7.5 | 8.2 | 15.6 | 10.8 | 10.0 |
| Jun | 8.3 | 19.4 | 11.7 | 7.9 | 8.9 | 19.1 | 9.6 | 10.9 |
| Jul | 10.9 | 9.7 | 13.3 | 6.4 | 11.8 | 16.3 | 14.6 | 12.3 |
| Aug | 13.3 | 13.2 | 9.8 | 15.8 | 15.7 | 11.3 | 12.4 | 12.8 |
| Sep | 9.2 | 8.3 | 15.2 | 32.8 | 11.1 | 5.3 | 11.5 | 12.7 |
| Oct | 13.4 | 9.0 | 9.8 | 14.0 | 13.6 | 6.4 | 8.1 | 10.7 |
| Nov | 7.7 | 4.9 | 3.5 | 4.9 | 6.4 | 3.5 | 1.2 | 4.5 |
| Dec | 2.0 | 2.1 | 2.8 | 0.0 | 2.5 | 0.7 | 0.9 | 1.6 |
Source: PC&S analysis of City of Mesa open data, City of Tucson open data, City of Orlando open data, City of Las Vegas open data, San Bernardino County Public Health and City of San Antonio 311 data open data; San Joaquin County MVCD Annual Report 2024. Download CSV
Peak months differ by place. San Joaquin County requests peaked in April, Tucson and San Antonio in June, San Bernardino County in August, Orlando and Las Vegas in September, and Mesa in October. Every source filed at least 75.8% of its complaints between April and October, from 75.8% in Mesa to 90.6% in Las Vegas.
Source: PC&S analysis of City of San Antonio 311 All Service Calls, pulled 2026-10-08. Download chart data (CSV)
San Antonio shows the spring climb clearly: 12 complaints in March 2026, 33 in April, 44 in May and 54 in June, 19.1% of the 12-month total in a single month (City of San Antonio 311 data).
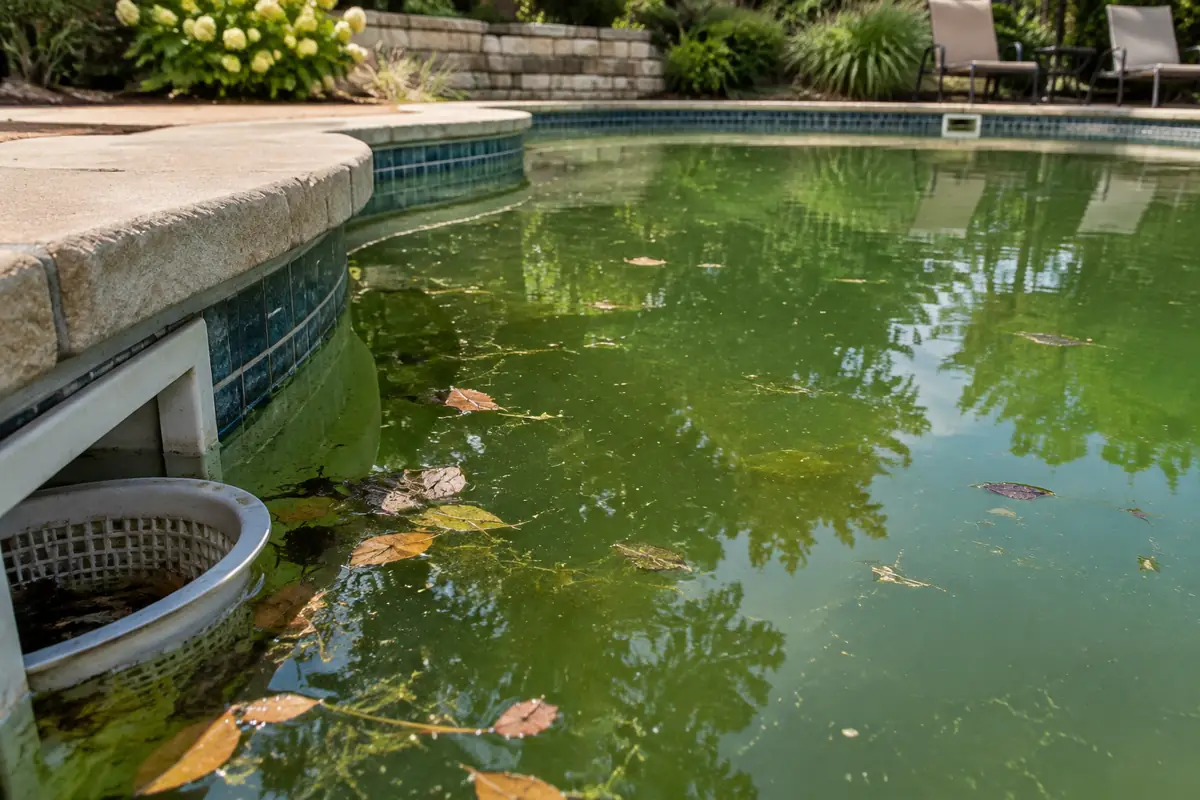
For the months pools are typically in use, see pool season length by city. Maricopa County says a pool will not breed mosquitoes if the pump runs several hours a day; see the cost to run a pool pump.
County vector control districts also field green pool reports, often at larger scale
Mosquito and vector control districts take green pool reports alongside city code offices, especially in Arizona and California. Their published counts are often larger than city code counts, but few release complaint-level data.
Maricopa County Environmental Services Vector Control received about 9,500 mosquito abundance or green pool complaints in 2021, 40% more than average, during the county’s largest West Nile virus outbreak (CDC MMWR). That figure combines mosquito and pool complaints and is about 34.7 times Phoenix’s 2025 city code count.
Unincorporated Clark County, Nevada responded to 436 green pool complaints in 2024, up from 168 in 2021 (Clark County; Clark County newsletter, July 2022). The San Joaquin County district received 333 pool property inspection requests in 2024 out of 2,445 service requests (San Joaquin County MVCD Annual Report 2024); in 2025 it sent 592 pool letters after aerial surveys, received 388 direct responses and obtained 12 warrants for neglected pools (San Joaquin County MVCD Annual Report 2025). The Greater Los Angeles County district monitors more than 5,000 improperly maintained pools (GLACVCD).
| Agency | Measure (as published) | Year | Value |
|---|---|---|---|
| Clark County, NV (unincorporated), Code Enforcement | Green pool complaints responded to | 2021 | 168 |
| Clark County, NV (unincorporated), Code Enforcement | Green pool complaints responded to | 2024 | 436 |
| San Joaquin County, CA, Mosquito and Vector Control District | Property inspection (pools) service requests | 2023 | 345 |
| San Joaquin County, CA, Mosquito and Vector Control District | Property inspection (pools) service requests | 2024 | 333 |
| San Joaquin County, CA, Mosquito and Vector Control District | Inspection warrants issued for neglected swimming pools | 2025 | 12 |
| Greater Los Angeles County Vector Control District | Improperly maintained pools monitored | current page, accessed Oct 2026 | more than 5,000 |
| Sacramento-Yolo Mosquito and Vector Control District | Swimming pools added as new mosquito breeding sources | 2012 | 520 |
| Sacramento-Yolo Mosquito and Vector Control District | Swimming pools added as new mosquito breeding sources | 2013 | 340 |
| Sacramento-Yolo Mosquito and Vector Control District | Swimming pools added as new mosquito breeding sources | 2014 | 286 |
| Sacramento-Yolo Mosquito and Vector Control District | Swimming pools added as new mosquito breeding sources | 2015 | 253 |
| Sacramento-Yolo Mosquito and Vector Control District | Pool inspections by field technicians | 2012 | 8,989 |
| Sacramento-Yolo Mosquito and Vector Control District | Pool inspections by field technicians | 2015 | 5,222 |
| Sacramento-Yolo Mosquito and Vector Control District | Swimming pools requiring annual inspection | 2022 | 1,741 |
| Sacramento-Yolo Mosquito and Vector Control District | Swimming pools requiring annual inspection | 2023 | 1,487 |
| Sacramento-Yolo Mosquito and Vector Control District | Swimming pools requiring annual inspection | 2024 | 1,263 |
| Sacramento-Yolo Mosquito and Vector Control District | Swimming pools requiring annual inspection | 2025 | 959 |
| Contra Costa Mosquito and Vector Control District | Change in swimming pool service requests | 2008 | +300% |
Sources: Clark County; Clark County newsletter, July 2022; San Joaquin County MVCD Annual Report 2024; San Joaquin County MVCD Annual Report 2025; GLACVCD; Sacramento-Yolo MVCD annual reports (SYMVCD 2012 report, SYMVCD 2022 report, SYMVCD 2025 report); Contra Costa MVCD 2008 report. Download CSV
The 2008 to 2012 foreclosure-era peak versus today
None of the open datasets in this pull covers 2008 to 2012 completely, so the foreclosure-era comparison rests on agency reports. They show far more problem pools then than now, but the measures change over time.
Contra Costa County’s vector control district reported that swimming pool service requests rose 300 percent in 2008, after a record number of unkempt pools in 2007 (Contra Costa MVCD 2008 report). In Kern County, notices of delinquency rose 300% in spring 2007 and the Bakersfield area recorded 140 confirmed human West Nile virus cases that year; 31 neglected pools sampled in 2008 produced 8,978 adult mosquitoes (Reisen et al., Emerging Infectious Diseases).
The district did not publish either measure for 2016 to 2021.
Source: Sacramento-Yolo Mosquito and Vector Control District annual reports 2012, 2013, 2014, 2015, 2022, 2023, 2024, 2025. Download chart data (CSV)
The Sacramento-Yolo district held a database of just over 6,200 problem pools in 2012 and performed 8,989 pool inspections that year (SYMVCD 2012 report). New breeding-source pools fell from 520 in 2012 to 253 in 2015, a 51.3% drop (SYMVCD 2015 report). By 2025 the district’s annual inspection list held 959 pools, down 44.9% from 1,741 in 2022 (SYMVCD 2022 report; SYMVCD 2025 report). The 2012 database is about 6.5 times the 2025 list, but the two use different definitions.
2026 so far: year-to-date green pool complaints
Through September 2026, Mesa and Tucson are running well above 2025 while Orlando is flat. The counts are small, so modest changes move the percentages a lot.
| Jurisdiction | Jan 1 to Sep 30, 2025 | Jan 1 to Sep 30, 2026 | Change (%) |
|---|---|---|---|
| Mesa, AZ | 54 | 76 | 40.7 |
| Tucson, AZ | 38 | 77 | 102.6 |
| Orlando, FL | 28 | 28 | 0.0 |
Source: PC&S analysis of City of Mesa open data, City of Tucson open data and City of Orlando open data, pulled 2026-10-08. Download CSV
Mesa logged 76 complaints from January 1 to September 30, 2026 versus 54 a year earlier (up 40.7%). Tucson logged 77 versus 38 (up 102.6%). Orlando logged 28 in both periods. San Antonio logged 252 swimming pool water complaints from January to September 2026 (City of San Antonio 311 data); its type did not exist for the same months of 2025.
Fines, abatement and reporting rules for neglected pools
Agencies can treat a neglected pool, drain it or charge the owner. Penalties and procedures vary by state and city.
- Las Vegas: non-compliance can bring a $350 pool pumping fee and a $120 failed inspection fee (May 2026, City of Las Vegas).
- Unincorporated Clark County: officers post a declaration of imminent danger giving owners 72 hours to drain a confirmed green pool before the county acts (KLAS 8 News Now).
- California: a mosquito abatement district board may impose a civil penalty of up to $1,000 per day of non-compliance (California Health and Safety Code 2063).
- San Joaquin County: after letters and a Notice of Inspection, the district obtained 12 warrants for neglected swimming pools in 2025 (San Joaquin County MVCD Annual Report 2025).
- Santa Clara County: reports of neglected pools can be anonymous, and the district does not respond to complaints about over or under-chlorinated pools or pools with debris (Santa Clara County Vector Control District).
Owners of a long-neglected pool can restore it, with pool cleaning service or pool repair, or remove it; pool removal statistics show how often cities permit removals.
Measures we built from the data
Complaints per year by jurisdiction
How many neglected pool complaints do major pool markets log each year?
count of classified records after 30-day same-address dedupe, by year of filingInputs: fact rows #1 to #37 (city and county pulls)
Limitations: City code records only; county vector control complaints are excluded except where an agency publishes a total.
Seasonality
When do neglected pool complaints peak?
monthly complaints / all complaints in each source's complete period, pooled across seven sourcesInputs: derived D11 to D39
Limitations: Larger sources weigh more; Phoenix has no dates; one year only for Las Vegas and San Antonio.
Complaints per 100,000 households
How do cities compare once size is removed?
complaints / ACS 2024 1-year households x 100,000Inputs: derived D1 to D7
Limitations: Denominator is all households, not households with pools; periods and record types differ.
Foreclosure era versus today
Were neglected pools a bigger problem in 2008 to 2012?
percent change within one agency's published seriesInputs: derived D47 to D50; fact rows #45 to #57
Limitations: Measures change between periods; no open dataset in the pull covers 2008 to 2012 completely.
Latest data in this edition
- Phoenix property maintenance data (file dated 2026-10-01) show 171 green pool complaints in 2026 so far (City of Phoenix open data).
- San Antonio’s 311 swimming pool water complaints peaked at 54 in June 2026 and fell to 15 in September 2026 (City of San Antonio 311 data).
- The City of Las Vegas reminded owners that non-compliant green pools can draw a $350 pumping fee and a $120 failed inspection fee (City of Las Vegas).
- Mesa logged 76 and Tucson 77 neglected pool complaints from January to September 2026, up from 54 and 38 a year earlier (City of Mesa open data; City of Tucson open data).
Quick answers
What happens if you don't maintain your pool?
A neglected pool can draw a code or vector control complaint, an inspection, mosquito treatment and fees. Las Vegas can charge a $350 pumping fee and a $120 failed inspection fee (City of Las Vegas), and California districts may impose up to $1,000 per day (California Health and Safety Code 2063).
Can I report a neighbor's green pool?
Yes. City code offices and county vector control districts take reports; Santa Clara County accepts anonymous reports (Santa Clara County Vector Control District), and unincorporated Clark County responded to 436 green pool complaints in 2024 (Clark County).
Do green pools breed mosquitoes?
They can. In 31 neglected Bakersfield pools sampled in 2008, collections produced 8,978 adult mosquitoes (Reisen et al., Emerging Infectious Diseases). CDC lists unmaintained swimming pools among Culex egg-laying sites (CDC).
How fast does a pool turn green?
No agency in this review publishes an algae timeline. The mosquito clock is better documented: a Culex egg becomes an adult in 7 to 10 days (CDC), and Maricopa County says a pool will not breed mosquitoes if the pump runs several hours a day (Maricopa County Environmental Services).
Can you get fined for a green pool?
Yes, in many places. Las Vegas lists a $350 pumping fee plus a $120 failed inspection fee (City of Las Vegas); California abatement districts may impose civil penalties of up to $1,000 per day (California Health and Safety Code 2063).
Questions and answers
How many neglected pool complaints does Phoenix get a year?
City of Phoenix property maintenance records show 274 green pool complaints in 2025 and 173 in 2024 (City of Phoenix open data). Maricopa County’s vector control division also takes green pool reports, so the city figure is a floor.
Which month has the most green pool complaints?
Pooled across seven sources, August (12.8%) and September (12.7%) are the busiest months, and 81.0% of complaints arrive April to October.
Are green pool complaints rising in 2026?
In Mesa and Tucson, yes: Mesa logged 76 from January to September 2026 versus 54 a year earlier, and Tucson 77 versus 38 (City of Mesa open data; City of Tucson open data). Orlando was flat at 28.
Who handles green pool complaints in Las Vegas?
City and county code enforcement. The City of Las Vegas cited 265 parcels under pool codes in 2023 (City of Las Vegas open data); unincorporated Clark County responded to 436 complaints in 2024 (Clark County).
How many neglected pools does Los Angeles County track?
The Greater Los Angeles County Vector Control District says it monitors more than 5,000 improperly maintained pools (GLACVCD).
How many green pool complaints does San Antonio receive?
San Antonio 311 logged 282 swimming pool water complaints from October 2025 to September 2026, peaking at 54 in June 2026 (City of San Antonio 311 data).
Did foreclosures cause more neglected pools?
Agency reports from the period describe a surge: Contra Costa pool service requests rose 300 percent in 2008 (Contra Costa MVCD 2008 report). Researchers linked delinquent mortgages to neglected pools in Kern County, an association rather than proof of cause (Reisen et al., Emerging Infectious Diseases; Goodman and Buehler, EID).
Can a green pool be fixed without draining it?
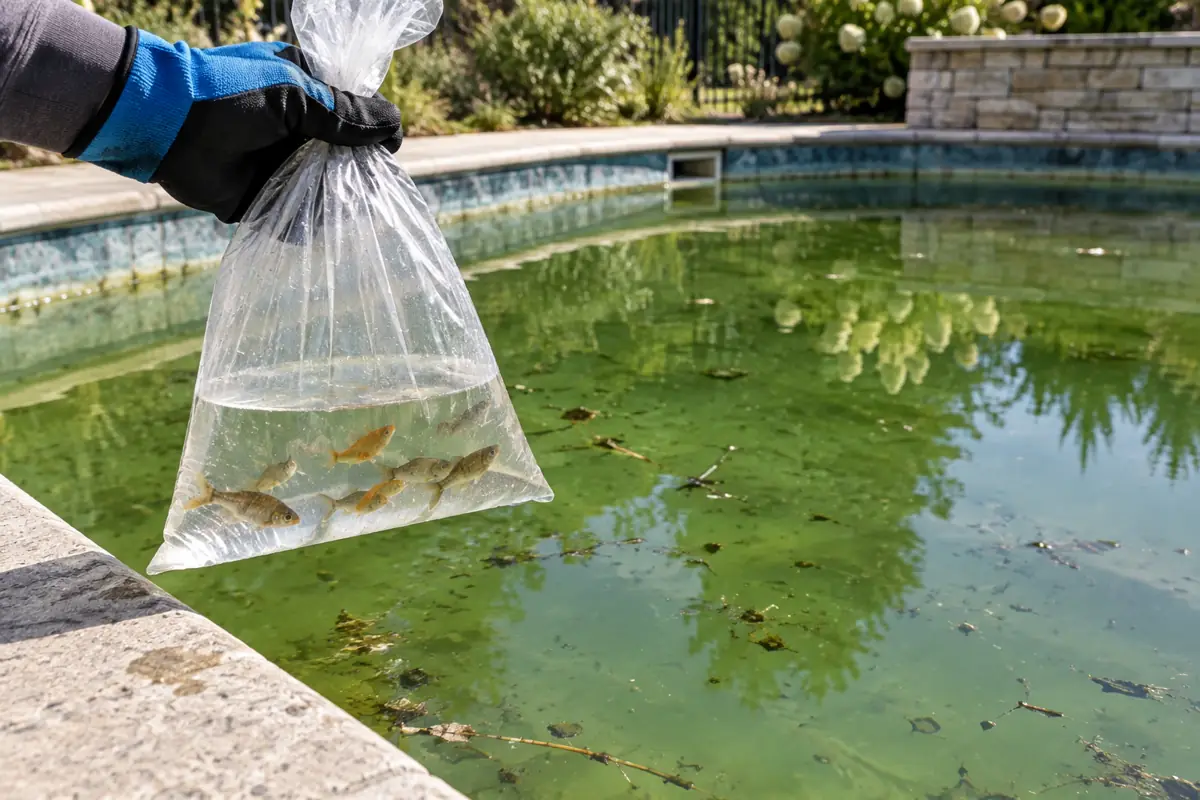
Vector control agencies often stock mosquitofish as a stopgap; Maricopa County says 15 Gambusia can clean a pool full of larvae (Maricopa County Environmental Services). Restoring the pool remains the owner’s responsibility (San Joaquin County MVCD Annual Report 2024).
How much can a California district fine for a neglected pool?
Up to $1,000 per day of non-compliance under California Health and Safety Code section 2063 (California Health and Safety Code 2063).
Is a green pool a West Nile virus risk?
Data, citation and press kit
Figures ready to quote
- Phoenix code enforcement logged 274 green pool complaints in 2025, up from 173 in 2024 (City of Phoenix open data). (City of Phoenix Neighborhood Services Department)
- Across seven US sources, 81% of neglected pool complaints from 2017 to 2026 were filed between April and October. (City of Mesa)
- San Antonio 311 logged 282 swimming pool water complaints in the 12 months to September 2026, with 54 in June 2026. (City of San Antonio)
- Maricopa County Vector Control received about 9,500 mosquito abundance or green pool complaints in 2021. (CDC MMWR)
- Unincorporated Clark County, Nevada responded to 436 green pool complaints in 2024. (Clark County, Nevada)
- The Sacramento-Yolo vector district’s list of pools needing annual inspection fell from 1,741 in 2022 to 959 in 2025. (Sacramento-Yolo Mosquito and Vector Control District)
- Contra Costa County’s swimming pool service requests rose 300 percent in 2008, at the height of the foreclosure crisis. (Contra Costa Mosquito and Vector Control District)
If you cite only a few sources
- Property Maintenance (file propertymaintenance20261001.csv), City of Phoenix Neighborhood Services Department
- 311 All Service Calls (ArcGIS layer), City of San Antonio
- Public Asked to Help Eliminate Mosquito Breeding Sources (May 19, 2025), Clark County, Nevada
- Annual Report 2025, Sacramento-Yolo Mosquito and Vector Control District
- Unprecedented Outbreak of West Nile Virus, Maricopa County, Arizona, 2021, CDC MMWR
Summary for editors
Pool Construction & Service counted 3,082 neglected or green pool complaints in open records from Phoenix, Mesa, Tucson, Las Vegas, San Antonio, Orlando and San Bernardino County, classifying 6,052 pool-related records filed from 2017 to September 2026. City code enforcement logs dozens to a few hundred complaints a year: Phoenix recorded 274 in 2025, San Antonio 282 in the 12 months to September 2026, Mesa 100 and Orlando 35 in 2025. Scaled by households, rates run from 22.7 per 100,000 in Tucson to 50.0 in Mesa. Complaints track the mosquito season, with 81% filed April to October. These city counts are floors: county vector control agencies receive most reports, and Maricopa County logged about 9,500 mosquito or green pool complaints in 2021. Agency reports show far more problem pools during the foreclosure era, and a shrinking list since: the Sacramento-Yolo district’s annual inspection list fell from 1,741 pools in 2022 to 959 in 2025.
Headlines the data supports
- Phoenix green pool complaints jump to 274 in 2025
- 81% of neglected pool complaints land between April and October
- San Antonio logs 282 swimming pool water complaints in a year, peaking in June
- City counts miss most green pools: Maricopa County fielded about 9,500 mosquito or green pool complaints in 2021
- Sacramento-area list of problem pools shrinks from 1,741 to 959 since 2022
How to cite this report
Pool Construction & Service. "Neglected Pool Complaints: Green Pool Reports in Seven US Pool Markets, 2017 to 2026." PC&S Research Desk, October 8, 2026. https://poolconstructionandservice.com/research/neglected-green-pools/
Reuse
The data tables and charts in this report are licensed under CC BY 4.0. Reuse them with this attribution: “Source: Pool Construction & Service (poolconstructionandservice.com), Neglected Pool Complaints: Green Pool Reports in Seven US Pool Markets, 2017 to 2026.” Figures from third-party sources remain subject to their publishers’ terms.
Download the data
- Sources, coverage and record counts, seven jurisdictions CSV
- Neglected pool complaints per year by jurisdiction, 2017 to 2026 CSV
- Complaints per 100,000 households, latest 12 months CSV
- Share of complaints by month, seven sources CSV
- Agency-published green pool counts, 2008 to 2025 CSV
- Year-to-date complaints, 2026 vs 2025 CSV
- Full fact sheet with sources and limitations CSV
How we graded sources
Tier 1: primary and government sources (28)
- City of Phoenix Neighborhood Services Department: Property Maintenance (file propertymaintenance20261001.csv)
- City of Mesa: Code Compliance dataset hgf6-yenu
- City of Tucson: Code Enforcement Cases (ArcGIS layer)
- City of Orlando: Code Enforcement Cases dataset k6e8-nw6w
- City of San Antonio: 311 All Service Calls (ArcGIS layer)
- City of Las Vegas: Code Enforcement Violations (ArcGIS layer)
- San Bernardino County Public Health: Green Pools (ArcGIS layer)
- Clark County, Nevada: Public Asked to Help Eliminate Mosquito Breeding Sources (May 19, 2025)
- San Joaquin County Mosquito and Vector Control District: Annual Report 2024
- San Joaquin County Mosquito and Vector Control District: Annual Report 2025
- Clark County, Nevada: District G Newsletter, July 2022
- Sacramento-Yolo Mosquito and Vector Control District: Annual Report 2012
- Sacramento-Yolo Mosquito and Vector Control District: Annual Report 2015
- Sacramento-Yolo Mosquito and Vector Control District: Annual Report 2022
- Sacramento-Yolo Mosquito and Vector Control District: Annual Report 2025
- Greater Los Angeles County Vector Control District: Green Pools and Mosquitoes
- Contra Costa Mosquito and Vector Control District: Annual Report 2008
- Emerging Infectious Diseases, CDC: Delinquent Mortgages, Neglected Swimming Pools, and West Nile Virus, California (2008)
- Emerging Infectious Diseases, CDC: Letter: Delinquent Mortgages, Neglected Swimming Pools, and West Nile Virus, California (2009)
- CDC MMWR: Unprecedented Outbreak of West Nile Virus, Maricopa County, Arizona, 2021
- CDC: Life Cycle of Culex Species Mosquitoes
- California Legislature: Health and Safety Code section 2063
- City of Las Vegas: Green Pool Health Hazards (May 14, 2026)
- Maricopa County Environmental Services Department: Enviro~Connections: Green Pools and Chlorine Tablet Shortage (June 17, 2021)
- County of Santa Clara Vector Control District: Report Standing Water and Neglected Pools (archived August 27, 2025)
- County of San Diego Vector Control Program: Neglected or Green Pools
- CDC: NNDSS Weekly Data (x9gk-5huc)
- US Census Bureau via Census Reporter: Table B11001 Household Type, ACS 2024 1-year
Tier 3: journalism and expert commentary (1)
Sources
- City of Phoenix Neighborhood Services Department. Property Maintenance (file propertymaintenance20261001.csv). Accessed 2026-10-08.
- City of Mesa. Code Compliance dataset hgf6-yenu. Accessed 2026-10-08.
- City of Tucson. Code Enforcement Cases (ArcGIS layer). Accessed 2026-10-08.
- City of Orlando. Code Enforcement Cases dataset k6e8-nw6w. Accessed 2026-10-08.
- City of San Antonio. 311 All Service Calls (ArcGIS layer). Accessed 2026-10-08.
- City of Las Vegas. Code Enforcement Violations (ArcGIS layer). Accessed 2026-10-08.
- San Bernardino County Public Health. Green Pools (ArcGIS layer). Accessed 2026-10-08.
- Clark County, Nevada. Public Asked to Help Eliminate Mosquito Breeding Sources (May 19, 2025). Accessed 2026-10-08.
- San Joaquin County Mosquito and Vector Control District. Annual Report 2024. Accessed 2026-10-08.
- San Joaquin County Mosquito and Vector Control District. Annual Report 2025. Accessed 2026-10-08.
- Clark County, Nevada. District G Newsletter, July 2022. Accessed 2026-10-08.
- Sacramento-Yolo Mosquito and Vector Control District. Annual Report 2012. Accessed 2026-10-08.
- Sacramento-Yolo Mosquito and Vector Control District. Annual Report 2015. Accessed 2026-10-08.
- Sacramento-Yolo Mosquito and Vector Control District. Annual Report 2022. Accessed 2026-10-08.
- Sacramento-Yolo Mosquito and Vector Control District. Annual Report 2025. Accessed 2026-10-08.
- Greater Los Angeles County Vector Control District. Green Pools and Mosquitoes. Accessed 2026-10-08.
- Contra Costa Mosquito and Vector Control District. Annual Report 2008. Accessed 2026-10-08.
- Emerging Infectious Diseases, CDC. Delinquent Mortgages, Neglected Swimming Pools, and West Nile Virus, California (2008). Accessed 2026-10-08.
- Emerging Infectious Diseases, CDC. Letter: Delinquent Mortgages, Neglected Swimming Pools, and West Nile Virus, California (2009). Accessed 2026-10-08.
- CDC MMWR. Unprecedented Outbreak of West Nile Virus, Maricopa County, Arizona, 2021. Accessed 2026-10-08.
- CDC. Life Cycle of Culex Species Mosquitoes. Accessed 2026-10-08.
- California Legislature. Health and Safety Code section 2063. Accessed 2026-10-08.
- City of Las Vegas. Green Pool Health Hazards (May 14, 2026). Accessed 2026-10-08.
- Maricopa County Environmental Services Department. Enviro~Connections: Green Pools and Chlorine Tablet Shortage (June 17, 2021). Accessed 2026-10-08.
- County of Santa Clara Vector Control District. Report Standing Water and Neglected Pools (archived August 27, 2025). Accessed 2026-10-08.
- County of San Diego Vector Control Program. Neglected or Green Pools. Accessed 2026-10-08.
- CDC. NNDSS Weekly Data (x9gk-5huc). Accessed 2026-10-08.
- US Census Bureau via Census Reporter. Table B11001 Household Type, ACS 2024 1-year. Accessed 2026-10-08.
- KLAS 8 News Now. Code enforcement officers tackling 'green pool' problem. Accessed 2026-10-08.
Related pool research
Pool Drowning Statistics by State: Deaths and Rates, 2018 to 2024
Pool Injury Statistics: U.S. Emergency Room Visits by Product, Age and Month, 2015 to 2024
Pool Product Recalls: A Registry of U.S. CPSC Recalls of Pool and Spa Products, 2001 to 2026
Pool Fence Laws by State: Residential Pool Barrier Rules in All 50 States and DC, 2026
Swimming Pool Illness Outbreaks: U.S. Registry of CDC-Reported Outbreaks, 2009 to 2023
Pool Electrocution Statistics: U.S. Deaths, Shock Injuries and the Equipment Involved
All pool industry research (40 reports)