Average cost to build a pool: what 2025 building permits show in 11 US cities and counties
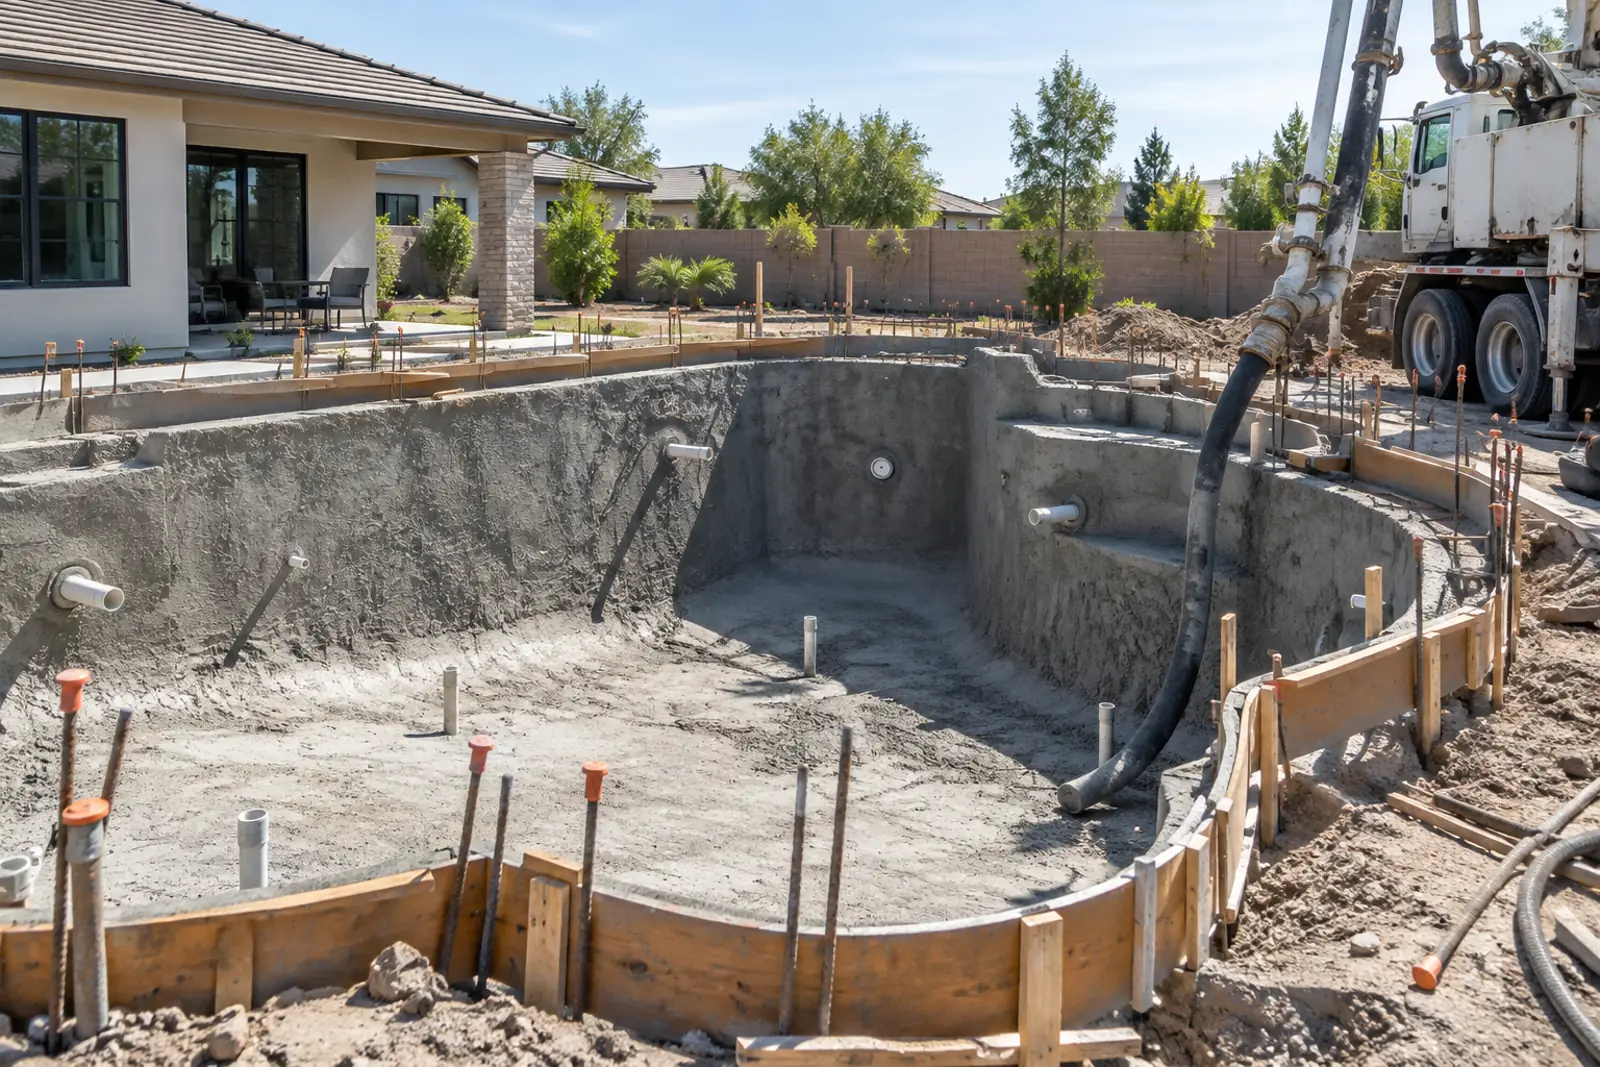
The average cost to build a pool, read from 2025 permits for new in-ground pools in 10 US cities and counties, centers on $68,000 (the middle city median). Medians ran from $47,418 in Mesa to $150,000 in Raleigh; Los Angeles, at $35,000, repeats default figures. Declared values are not invoices and can exclude decking, fencing and trade permits.
Average cost to build a pool by city, from 2025 permit values
The middle 2025 city median for a new residential in-ground pool was $68,000 across 10 declared-value jurisdictions. The spread between cities is wide: the Raleigh median is 4.3 times the Los Angeles median. Raleigh, Nashville-Davidson and Montgomery County sit at or above $100,000, while Los Angeles and Mesa sit below $50,000.
Raleigh had the highest 2025 median declared value, $150,000, with a middle half of $104,520 to $200,000 (City of Raleigh). Nashville-Davidson followed at $105,000 (Metro Nashville) and Montgomery County, Maryland at $100,000 (Montgomery County).
New Orleans recorded a 2025 median of $76,000 (City of New Orleans). Las Vegas recorded $70,000 (City of Las Vegas), Orlando $66,000 (City of Orlando), Fort Worth $65,000 (City of Fort Worth) and Cape Coral $60,000 (City of Cape Coral).
Mesa recorded a 2025 median of $47,418 (City of Mesa). Los Angeles recorded the lowest median, $35,000, on 1,069 permits (LADBS). San Diego recorded $50,502, but that figure comes from the city valuation schedule rather than from the owner or builder (City of San Diego IB-101).
| City | Value basis | Permits 2025 | Permits with usable value | Coverage % | 25th percentile $ | Median $ | 75th percentile $ | Mean $ | Most common value $ | Share at most common value % |
|---|---|---|---|---|---|---|---|---|---|---|
| Raleigh, NC | Declared on application | 120 | 101 | 84.2 | 104520 | 150000 | 200000 | 158001 | 150000 | 6.9 |
| Nashville-Davidson, TN | Declared on application | 247 | 245 | 99.2 | 75000 | 105000 | 167061 | 132086 | 100000 | 5.7 |
| Montgomery County, MD | Declared on application | 111 | 111 | 100.0 | 50000 | 100000 | 169127 | 120944 | 100000 | 9.9 |
| New Orleans, LA | Declared on application | 155 | 155 | 100.0 | 61406 | 76000 | 92442 | 80415 | 42000 | 2.6 |
| Las Vegas, NV | Declared on application | 527 | 525 | 99.6 | 55500 | 70000 | 89750 | 74327 | 65000 | 3.4 |
| Orlando, FL | Declared on application | 259 | 257 | 99.2 | 50000 | 66000 | 91465 | 76129 | 50000 | 7.8 |
| Fort Worth, TX | Declared on application | 407 | 394 | 96.8 | 50000 | 65000 | 87000 | 76817 | 65000 | 17.5 |
| Cape Coral, FL | Declared on application | 1229 | 1217 | 99.0 | 45000 | 60000 | 78500 | 69227 | 30000 | 6.2 |
| San Diego, CA | City valuation schedule (per sq ft) | 232 | 216 | 93.1 | 37620 | 50502 | 69968 | 59807 | 44688 | 2.8 |
| Mesa, AZ | Declared on application | 329 | 317 | 96.4 | 37498 | 47418 | 63750 | 55700 | 40000 | 6.0 |
| Los Angeles, CA | Declared on application | 1081 | 1069 | 98.9 | 29000 | 35000 | 50000 | 42727 | 30000 | 14.6 |
Source: PC&S analysis of city building-permit open data (City of Raleigh, Metro Nashville, Montgomery County, City of New Orleans, City of Las Vegas, City of Orlando, City of Fort Worth, City of Cape Coral, City of San Diego, City of Mesa, LADBS). Download CSV
Source: PC&S analysis of city building-permit open data (13 jurisdictions); San Diego values come from a city valuation schedule. Download chart data (CSV)
Pooling every usable 2025 permit from the 10 declared-value jurisdictions (4,391 permits) gives a median of $60,000, a mean of $70,745 and a middle half of $40,000 to $82,950. In that pool, 35.2% of values were below $50,000 and 14.7% above $100,000. Los Angeles and Cape Coral together supply about half of the pooled permits, which pulls the pooled median below the city midpoint.
What a declared permit value does and does not measure
A permit value is set before work starts, for the purpose of calculating fees and records. In this data it behaves in three different ways: as a builder declaration, as a figure repeated across many permits, and in San Diego as a schedule calculation. Each pattern changes how a city median should be read.
Fees give applicants a reason to keep the figure modest, but the amounts are small. Orlando charges $64.94 for the first $1,000 of construction cost and $4.32 for each additional $1,000 (City of Orlando, effective January 2023). At the 2025 Orlando median of $66,000, the base fee works out to $345.74, or 0.52% of the declared value. Orlando also says the construction cost is the ICC valuation table or the contracted price, whichever is greater.
California state fees collected in San Diego are also tied to valuation: the Strong Motion Instrumentation fee is 13 cents per $1,000 of estimated valuation on one- and two-story homes (City of San Diego IB-501).
Some cities show a single figure repeated across many permits. In Fort Worth, 17.5% of 2025 values were exactly $65,000; in 2019, 25.7% were exactly $10,000 or $11,000 (City of Fort Worth). In Los Angeles, 14.6% of 2025 values were exactly $30,000 (LADBS). Repeated identical figures are more consistent with template entries than with job-specific prices.
San Diego values follow the city valuation schedule, which sets $104 per square foot of surface area for a vinyl-lined pool, $114 for gunite, $124 for fiberglass and $22,291 for each spa or hot tub (IB-101). In 2025, 77.8% of San Diego pool values were exact multiples of $114; in 2019, 78.5% were multiples of $95; in 2022, 75.1% were multiples of $193 (City of San Diego). The San Diego series therefore tracks the schedule rate and pool size, not market prices, and is left out of cross-city medians, real-change figures and the cost-guide comparison.
How declared pool values changed from 2019 to 2025, before and after inflation
Nominal medians rose in every declared-value city with both years of data, but most of the rise matches general inflation and the price of construction inputs. The median city gained 16.4% after CPI-U and 3.8% after the PPI for residential construction inputs. Las Vegas, Mesa, Los Angeles and Fort Worth have been flat or lower since 2023 or 2024, while New Orleans and Raleigh kept rising.
| City | Value basis | 2019 | 2020 | 2021 | 2022 | 2023 | 2024 | 2025 | Years with coverage between 60% and 80% |
|---|---|---|---|---|---|---|---|---|---|
| Austin, TX | Declared on application | 50000 | 58921 | 2020 | |||||
| Cape Coral, FL | Declared on application | 60000 | None | ||||||
| East Baton Rouge Parish, LA | Declared on application | 43272 | 53712 | 60300 | 70000 | 82000 | 85000 | None | |
| Fort Worth, TX | Declared on application | 26300 | 30000 | 38637 | 50000 | 65000 | 65000 | 65000 | None |
| Las Vegas, NV | Declared on application | 50000 | 53245 | 58932 | 69150 | 72162 | 70493 | 70000 | None |
| Los Angeles, CA | Declared on application | 28000 | 26000 | 30000 | 35000 | 35750 | 37000 | 35000 | None |
| Mesa, AZ | Declared on application | 32900 | 34000 | 38978 | 45000 | 48300 | 50000 | 47418 | 2019 |
| Montgomery County, MD | Declared on application | 30000 | 40000 | 50000 | 70000 | 90000 | 100000 | 100000 | None |
| Nashville-Davidson, TN | Declared on application | 100000 | 105000 | None | |||||
| New Orleans, LA | Declared on application | 51600 | 52000 | 56400 | 63596 | 68365 | 69622 | 76000 | None |
| Orlando, FL | Declared on application | 45000 | 45000 | 55000 | 54000 | 42525 | 65000 | 66000 | None |
| Raleigh, NC | Declared on application | 89132 | 110506 | 110000 | 140230 | 150000 | None | ||
| San Diego, CA | City valuation schedule (per sq ft) | 47500 | 42988 | 46028 | 83955 | 82990 | 55119 | 50502 | None |
Source: PC&S analysis of city building-permit open data; blank cells are years below the reporting threshold or outside the published data. Download CSV
San Diego values are computed from a city valuation schedule, so its line reflects schedule rates rather than prices.
Source: PC&S analysis of city building-permit open data (13 jurisdictions). Download chart data (CSV)
Las Vegas peaked at $72,162 in 2023 and recorded $70,000 in 2025 (City of Las Vegas). Mesa peaked at $50,000 in 2024 and recorded $47,418 in 2025 (City of Mesa). Los Angeles peaked at $37,000 in 2024 and recorded $35,000 in 2025 (LADBS). Fort Worth has recorded $65,000 in each year from 2023 to 2025 (City of Fort Worth).
Orlando recorded an unusual dip to $42,525 in 2023 between $54,000 in 2022 and $65,000 in 2024 (City of Orlando). Orlando permit text is often an owner name, so the cause cannot be identified from the record.
| City | Median 2019 $ | Median 2019 in 2025 dollars (CPI-U) $ | Median 2025 $ | Nominal change % | Real change, CPI-U % | Real change, PPI residential construction inputs % | Share of 2019 values at the most common value % | Note |
|---|---|---|---|---|---|---|---|---|
| Montgomery County, MD | 30000 | 37797 | 100000 | 233.3 | 164.6 | 135.8 | 41.3 | None |
| Fort Worth, TX | 26300 | 33135 | 65000 | 147.1 | 96.2 | 74.9 | 13.4 | None |
| New Orleans, LA | 51600 | 65011 | 76000 | 47.3 | 16.9 | 4.2 | 2.6 | None |
| Orlando, FL | 45000 | 56696 | 66000 | 46.7 | 16.4 | 3.8 | 7.7 | None |
| Mesa, AZ | 32900 | 41451 | 47418 | 44.1 | 14.4 | 2.0 | 6.5 | 2019 coverage 60% to 80% |
| Las Vegas, NV | 50000 | 62995 | 70000 | 40.0 | 11.1 | -0.9 | 7.7 | None |
| Los Angeles, CA | 28000 | 35277 | 35000 | 25.0 | -0.8 | -11.6 | 17.5 | None |
| San Diego, CA | 47500 | 59845 | 50502 | 6.3 | -15.6 | -24.8 | 6.3 | City valuation schedule; not a market price |
Source: PC&S analysis of city building-permit open data; BLS CPI-U (CUUR0000SA0); BLS PPI inputs to residential construction, goods (WPUIP2311001). Download CSV
Montgomery County and Fort Worth 2019 values cluster at one or two default figures; San Diego is schedule-based.
Source: PC&S analysis of city building-permit open data (13 jurisdictions); BLS CPI-U (CUUR0000SA0). Download chart data (CSV)
CPI-U for all urban consumers rose 26.0% from its 2019 annual average to its 2025 annual average (BLS). The producer price index for goods used in residential construction rose 41.3% over the same years (BLS). Real change here uses CPI-U because the question is what an owner pays; the PPI column shows how much of the rise tracks materials prices.
Montgomery County (164.6% real) and Fort Worth (96.2% real) show the largest real increases, but both start from clustered 2019 values: 41.3% of Montgomery County 2019 values were exactly $30,000 (Montgomery County). Excluding those two, the median real change across the other 5 declared-value cities is 14.4% with CPI-U and 2.0% with the construction-input PPI.
Pool only vs pool and spa: what a spa adds to the declared value
In 7 of 8 declared-value cities where permit text separates the two, pool and spa permits carry a higher median than pool-only permits. The median premium is 26.6%, or $22,584. The premium may also reflect larger or higher-specification projects, which the permit data cannot separate from the spa itself.
| City | Pool only: permits | Pool only: median $ | Pool and spa: permits | Pool and spa: median $ | Difference $ | Difference % | Pool and spa share of classified permits % |
|---|---|---|---|---|---|---|---|
| Nashville-Davidson, TN | 201 | 100000 | 44 | 188204 | 88204 | 88.2 | 18.0 |
| Montgomery County, MD | 84 | 95000 | 27 | 150000 | 55000 | 57.9 | 24.3 |
| Cape Coral, FL | 981 | 57456 | 202 | 88848 | 31392 | 54.6 | 17.1 |
| Raleigh, NC | 59 | 123000 | 36 | 165100 | 42100 | 34.2 | 37.9 |
| San Diego, CA | 59 | 44688 | 142 | 54720 | 10032 | 22.4 | 70.6 |
| New Orleans, LA | 117 | 72900 | 38 | 86675 | 13775 | 18.9 | 24.5 |
| Mesa, AZ | 186 | 45000 | 131 | 51649 | 6649 | 14.8 | 41.3 |
| Los Angeles, CA | 207 | 35000 | 834 | 37000 | 2000 | 5.7 | 80.1 |
| Fort Worth, TX | 309 | 65000 | 45 | 47000 | -18000 | -27.7 | 12.7 |
Source: PC&S analysis of city building-permit open data; spa class from permit description text. Download CSV
Fort Worth pool-only values cluster at a 65,000 dollar figure.
Source: PC&S analysis of city building-permit open data (13 jurisdictions); spa classification from permit text. Download chart data (CSV)
Nashville-Davidson pool and spa permits had a 2025 median of $188,204, against $100,000 for pool-only permits (Metro Nashville). Cape Coral recorded $88,848 against $57,456 (City of Cape Coral). Los Angeles recorded $37,000 against $35,000, and 80.1% of classified Los Angeles permits include a spa (LADBS).
Fort Worth is the exception: pool and spa permits had a lower 2025 median ($47,000) than pool-only permits ($65,000), because many pool-only permits carry the repeated $65,000 figure (City of Fort Worth). Angi gives $44,000 to $120,000 for an in-ground pool with a hot tub (Angi).
Pool size and declared value in Las Vegas and Mesa
Two cities record pool size: Las Vegas publishes pool volume in gallons and Mesa permit text states the pool area. In Mesa the declared value rises with size; in Las Vegas it does not rise steadily with volume, which suggests the declared figure there is not closely tied to pool size.
| City | Size band | Size measure | Permits with usable value | 25th percentile $ | Median $ | 75th percentile $ |
|---|---|---|---|---|---|---|
| Las Vegas, NV | Under 10,000 gallons | Pool volume (GALLONS field) | 248 | 53554 | 64990 | 80000 |
| Las Vegas, NV | 10,000 to 14,999 gallons | Pool volume (GALLONS field) | 195 | 60000 | 75000 | 95902 |
| Las Vegas, NV | 15,000 gallons or more | Pool volume (GALLONS field) | 82 | 55000 | 70000 | 99091 |
| Mesa, AZ | Under 350 sq ft | Pool surface area stated in permit text | 65 | 38796 | 44501 | 55000 |
| Mesa, AZ | 350 to 499 sq ft | Pool surface area stated in permit text | 105 | 36000 | 47000 | 60904 |
| Mesa, AZ | 500 sq ft or more | Pool surface area stated in permit text | 54 | 45150 | 57500 | 99750 |
Source: PC&S analysis of City of Las Vegas (GALLONS field) and City of Mesa (pool area in permit text). Download CSV
Mesa pools under 350 square feet had a 2025 median of $44,501; pools of 500 square feet or more had $57,500 (City of Mesa). The median Mesa permit that states a size covers 412 square feet and declares $121 per square foot.
Las Vegas pools under 10,000 gallons had a 2025 median of $64,990, and pools of 15,000 gallons or more had $70,000 (City of Las Vegas). The median Las Vegas pool holds 10,300 gallons.
Mesa’s $121 per square foot sits close to the $114 gunite rate in San Diego’s valuation schedule (IB-101) and at the low end of the $90 to $250 per square foot range Angi gives (Angi). HomeGuide gives $80 to $250 per square foot (HomeGuide).
2026 so far: January to August medians against the same months of 2025
Comparing January to August 2026 with January to August 2025, median declared values rose in 6 of 10 declared-value cities, were flat in one and fell in 3. The middle change was 5.1%, above CPI-U inflation of 3.3% over the same months.
| City | Permits with usable value, Jan to Aug 2025 | Median Jan to Aug 2025 $ | Permits with usable value, Jan to Aug 2026 | Median Jan to Aug 2026 $ | Change % | Value basis |
|---|---|---|---|---|---|---|
| Nashville-Davidson, TN | 159 | 100000 | 194 | 114994 | 15.0 | Declared on application |
| Montgomery County, MD | 76 | 100000 | 58 | 112620 | 12.6 | Declared on application |
| Las Vegas, NV | 385 | 68679 | 349 | 75890 | 10.5 | Declared on application |
| Cape Coral, FL | 803 | 59275 | 796 | 65000 | 9.7 | Declared on application |
| New Orleans, LA | 103 | 74674 | 120 | 80000 | 7.1 | Declared on application |
| Raleigh, NC | 62 | 148348 | 76 | 152994 | 3.1 | Declared on application |
| Fort Worth, TX | 285 | 65000 | 266 | 65000 | 0.0 | Declared on application |
| Orlando, FL | 179 | 70000 | 185 | 68000 | -2.9 | Declared on application |
| San Diego, CA | 142 | 51927 | 145 | 49590 | -4.5 | City valuation schedule (per sq ft) |
| Mesa, AZ | 226 | 48750 | 193 | 45800 | -6.1 | Declared on application |
| Los Angeles, CA | 706 | 40000 | 796 | 37000 | -7.5 | Declared on application |
Source: PC&S analysis of city building-permit open data; permits issued 1 January to 31 August of each year. Download CSV
Source: PC&S analysis of city building-permit open data (13 jurisdictions). Download chart data (CSV)
Nashville-Davidson rose from $100,000 to $114,994 (Metro Nashville). Las Vegas rose from $68,679 to $75,890 (City of Las Vegas). Los Angeles fell from $40,000 to $37,000 (LADBS), and Mesa from $48,750 to $45,800 (City of Mesa).
Permit values compared with published pool cost guides
National cost guides land close to the permit midpoint: the $68,000 middle city median is 3.2% above Angi’s 2026 average and 8.8% above HomeGuide’s. The guides miss the spread: 4 of 10 city medians fall outside Angi’s typical range.
Source: Angi (updated Aug 2026), HomeGuide (Jul 2025), Fixr (Jan 2024); PC&S analysis of city permit data. Download chart data (CSV)
- Angi, updated 5 August 2026: average $65,909, typical range $44,499 to $87,349 (Angi).
- HomeGuide, July 2025: national average $62,500, average range $25,000 to $100,000 (HomeGuide).
- Fixr, January 2024, all swimming pool types including above-ground: average $44,688, range $32,175 to $58,541 (Fixr).
- Permit data, 2025, 10 US cities: middle city median $68,000; pooled median $60,000; pooled mean $70,745.
Against Angi’s typical range, 1 city median falls below it (Los Angeles) and 3 sit above it (Raleigh, Nashville-Davidson and Montgomery County). The Los Angeles median of $35,000 is 40.7% below the low end of Angi’s California range of $59,000 to $140,000 (Angi), the clearest sign in this data of a declared value that understates the full job.
The pooled permit median of $60,000 is 9.0% below Angi’s average and 4.0% below HomeGuide’s, because the two largest permit markets in the set, Los Angeles and Cape Coral, both sit below the guides. The permit midpoint is 52.2% above Fixr’s $44,688 average, but the Fixr figure is dated January 2024 and includes above-ground pools.
Scenarios we modeled
Median declared value per city, latest full year
What does a new in-ground pool cost in each city according to its permits?
median of usable declared values (5,000 to 1,000,000 dollars) on new residential in-ground pool permits issued in 2025, per city; then the median of the 10 city mediansInputs: fact rows #670, #470, #443, #542, #227, #614, #155, #29, #371, #299; derived D1
Limitations: Declared values, not invoices; scope of the permit differs by city; 10 jurisdictions are not a national sample; San Diego excluded as schedule-based.
Real change in declared value, 2019 to 2025
Have pool values risen faster than inflation?
median 2025 / (median 2019 x CPI-U 2025 / CPI-U 2019) minus 1; repeated with the PPI for inputs to residential construction (goods)Inputs: fact rows #926, #932, #936, #942 and city medians for 2019 and 2025; derived D46, D47, D49
Limitations: Mix of pools changes over time; Mesa 2019 coverage was 65.9%; CPI-U 2025 average built from 11 months.
Pool and spa premium
How much more is declared for a pool with a spa?
median declared value of pool and spa permits / median of pool-only permits minus 1, per city, 2025; median across citiesInputs: fact rows #802, #807, #812, #817, #827, #832, #837, #842 and #804, #809, #814, #819, #829, #834, #839, #844; derived D70
Limitations: Text classification; spa projects also tend to be larger pools, so the premium is not the cost of the spa alone.
Gap between permit values and published cost guides
Are cost-guide averages above or below what permits show?
permit figure / guide average minus 1, for the middle city median and the pooled medianInputs: derived D1, D4; fact rows #953, #974, #985; derived D87, D91
Limitations: Guide methods are not published in detail; guides describe whole projects; Fixr includes above-ground pools.
Size of the fee incentive to under-declare
How much does a lower declared value save on permit fees?
Orlando base fee = 64.94 + 4.32 x (thousands of construction cost minus 1)Inputs: fact rows #950, #951, #614; derived D99, D101
Limitations: Base fee only; surcharges, plan review and trade permits excluded; one city.
What the comparison shows
- Across 10 US cities and counties, the middle 2025 city median for a new residential in-ground pool permit was $68,000 (PC&S analysis of city building-permit open data).
- Los Angeles had the lowest 2025 median declared value at $35,000 (LADBS), and Raleigh the highest at $150,000 (City of Raleigh), a 4.3-fold gap.
- Pooling all 4,391 usable 2025 permits from the 10 declared-value jurisdictions gives a median of $60,000 and a middle half of $40,000 to $82,950.
- After CPI-U inflation of 26.0% from 2019 to 2025 (BLS), the median city saw declared pool values rise 16.4% in real terms across 7 US cities.
- Measured against the 41.3% rise in prices of goods used in residential construction from 2019 to 2025 (BLS PPI), the same 7-city median real gain shrinks to 3.8%.
- Permits that include a spa carried a median declared value 26.6% higher than pool-only permits in 2025, across 8 US cities.
- From January to August 2026, median declared values were higher than in the same months of 2025 in 6 of 10 US cities, with a middle change of 5.1% against CPI-U inflation of 3.3% (BLS).
- Angi puts the 2026 national average in-ground pool at $65,909 (Angi); the 2025 permit midpoint of $68,000 is 3.2% above it.
Results
- Raleigh, North Carolina had the highest 2025 median declared value for a new residential in-ground pool, $150,000, on 101 permits (City of Raleigh).
- Nashville-Davidson, Tennessee recorded a 2025 median of $105,000 on 245 permits (Metro Nashville).
- Montgomery County, Maryland recorded a 2025 median of $100,000 on 111 permits (Montgomery County).
- Los Angeles had the lowest 2025 median, $35,000, on 1,069 permits, and 14.6% of those values were exactly $30,000 (LADBS).
- Sun Belt cities clustered in a narrow band in 2025: Las Vegas $70,000, Orlando $66,000, Fort Worth $65,000 and Cape Coral $60,000 (city permit data).
- In Fort Worth, 17.5% of usable 2025 values were exactly $65,000, and in 2019 25.7% were exactly $10,000 or $11,000 (City of Fort Worth).
- San Diego pool values are computed from a city schedule: 77.8% of 2025 values are exact multiples of $114, the gunite pool rate per square foot in Information Bulletin 101.
- San Diego median values jumped 82.4% from 2021 to 2022, the year 75.1% of values became exact multiples of $193 (City of San Diego).
- Las Vegas median declared value fell from $72,162 in 2023 to $70,000 in 2025 (City of Las Vegas).
- Mesa, Arizona permits stating a pool area had a 2025 median of $121 per square foot of pool surface, on a median 412 square-foot pool (City of Mesa).
- Orlando charges $43.20 in base building permit fees for each extra $10,000 of declared construction cost (City of Orlando fee schedule).
- Austin stopped recording job values on most pool permits: 4.1% of 2025 pool permits carried a usable value, against 88.8% in 2019 (City of Austin).
- San Antonio publishes no declared valuation on any pool permit issued from December 2020 to September 2026 (City of San Antonio).
Questions owners ask
How much does it cost to build a pool in 2026?
From January to August 2026, median declared values for new in-ground pool permits ranged from $37,000 in Los Angeles to $152,994 in Raleigh, with Las Vegas at $75,890 and Cape Coral at $65,000 (PC&S analysis of city building-permit open data). Angi’s 2026 national average is $65,909 (Angi).
Why are pools so expensive?
Materials prices rose sharply: the BLS producer price index for goods used in residential construction climbed 41.3% from 2019 to 2025 (BLS), and Angi puts labor at 25% to 50% of a pool installation (Angi). San Diego values a gunite pool at $114 per square foot of surface (City of San Diego), and a median 2025 Mesa permit declared $121 per square foot (City of Mesa).
How much is a pool in Texas?
Fort Worth pool permits declared a 2025 median of $65,000, with a middle half of $50,000 to $87,000 (City of Fort Worth). Austin stopped recording most values after 2020; its last reliable median was $50,000 in 2019 (City of Austin). Angi gives $51,900 to $100,700 for Texas (Angi).
How much does a pool cost in California?
Los Angeles pool permits declared a 2025 median of $35,000 (LADBS), and San Diego schedule-based values had a median of $50,502 (City of San Diego). Angi gives $59,000 to $140,000 for California (Angi), so the Los Angeles median is 40.7% below Angi’s low end.
What is the cheapest type of inground pool?
Vinyl-liner pools are the cheapest in two of three guides: HomeGuide gives $35,000 to $80,000 for vinyl against $45,000 to $100,000 for fiberglass and $50,000 to $120,000 for concrete (HomeGuide); Angi gives $40,000 to $75,000 for vinyl (Angi). San Diego’s valuation schedule ranks vinyl lowest per square foot ($104, against $114 for gunite and $124 for fiberglass) (IB-101). Fixr lists the lowest starting figure for fiberglass, $18,646 (Fixr).
Prices and rules used
- January to August 2026 permit values added: the middle change across 10 US cities was 5.1% against the same months of 2025.
- Austin permit records re-pulled on 2026-10-07: only 4.1% of 2025 pool permits carry a usable job value, so Austin is reported for 2019 and 2020 only.
- Angi updated its in-ground pool cost guide on 5 August 2026, with a $65,909 national average (Angi).
- Latest CPI-U month used: August 2026; CPI-U for October 2025 was not published (BLS).
More questions
What is the average cost to build a pool according to building permits?
Across 10 US cities and counties, the middle 2025 city median declared value for a new residential in-ground pool was $68,000; pooling 4,391 permits gives a median of $60,000 and a mean of $70,745 (PC&S analysis of city building-permit open data).
Which US city has the most expensive pools in this data?
Raleigh, North Carolina, with a 2025 median declared value of $150,000 on 101 permits (City of Raleigh).
Which city has the cheapest declared pool values?
Los Angeles, with a 2025 median of $35,000 on 1,069 permits (LADBS), well below cost-guide figures for California.
Do permit values understate what a pool costs?
They can, for the whole project. 97.0% of 2025 Mesa pool permits say they exclude accessory structures (City of Mesa), and the Los Angeles 2025 median is 40.7% below the low end of Angi’s California range (Angi).
How much does adding a spa add to a pool?
In 2025, pool and spa permits had a median declared value 26.6% ($22,584) above pool-only permits across 8 US cities. San Diego’s valuation schedule values a spa at $22,291 (IB-101).
Have pool prices risen faster than inflation since 2019?
How much is a pool permit fee?
In Orlando the base residential building permit fee at the 2025 median declared value of $66,000 is $345.74 before surcharges (City of Orlando). Angi gives $450 to $1,800 for pool permits (Angi).
Does pool size change the cost?
In Mesa, 2025 pools of 500 square feet or more had a median declared value of $57,500, against $44,501 for pools under 350 square feet (City of Mesa).
What does an inground pool cost per square foot?
Mesa permits declared a median $121 per square foot of pool surface in 2025 (City of Mesa); HomeGuide gives $80 to $250 (HomeGuide) and Angi $90 to $250 (Angi).
Are pool costs going up in 2026?
In 6 of 10 US cities, January to August 2026 medians were higher than in the same months of 2025; the middle change was 5.1%, against CPI-U inflation of 3.3% (BLS).
Inputs, formulas and caveats
- Started from the permit universe of our pool construction statistics report: the same 14 city and county datasets, record filters, text classifier and 365-day same-address dedupe, reused unchanged (scripts/sibling_build_dataset.py).
- Attached each city’s published value field (valuation, job value, construction cost, estimated cost or declared valuation) to every counted permit; Austin was re-pulled on 2026-10-07 because the earlier extract had no value columns.
- Removed permits whose text refers to an expired, renewed or reissued permit, because their value covers only the remaining work.
- Kept values from $5,000 to $1,000,000; a city-year is reported only with at least 30 usable values and at least 60% of counted permits carrying one (60% to 80% flagged).
- Computed the 25th percentile, median, 75th percentile and mean per city and year (linear interpolation); 2026 is compared only for January to August against January to August 2025.
- Classified pool only vs pool and spa from description text, after removing code names, state-law boilerplate and bare “pool/spa” labels.
- Deflated with CPI-U (U.S. city average, all items, CUUR0000SA0) and, as a sensitivity, the PPI for inputs to residential construction, goods (WPUIP2311001).
- Opened the top Google results for “average cost to build a pool” and “inground pool cost 2026” and three cost guides (Angi, HomeGuide, Fixr) and took headline figures only.
Included: New residential in-ground pool permits (one- and two-family) issued 2019 to August 2026 in jurisdictions whose open data publish a permit value: Los Angeles, San Diego, Orlando, Mesa, Las Vegas, Fort Worth, New Orleans, Raleigh, Montgomery County MD, Nashville-Davidson, Cape Coral, Austin (2019 to 2020) and East Baton Rouge Parish (2019 to 2024).
Excluded: San Antonio (no value published on any pool permit); Austin from 2021 (value coverage 30.2% in 2021 and 4.1% in 2025); Raleigh before 2021 (17.8% coverage in 2019); East Baton Rouge Parish 2025 to 2026 (structural break in the file); values under $5,000 or over $1,000,000 (51 permits over the cap); reissued permits; above-ground, remodel, repair and spa-only permits (sibling classifier).
Conflicting numbers: Where cost guides disagree (for example on the cheapest pool type), each figure is shown with its publisher and date. San Diego schedule values are shown but kept out of cross-city figures. Where a single figure dominates a city-year (Fort Worth, Montgomery County 2019) the result is reported with a sensitivity that excludes it.
Derived metrics: All derived figures are in derived.csv with formulas and input rows, computed by scripts/analyze.py and scripts/make_facts.py from the raw extracts in raw/. CPI-U annual averages are the mean of the two semiannual averages (October 2025 was not published); PPI annual averages are the mean of 12 months.
Caveats
- Declared values are not invoices and may exclude decking, fencing, screen enclosures and separately permitted electrical, gas and plumbing work.
- Value definitions differ by city (applicant declaration, estimate of work, contract-based, or city schedule).
- Repeated default values (Fort Worth, Los Angeles, Montgomery County 2019) make medians sticky and can create step changes.
- Eleven jurisdictions are not a national sample; Sun Belt cities dominate.
- Medians describe the typical permitted pool, not a constant-quality price; changes in pool size and features move them.
- Fort Worth permits are dated by filing date because no issue date is published.
Method last reviewed October 7, 2026.
Press and citation
Quotable results
- The middle 2025 city median declared value for a new residential in-ground pool across 10 US cities and counties was $68,000. (City of Raleigh)
- Raleigh, North Carolina had the highest 2025 median declared pool value in the comparison, $150,000, and Los Angeles the lowest, $35,000. (City of Raleigh)
- After CPI-U inflation, median declared pool values rose 16.4% from 2019 to 2025 in the median of 7 US cities. (U.S. Bureau of Labor Statistics)
- In 2025, pool and spa permits carried a median declared value 26.6% above pool-only permits across 8 US cities. (LA Department of Building and Safety)
- The 2025 Los Angeles median declared pool value of $35,000 is 40.7% below the low end of Angi’s California cost range. (LA Department of Building and Safety)
- From January to August 2026, median declared pool values were higher than a year earlier in 6 of 10 US cities. (Metropolitan Government of Nashville and Davidson County)
- In Orlando, each extra $10,000 of declared construction cost adds $43.20 to the base building permit fee. (City of Orlando)
Primary inputs
- Building Permits Issued from 2020 to Present (pi9x-tg5x) and 2010 to 2019 (dyxf-7hc4), LA Department of Building and Safety
- Building Permits, City of Raleigh
- CPI for All Urban Consumers, all items, U.S. city average (CUUR0000SA0), U.S. Bureau of Labor Statistics
- Information Bulletin 101: Building Valuation Schedule, City of San Diego Development Services
- How Much Does an In-Ground Pool Cost? [2026 Data], Angi
Media summary
A new analysis of building-permit open data by Pool Construction & Service compares the construction values declared on new residential in-ground pool permits in 11 US cities and counties. In 2025 the middle city median was $68,000, ranging from $35,000 in Los Angeles to $150,000 in Raleigh, North Carolina. After CPI-U inflation, the typical city saw declared values rise 16.4% between 2019 and 2025, and only 3.8% when measured against prices of residential construction materials. Permits that include a spa carried a median 26.6% premium. National cost guides from Angi and HomeGuide sit close to the permit midpoint but miss a four-fold spread between cities. The report warns that permit values are not invoices: they can exclude decking, fencing and separate trade work, and San Diego computes its values from a city schedule. From January to August 2026, medians were up in 6 of 10 cities.
Possible headlines
- Building a pool: permit values put the typical city at $68,000 in 2025
- Raleigh pools declared at $150,000, more than four times Los Angeles, city permit data show
- After inflation, declared pool values rose 16.4% since 2019 in the median US city studied
- Adding a spa lifts declared pool values by a median 26.6%, permits in 8 cities show
- Los Angeles pool permits declare $35,000, far below cost-guide estimates for California
Citation
Pool Construction & Service. "Average cost to build a pool: what 2025 building permits show in 11 US cities and counties." PC&S Research Desk, October 7, 2026. https://poolconstructionandservice.com/research/average-cost-to-build-a-pool/
License
The data tables and charts in this report are licensed under CC BY 4.0. Reuse them with this attribution: “Source: Pool Construction & Service (poolconstructionandservice.com), Average cost to build a pool: what 2025 building permits show in 11 US cities and counties.” Figures from third-party sources remain subject to their publishers’ terms.
Comparison tables
- Declared pool permit value by city, 2025 (11 US cities and counties) CSV
- Median declared pool permit value by city and year, 2019 to 2025 CSV
- Nominal and real change in median declared pool value, 2019 to 2025 CSV
- Pool only vs pool and spa median declared value, 2025 CSV
- Declared pool value by pool size, Las Vegas and Mesa, 2025 CSV
- Median declared pool value, January to August 2026 vs 2025 CSV
- Cost-guide averages vs 2025 permit values CSV
- Full fact sheet with sources and limitations CSV
Evidence tiers
Tier 1: primary and government sources (19)
- City of Austin: Issued Construction Permits (3syk-w9eu)
- LA Department of Building and Safety: Building Permits Issued from 2020 to Present (pi9x-tg5x) and 2010 to 2019 (dyxf-7hc4)
- City of San Diego Development Services: Development Permits: approvals issued
- City of Orlando: Permit Applications (ryhf-m453)
- City of Mesa: Building Permits (dzpk-hxfb)
- City of Las Vegas: Building Permits (OpenData_Building_Permits_)
- City of Fort Worth: CFW Open Data Development Permits
- City of New Orleans: Permits (rcm3-fn58)
- City of Baton Rouge / Parish of East Baton Rouge: EBR Building Permits (7fq7-8j7r)
- City of Raleigh: Building Permits
- Montgomery County Government, Maryland: Residential Permit (m88u-pqki)
- Metropolitan Government of Nashville and Davidson County: Building Permits Issued
- City of Cape Coral: Building Permits (OpenData MapServer layer 1)
- City of San Antonio: Building Permits: Permits Issued
- U.S. Bureau of Labor Statistics: CPI for All Urban Consumers, all items, U.S. city average (CUUR0000SA0)
- U.S. Bureau of Labor Statistics: PPI Commodity data, Inputs to residential construction, goods (WPUIP2311001)
- City of San Diego Development Services: Information Bulletin 101: Building Valuation Schedule
- City of San Diego Development Services: Information Bulletin 501: Fee Schedule for Construction Permits, Structures
- City of Orlando: Fees: Residential Development (1 or 2 units), effective January 2023
Tier 3: journalism and expert commentary (3)
References
- City of Austin. Issued Construction Permits (3syk-w9eu). Accessed 2026-10-07.
- LA Department of Building and Safety. Building Permits Issued from 2020 to Present (pi9x-tg5x) and 2010 to 2019 (dyxf-7hc4). Accessed 2026-10-07.
- City of San Diego Development Services. Development Permits: approvals issued. Accessed 2026-10-07.
- City of Orlando. Permit Applications (ryhf-m453). Accessed 2026-10-07.
- City of Mesa. Building Permits (dzpk-hxfb). Accessed 2026-10-07.
- City of Las Vegas. Building Permits (OpenData_Building_Permits_). Accessed 2026-10-07.
- City of Fort Worth. CFW Open Data Development Permits. Accessed 2026-10-07.
- City of New Orleans. Permits (rcm3-fn58). Accessed 2026-10-07.
- City of Baton Rouge / Parish of East Baton Rouge. EBR Building Permits (7fq7-8j7r). Accessed 2026-10-07.
- City of Raleigh. Building Permits. Accessed 2026-10-07.
- Montgomery County Government, Maryland. Residential Permit (m88u-pqki). Accessed 2026-10-07.
- Metropolitan Government of Nashville and Davidson County. Building Permits Issued. Accessed 2026-10-07.
- City of Cape Coral. Building Permits (OpenData MapServer layer 1). Accessed 2026-10-03.
- City of San Antonio. Building Permits: Permits Issued. Accessed 2026-10-07.
- U.S. Bureau of Labor Statistics. CPI for All Urban Consumers, all items, U.S. city average (CUUR0000SA0). Accessed 2026-10-07.
- U.S. Bureau of Labor Statistics. PPI Commodity data, Inputs to residential construction, goods (WPUIP2311001). Accessed 2026-10-07.
- City of San Diego Development Services. Information Bulletin 101: Building Valuation Schedule. Accessed 2026-10-07.
- City of San Diego Development Services. Information Bulletin 501: Fee Schedule for Construction Permits, Structures. Accessed 2026-10-07.
- City of Orlando. Fees: Residential Development (1 or 2 units), effective January 2023. Accessed 2026-10-07.
- Angi. How Much Does an In-Ground Pool Cost? [2026 Data]. Accessed 2026-10-07.
- HomeGuide. How Much Does An Inground Pool Cost? (2026). Accessed 2026-10-07.
- Fixr. How Much Does It Cost to Build a Swimming Pool?. Accessed 2026-10-07.
Related pool research
Cost to Run a Pool Pump by State: July 2026 Electricity Prices, Single-Speed vs Variable-Speed
Cost to Heat a Pool: Gas Heater vs Heat Pump by State, 2026
Pool Chemical Prices: A Producer Price Index for Chlorine, Trichlor Inputs and Acid, 2019 to 2026
Pool Property Tax: How 18 Major Pool-Market Counties Assess a New Pool, 2026 Ledger
Does a Pool Add Value to a Home? US Pool Premium Estimates Reconciled
Pool permit cost: a 2026 ledger of official fees in 18 US cities and counties
All pool industry research (40 reports)