Swimming Pool Ownership by Income: Satellite Pool Counts Joined to Census Income in 22 US Metros
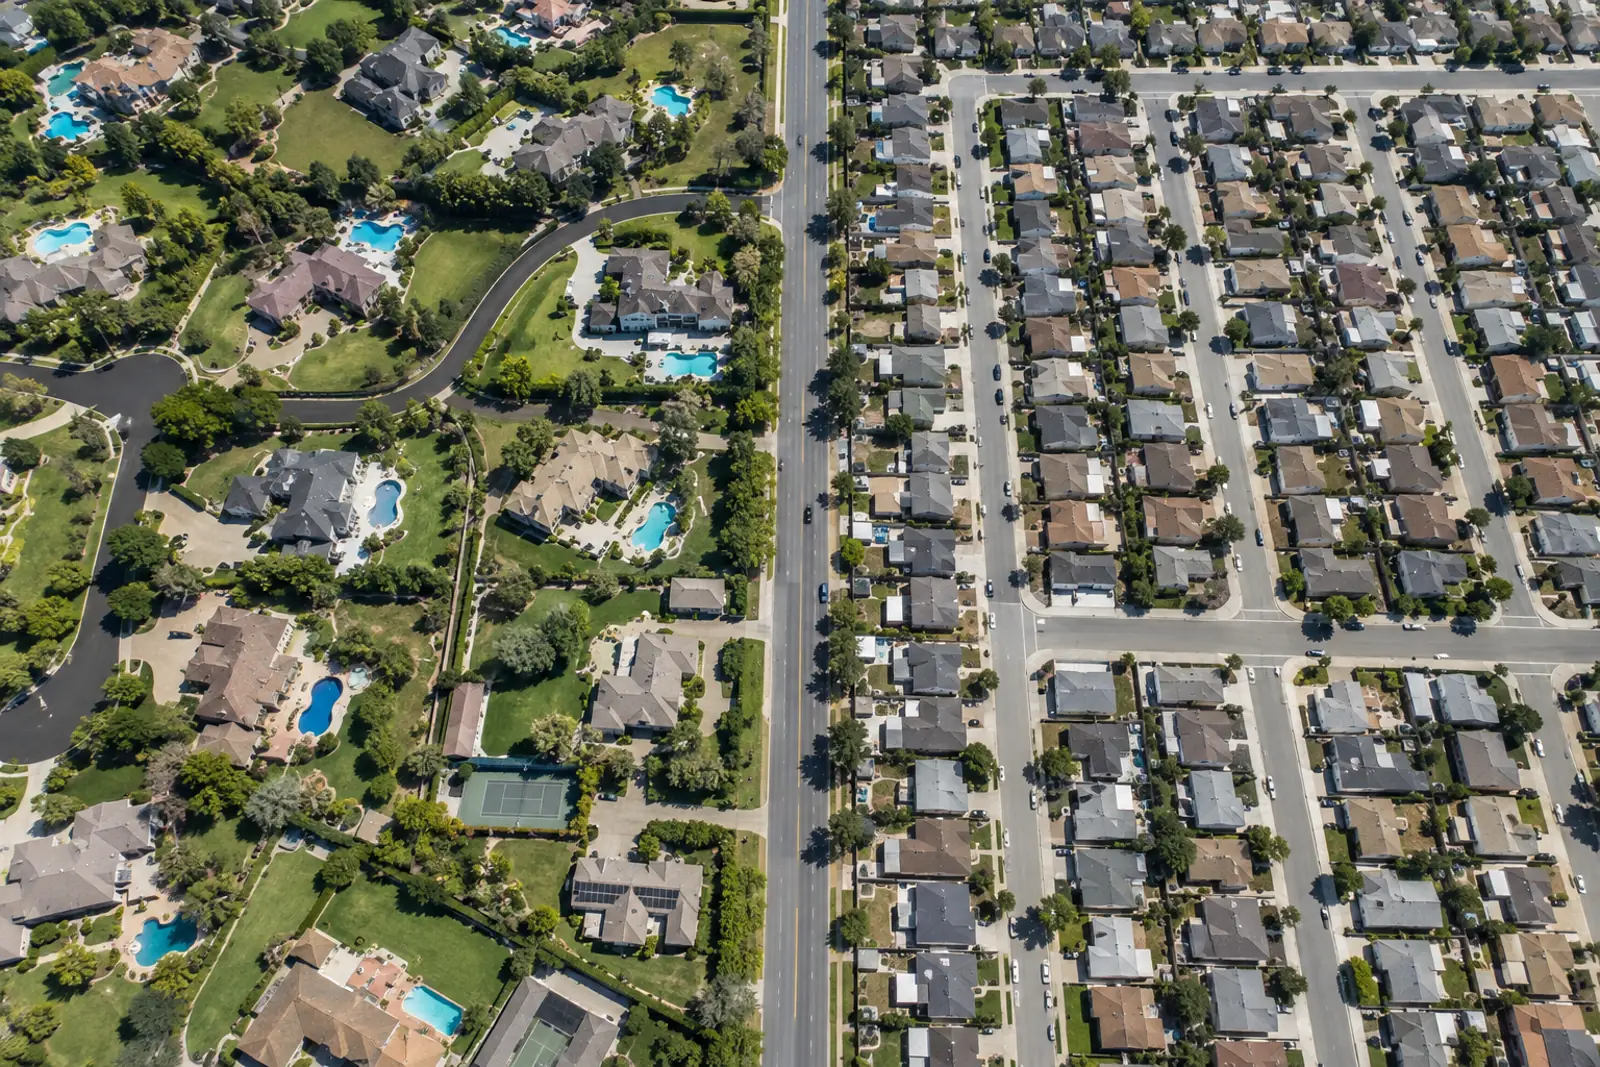
Swimming pool ownership by income rises steeply. In 22 US metros imaged in 2022 to 2023, the highest-income fifth of neighborhoods had 172 backyard pools per 1,000 housing units, the lowest-income fifth 20, a ratio of 8.4. Housing density explains under a quarter of that gap. In 2024, 20.6% of US houses earning $200,000 or more had a pool.
How we built the dataset
- Pool counts: the PC&S satellite census sampled 2,400 cell draws of 500 m (96 per metro in two waves of 48, each draw a random 2020 housing unit) in 25 metros and counted backyard pools in USDA NAIP imagery from 2022 to 2023 (USGS NAIP). It was reused read-only.
- Metros: the 22 metros with detector precision of 50% or more; Atlanta, Washington DC and Seattle are excluded. Per-metro ratios and the stratified analysis also drop Denver (43 detections), leaving 21.
- Tract join: each cell’s housing units were rebuilt from 2020 Census blocks (HU100) and assigned to tracts through the tract part of each block GEOID; the rebuilt totals match the source exactly. 2,995 tracts are involved.
- Tract data: ACS 2020-2024 5-year tables B19013 (median household income), B25077 (median home value), B25035 (median year built) and B25024 (units in structure), from the Census summary files; cell values are housing-unit-weighted means of tract values.
- Quintiles: draws are ranked within each metro by a cell trait and cut into five equal groups; because draws are equal-probability housing units, each quintile holds about 20% of the metro’s housing units.
- Rates: domain Hansen-Hurwitz estimator, calibrated with the source census precision by metro and recall by imagery region (72% pooled), then a housing-unit-weighted composite of metros.
- Intervals: 5,000 bootstrap replicates resampling draws within metros, re-cutting quintiles each time, with precision and recall drawn from their posteriors.
- Controls: within-metro density terciles (stratified index) and quasi-Poisson regressions with metro fixed effects (500 bootstrap replicates).
- Surveys: PC&S tabulations of EIA RECS 2024 microdata (SWIMPOOL by MONEYPY, houses only) and the Census/HUD AHS 2015 national PUF (POOLSAFE by HINCP quintile, split-sample weight SP2WEIGHT), with the agencies’ replicate-weight variance formulas.
Included: Federal microdata and summary files, the PC&S satellite census, peer-reviewed literature opened in full, and one dated journalism project used only for context.
Excluded: Pool ownership-by-income figures on compilation pages that name no dataset, sample or year were not used. No NAHB or PHTA publication with pool ownership by income was found (see excluded.md). Race and ethnicity variables were not used.
Conflicting numbers: The three measures differ in unit and definition: the satellite rate is pools per housing unit by neighborhood; RECS counts houses with their own pool by household income bracket; AHS counts a pool anywhere on the grounds, including shared pools, by household income quintile. They are shown side by side and not combined. The satellite ratio per detached home (2.7) and the AHS ratio for houses (2.1) are the closest like-for-like pair.
Derived metrics: All derived numbers come from the numbered scripts in scripts/ (run in order, fixed seeds); derived.csv lists each formula and its inputs.
Caveats
- Neighborhood income is a tract median, not the income of the household with the pool (ecological caveat).
- Detector precision and recall are assumed equal across income quintiles within a metro.
- Housing density is a coarse proxy for lot size.
- About 19 sampled cells per metro quintile, so per-metro figures are imprecise.
- Imagery from 2022 to 2023 and incomes from 2020 to 2024 do not align exactly.
- Only 22 metros, chosen for pool relevance, are covered; results are not national.
- AHS 2015 is old, and the RECS 2024 microdata are preliminary.
Method last reviewed October 18, 2026.
The short version
- Neighborhoods in the top income fifth of their own metro had 172 recall-adjusted backyard pools per 1,000 housing units (95% CI 140 to 206) in 2022 to 2023 imagery, against 20 (95% CI 16 to 28) in the bottom fifth, across 22 US metros (PC&S analysis of the PC&S satellite census and Census ACS 2020-2024).
- The 22-metro top-to-bottom income ratio is 8.4 (95% CI 6.0 to 11.0), and the top fifth has more pools than the bottom fifth in all 21 of the 21 US metros with enough detections to compare (PC&S analysis of the PC&S satellite census and Census ACS 2020-2024).
- Home value draws a flatter line: 142 pools per 1,000 housing units in the top home-value fifth vs 31 in the bottom fifth, a ratio of 4.5, in 22 US metros in 2022 to 2023 (PC&S analysis of the PC&S satellite census and ACS 2020-2024 home values).
- Holding housing density constant lowers the income ratio from 6.8 to 4.9 in 21 US metros, so density, a proxy for lot size, explains 17% of the income gap on a log scale in 2022 to 2023 (PC&S analysis of the PC&S satellite census and Census ACS 2020-2024).
- Counting single-family detached homes only, the top income fifth has 230 pools per 1,000 detached homes vs 87 in the bottom fifth, a ratio of 2.7, in 21 US metros in 2022 to 2023 (PC&S analysis of the PC&S satellite census and Census ACS 2020-2024).
- Between metros the pattern reverses: metro median household income and pools per 1,000 housing units have a Spearman rank correlation of -0.54 across 22 US metros (PC&S analysis of the PC&S satellite census and Census ACS 2020-2024 metro estimates).
- Nationally, 20.6% of US houses in households earning $200,000 or more had their own pool in 2024, against 2.3% of houses under $25,000 (EIA RECS 2024 microdata, PC&S tabulation).
What the permit data shows
- Recall-adjusted pools per 1,000 housing units rise with each within-metro income quintile, from 20 to 49, 83, 102 and 172, across 22 US metros in 2022 to 2023 imagery (PC&S analysis of the PC&S satellite census and Census ACS 2020-2024).
- The bottom income quintile has a typical neighborhood median household income of $50,754 and the top quintile $141,191, as medians of 22 US metro quintiles in Census ACS 2020-2024.
- In Phoenix, the top income quintile has 555 pools per 1,000 housing units and the bottom quintile 39, a ratio of 14.3 (95% CI 6.3 to 33.6), in 2023 imagery (PC&S analysis of the PC&S satellite census and Census ACS 2020-2024).
- Tucson has the steepest income gradient of 21 US metros, a top-to-bottom ratio of 49.5 (95% CI 18.9 to 76.7), in 2023 imagery (PC&S analysis of the PC&S satellite census and Census ACS 2020-2024).
- Chicago has the flattest income gradient of 21 US metros, a ratio of 3.2 (95% CI 0.9 to 8.4, an interval that includes 1, meaning no difference), in 2022 and 2023 imagery (PC&S analysis of the PC&S satellite census and Census ACS 2020-2024).
- North Port-Sarasota, FL has 101 pools per 1,000 housing units even in its bottom income quintile, the highest bottom-quintile rate of 21 US metros, in January 2023 imagery (PC&S analysis of the PC&S satellite census and Census ACS 2020-2024).
- The median metro-level income ratio is 7.8 across 21 US metros, and the 95% interval sits above 1 in 20 of them, in 2022 to 2023 imagery (PC&S analysis of the PC&S satellite census and Census ACS 2020-2024).
- By home value, the median metro-level ratio is 6.4 across 21 US metros, against 7.8 for income, in 2022 to 2023 (PC&S analysis of the PC&S satellite census and ACS 2020-2024 home values).
- Pools peak in neighborhoods with a median build year of 1997, at 112 per 1,000 housing units, against 51 in the oldest fifth (median 1965) and 93 in the newest fifth (median 2006), 22 US metros (PC&S analysis of the PC&S satellite census and ACS 2020-2024 year built).
- The least dense fifth of neighborhoods has 205 pools per 1,000 housing units and the densest fifth 15, across 22 US metros in 2022 to 2023 (PC&S analysis of the PC&S satellite census and Census ACS 2020-2024).
- Inside density thirds, the income ratio is 6.5 in the lowest-density third, 3.5 in the middle third and 3.0 in the densest third, across 21 US metros in 2022 to 2023 (PC&S analysis of the PC&S satellite census and Census ACS 2020-2024).
- In a quasi-Poisson model with metro fixed effects, the top-to-bottom income rate ratio falls from 6.8 to 4.3 with density and stays at 4.3 after adding detached-house share and year built, 21 US metros (PC&S analysis of the PC&S satellite census and Census ACS 2020-2024).
- Households earning $150,000 or more held 38.7% of US houses with a pool in 2024 while making up 22.2% of all houses (EIA RECS 2024 microdata, PC&S tabulation).
- In 2015, 16.7% of US houses in the top household income quintile had a pool on the grounds, against 8.1% in the bottom quintile, a ratio of 2.1 (Census/HUD AHS 2015 PUF, PC&S tabulation).
- The two independent sample waves give income ratios of 8.7 and 7.0 for the 22-metro composite, 2022 to 2023 imagery (PC&S analysis of the PC&S satellite census and Census ACS 2020-2024).
Swimming pool ownership by income: pools per 1,000 homes by neighborhood income quintile
Inside the same metro, backyard pools rise at every step up the neighborhood income ladder. The top income fifth has about 8.4 times the pools per housing unit of the bottom fifth. The steepest jump is between the fourth and fifth quintiles.
Neighborhoods in the bottom income fifth of their metro had 20 recall-adjusted backyard pools per 1,000 housing units (95% CI 16 to 28) in 2022 to 2023 imagery across 22 US metros (PC&S analysis of the PC&S satellite census and Census ACS 2020-2024).
The second, third and fourth income quintiles had 49, 83 and 102 pools per 1,000 housing units. The top income fifth had 172 (95% CI 140 to 206) (PC&S analysis of the PC&S satellite census and Census ACS 2020-2024).
The gap between the top and bottom fifths is 151 pools per 1,000 housing units, a ratio of 8.4 (95% CI 6.0 to 11.0), 22 US metros, 2022 to 2023. Ratios are computed from unrounded rates (PC&S analysis of the PC&S satellite census and Census ACS 2020-2024).
The typical neighborhood in the bottom income quintile has a median household income of $50,754; in the top quintile it is $141,191 (Census ACS 2020-2024, medians of 22 metro quintiles). For scale, the US median household income was $87,460 in 2025 (Census, Income in the United States: 2025).
| Within-metro income quintile | Median household income of quintile ($, ACS 2020-2024) | Pools per 1,000 housing units | 95% CI low | 95% CI high | Pools per 1,000 detached homes (21 metros) | Detached share of housing units (%) |
|---|---|---|---|---|---|---|
| Q1 (lowest) | 50754 | 20 | 16 | 28 | 87 | 30 |
| Q2 | 70025 | 49 | 37 | 66 | 130 | 41 |
| Q3 | 84906 | 83 | 66 | 108 | 154 | 56 |
| Q4 | 105318 | 102 | 85 | 125 | 169 | 63 |
| Q5 (highest) | 141191 | 172 | 140 | 206 | 230 | 71 |
Source: PC&S analysis of the PC&S satellite census (USDA NAIP via Planetary Computer) and Census ACS 2020-2024 tables B19013 and B25024. Detached-home rates use 21 metros (Denver excluded). Download CSV
Housing-unit-weighted composite of 22 metros; 95% intervals in the table.
Source: PC&S satellite pool census (USDA NAIP 2022 to 2023) joined to ACS 2020-2024 5-year tract estimates. Download chart data (CSV)
The income gap in backyard pools inside each of 21 US metros
The income gradient is not driven by one or two places. In all 21 metros with enough detections, the top income fifth has more pools than the bottom fifth. The size of the gap varies a lot, and the intervals are wide because each quintile holds about 19 sampled cells.
The median top-to-bottom income ratio across 21 US metros is 7.8, and the 95% interval lies above 1 in 20 of the 21 metros, in 2022 to 2023 imagery (PC&S analysis of the PC&S satellite census and Census ACS 2020-2024).
Tucson has the steepest gradient: 493 pools per 1,000 housing units in the top income quintile against 10 in the bottom, a ratio of 49.5 (95% CI 18.9 to 76.7), 2023 imagery (PC&S analysis of the PC&S satellite census and Census ACS 2020-2024).
Phoenix has the most pools in its top income quintile, 555 per 1,000 housing units, against 39 in its bottom quintile, 2023 imagery (PC&S analysis of the PC&S satellite census and Census ACS 2020-2024).
Chicago has the flattest gradient, a ratio of 3.2 (95% CI 0.9 to 8.4), and Chicago’s detector precision (65%) is the lowest of the 21 metros, so the Chicago result is the least certain (PC&S analysis of the PC&S satellite census and Census ACS 2020-2024).
North Port-Sarasota, FL is the clearest case of pools reaching lower-income neighborhoods: its bottom income quintile has 101 pools per 1,000 housing units, more than the top quintile of Chicago (36) or New York (89) (PC&S analysis of the PC&S satellite census and Census ACS 2020-2024).
| Metro | NAIP imagery year | Median income, bottom quintile ($) | Median income, top quintile ($) | Pools per 1,000 HU, bottom quintile | Pools per 1,000 HU, top quintile | Top / bottom ratio | Ratio 95% CI low | Ratio 95% CI high |
|---|---|---|---|---|---|---|---|---|
| Tucson | 2023 | 36675 | 131083 | 10 | 493 | 49.5 | 18.9 | 76.7 |
| Philadelphia | 2022 and 2023 | 55984 | 172275 | 4 | 84 | 18.7 | 6.7 | 42.0 |
| Las Vegas | 2022 and 2023 | 41714 | 125142 | 18 | 300 | 16.2 | 4.7 | 41.4 |
| Phoenix | 2023 | 54942 | 137989 | 39 | 555 | 14.3 | 6.3 | 33.6 |
| Miami | 2022 and 2023 | 42533 | 144393 | 28 | 343 | 12.1 | 5.0 | 28.4 |
| San Diego | 2022 | 65034 | 157243 | 16 | 171 | 11.0 | 5.9 | 23.6 |
| Dallas-Fort Worth | 2022 | 50551 | 152760 | 17 | 174 | 10.5 | 4.2 | 31.5 |
| Houston | 2022 | 41806 | 145500 | 12 | 121 | 9.8 | 5.1 | 19.2 |
| Jacksonville | 2023 | 50958 | 122614 | 25 | 211 | 8.5 | 4.0 | 21.7 |
| Los Angeles | 2022 | 56768 | 155469 | 20 | 166 | 8.4 | 2.7 | 20.0 |
| Fresno | 2022 | 45396 | 122907 | 34 | 263 | 7.8 | 3.2 | 15.7 |
| New York | 2022 and 2023 | 57818 | 187368 | 12 | 89 | 7.4 | 2.2 | 150.0 |
| Cape Coral-Fort Myers | 2023 | 54773 | 120375 | 60 | 395 | 6.6 | 1.5 | 19.1 |
| Orlando | 2023 | 48512 | 118277 | 39 | 225 | 5.8 | 1.7 | 14.1 |
| Tampa | 2023 | 49234 | 116915 | 22 | 123 | 5.6 | 1.1 | 12.9 |
| San Antonio | 2022 | 42335 | 133795 | 11 | 62 | 5.4 | 2.1 | 13.0 |
| Riverside-San Bernardino | 2022 | 46101 | 137699 | 61 | 306 | 5.0 | 2.5 | 10.8 |
| Austin | 2022 | 61962 | 180729 | 15 | 71 | 4.6 | 1.9 | 20.9 |
| Sacramento | 2022 | 56735 | 145893 | 50 | 225 | 4.5 | 2.6 | 7.0 |
| North Port-Sarasota | 2023 | 59077 | 121733 | 101 | 363 | 3.6 | 1.9 | 7.5 |
| Chicago | 2022 and 2023 | 44220 | 160721 | 11 | 36 | 3.2 | 0.9 | 8.4 |
Source: PC&S analysis of the PC&S satellite census and Census ACS 2020-2024 table B19013. Bootstrap 95% intervals (5,000 replicates). Denver excluded (43 raw detections). Download CSV
Denver excluded (43 raw detections). Intervals are wide because each quintile holds about 19 cells.
Source: PC&S satellite pool census (USDA NAIP 2022 to 2023) joined to ACS 2020-2024 5-year tract estimates. Download chart data (CSV)
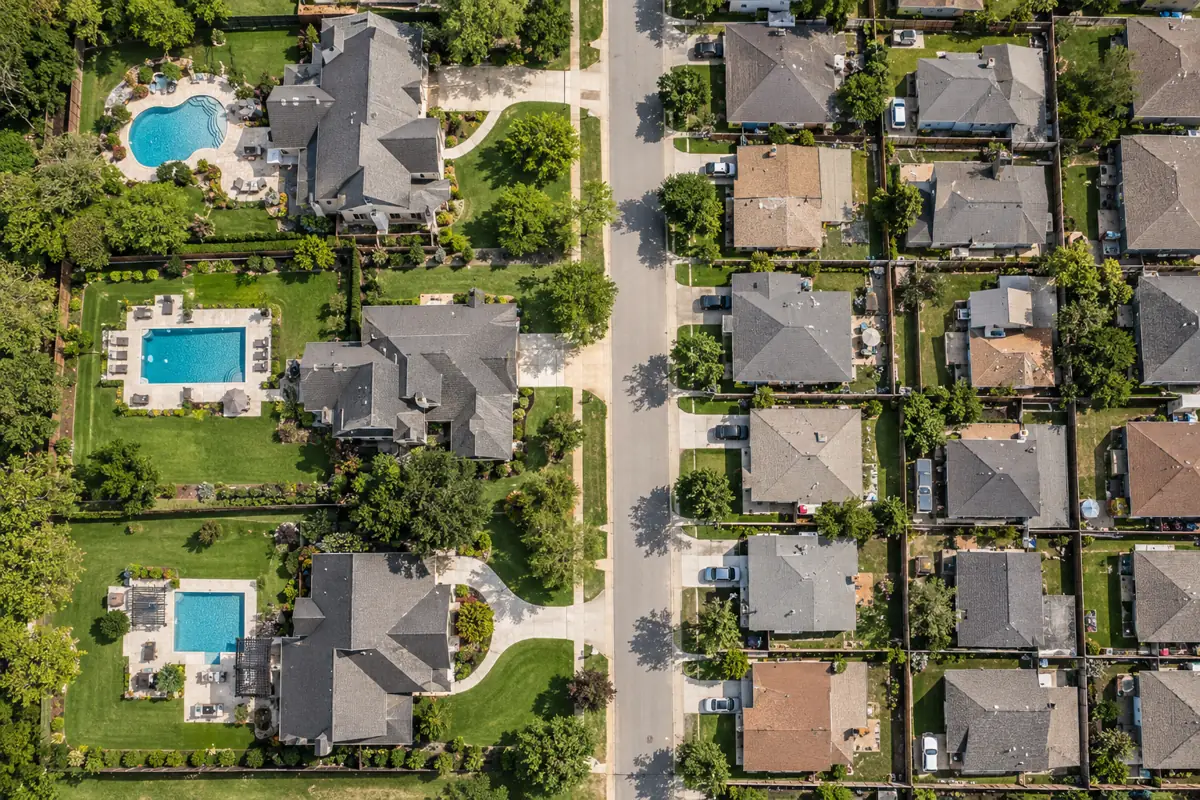
Home value, housing age and detached-house share as pool predictors
Home value predicts pools less sharply than income does. Housing age has a hump shape, with the most pools in neighborhoods built in the 1990s. The share of single-family detached homes tracks pools almost as closely as income.
The top home-value fifth of neighborhoods has 142 pools per 1,000 housing units (95% CI 116 to 170) and the bottom fifth 31 (95% CI 21 to 43), a ratio of 4.5 (95% CI 3.2 to 6.7), in 22 US metros in 2022 to 2023 (PC&S analysis of the PC&S satellite census and ACS 2020-2024 home values).
The median home value is $205,750 in the bottom value quintile and $627,043 in the top quintile (ACS 2020-2024 home values, medians of 22 metro quintiles). One possible reason for the flatter line: home value includes land prices, which are high in dense central areas where lots are small. How a pool itself affects sale prices is covered in pool home value.
Neighborhoods with a median build year around 1997 have the most pools, 112 per 1,000 housing units. The oldest fifth (median 1965) has 51, and the newest fifth (median 2006) has 93 (22 US metros, ACS 2020-2024 year built).
The fifth of neighborhoods with the highest detached-house share (median 95% detached) has 159 pools per 1,000 housing units, against 19 where the median detached share is 13% (22 US metros, ACS 2020-2024 units in structure).
| Within-metro quintile | Home value: median ($) | Home value: pools per 1,000 HU | Year built: median | Year built: pools per 1,000 HU | Detached share: median (%) | Detached share: pools per 1,000 HU | Density: median HU per km2 | Density: pools per 1,000 HU |
|---|---|---|---|---|---|---|---|---|
| Q1 (lowest) | 205750 | 31 | 1965 | 51 | 13 | 19 | 295 | 205 |
| Q2 | 319900 | 56 | 1978 | 82 | 41 | 52 | 636 | 108 |
| Q3 | 384375 | 96 | 1986 | 84 | 62 | 71 | 1012 | 62 |
| Q4 | 461500 | 103 | 1997 | 112 | 76 | 120 | 1520 | 28 |
| Q5 (highest) | 627043 | 142 | 2006 | 93 | 95 | 159 | 3180 | 15 |
Source: PC&S analysis of the PC&S satellite census and ACS 2020-2024 tables B25077, B25035 and B25024; density from 2020 Census block housing units. Download CSV
The home value gradient is flatter than the income gradient.
Source: PC&S satellite pool census (USDA NAIP 2022 to 2023) joined to ACS 2020-2024 5-year tract estimates. Download chart data (CSV)
How much of the income gap is lot size and housing density
Richer neighborhoods are less dense, and low density alone strongly predicts pools. Holding density constant shrinks the income gap, but most of it remains: density explains 17% to 24% of the gap on a log scale. Adding detached-house share and year built changes little.
The least dense fifth of neighborhoods has 205 pools per 1,000 housing units and the densest fifth 15, across 22 US metros in 2022 to 2023 (PC&S analysis of the PC&S satellite census and Census ACS 2020-2024).
Within the lowest-density third of each metro (median 416 housing units per km2), the top income quintile has a pool index of 324 and the bottom quintile 50, where 100 is the metro average, a ratio of 6.5 (95% CI 3.6 to 8.5), 21 US metros (PC&S analysis of the PC&S satellite census and Census ACS 2020-2024).
In the densest third (median 2,412 housing units per km2), the income ratio is 3.0 (95% CI 2.1 to 4.0), so income still matters among dense neighborhoods (PC&S analysis of the PC&S satellite census and Census ACS 2020-2024).
Averaging over density thirds, the income ratio of the metro-relative index falls from 6.8 (95% CI 5.0 to 7.9) to 4.9 (95% CI 3.4 to 5.7). That is 17% of the gap on a log scale (95% CI 13 to 26), leaving 83% unexplained by density (PC&S analysis of the PC&S satellite census and Census ACS 2020-2024).
A quasi-Poisson model with metro fixed effects gives the same picture: the top-to-bottom income rate ratio is 6.8 (95% CI 4.6 to 7.9) with no controls, 4.3 (95% CI 3.1 to 5.1) with density quintiles, and 4.3 (95% CI 3.0 to 5.5) after adding detached-house share and year built quintiles, 21 US metros (PC&S analysis of the PC&S satellite census and Census ACS 2020-2024).
Counting detached homes instead of all housing units narrows the ratio to 2.7: 230 pools per 1,000 detached homes in the top income fifth vs 87 in the bottom fifth, where detached homes are 71% and 30% of housing units (PC&S analysis of the PC&S satellite census and Census ACS 2020-2024).
| Comparison | Top / bottom income quintile ratio | 95% CI low | 95% CI high | Share of log gap explained (%) |
|---|---|---|---|---|
| Composite of 22 metros, housing-unit weighted (no controls) | 8.4 | 6.0 | 11.0 | |
| Median of 21 per-metro ratios (no controls) | 7.8 | |||
| Metro-relative index, 21 metros (no controls) | 6.8 | 5.0 | 7.9 | 0 |
| Index standardised on density terciles | 4.9 | 3.4 | 5.7 | 17 |
| Inside lowest-density tercile | 6.5 | 3.6 | 8.5 | |
| Inside middle-density tercile | 3.5 | 2.6 | 4.9 | |
| Inside highest-density tercile | 3.0 | 2.1 | 4.0 | |
| Regression M0 metro + income (metro fixed effects) | 6.8 | 4.6 | 7.9 | 0 |
| Regression M1 + density (metro fixed effects) | 4.3 | 3.1 | 5.1 | 24 |
| Regression M2 + density, detached share, year built (metro fixed effects) | 4.3 | 3.0 | 5.5 | 23 |
| Per 1,000 detached homes instead of all housing units (21 metros) | 2.7 |
Source: PC&S analysis of the PC&S satellite census and Census ACS 2020-2024. Bootstrap 95% intervals (2,000 replicates for the index, 500 for the regressions). Download CSV
| Density tercile (within metro) | Income Q1 (lowest) | Income Q2 | Income Q3 | Income Q4 | Income Q5 (highest) | Q5 / Q1 |
|---|---|---|---|---|---|---|
| Lowest-density third (median 416 HU per km2) | 50 | 154 | 150 | 200 | 324 | 6.5 |
| Middle-density third (median 1,056 HU per km2) | 36 | 52 | 88 | 86 | 126 | 3.5 |
| Highest-density third (median 2,412 HU per km2) | 14 | 21 | 30 | 40 | 42 | 3.0 |
Source: PC&S analysis of the PC&S satellite census, Census ACS 2020-2024 and 2020 Census block housing units. Download CSV
Lot size is not measured directly; housing density is the proxy.
Source: PC&S satellite pool census (USDA NAIP 2022 to 2023) joined to ACS 2020-2024 5-year tract estimates. Download chart data (CSV)
A 2025 aerial-image study of Berlin reached the opposite emphasis, finding that space rather than wealth explained where about 23,000 private pools sit (Urban Journalism Network). In the 21 US metros measured here, density matters, but income keeps most of its effect.
Climate and metro differences: why richer metros have fewer pools
The income pattern inside metros does not carry over between metros. The highest-income metros in the sample are not the pool metros, while lower-income Sun Belt metros such as Tucson and Cape Coral-Fort Myers are. Climate and housing stock set the level, and income sorts pools within it.
Across 22 US metros, metro median household income (ACS 2020-2024) and pools per 1,000 housing units have a Spearman rank correlation of -0.54 (p = 0.01), so richer metros tend to have fewer pools (PC&S analysis of the PC&S satellite census and Census ACS 2020-2024 metro estimates).
The four highest-income metros in the sample, San Diego ($106,268), Denver ($105,762), Austin ($100,431) and New York ($99,155), have 72, 2, 38 and 47 pools per 1,000 housing units. The four lowest-income metros, Tucson ($70,315), Tampa ($74,392), Fresno ($74,468) and Cape Coral-Fort Myers ($76,107), have 150, 118, 146 and 202 (ACS 2020-2024 metro medians from Census ACS 2020-2024; pool rates from the PC&S satellite census, 2022 to 2023).
Metro median home value has no rank relationship with pool density across the same 22 metros (Spearman 0.01) (PC&S analysis of the PC&S satellite census and Census ACS 2020-2024).
Phoenix has 239 pools per 1,000 housing units in 2023 imagery and Denver 2, a ratio of about 156 to 1 on unrounded rates, wider than the top-to-bottom income ratio in any of the 21 metros (PC&S satellite census). Season length by metro is covered in pool season length by city.
Because every quintile in this report is cut within its own metro, the income ratios hold climate, water rules and metro-wide building practice constant. They do not say how much of the difference between Phoenix and Denver is climate, because climate is not measured directly here.
What federal household surveys say about pool owners' incomes
Two federal surveys measure pools household by household, which the satellite count cannot. Both show ownership rising with income. RECS 2024 shows the higher-income skew most clearly; AHS 2015 counts shared pools too and shows a flatter line.
In 2024, 9.8% of US houses (mobile homes and single-family houses, standard error 0.3 points) had their own swimming pool, about 9.6 million houses (EIA RECS 2024 microdata, PC&S tabulation).
State and metro pool shares from these surveys are compiled in percentage of homes with pools, and the national pool count in number of swimming pools in the US; this section looks only at income.
The share rises from 2.3% of houses with household income under $25,000 to 8.8% at $75,000 to $99,999, 12.7% at $100,000 to $149,999 and 20.6% at $200,000 or more, United States, 2024 (EIA RECS 2024).
Households earning $150,000 or more held 38.7% of US houses with a pool in 2024 and 22.2% of all houses. Households under $50,000 held 14.0% of pool houses and 29.4% of all houses (EIA RECS 2024).
| Household income (2024) | Houses with own pool (%) | Standard error (points) | Share of all pool houses (%) | Share of all houses (%) | Sample houses | Sample houses with pool |
|---|---|---|---|---|---|---|
| Under $25,000 | 2.3 | 0.5 | 2.8 | 11.8 | 1415 | 31 |
| $25,000 to $49,999 | 6.3 | 0.8 | 11.2 | 17.6 | 2165 | 110 |
| $50,000 to $74,999 | 7.1 | 0.6 | 12.8 | 17.8 | 2331 | 152 |
| $75,000 to $99,999 | 8.8 | 0.8 | 11.5 | 12.9 | 1721 | 126 |
| $100,000 to $149,999 | 12.7 | 0.8 | 22.9 | 17.8 | 2475 | 260 |
| $150,000 to $199,999 | 12.6 | 1.2 | 12.3 | 9.6 | 1316 | 152 |
| $200,000 or more | 20.6 | 1.0 | 26.4 | 12.6 | 1728 | 315 |
Source: PC&S tabulation of EIA 2024 RECS microdata, preliminary v1 (SWIMPOOL, MONEYPY, NWEIGHT; standard errors from 60 jackknife replicates per EIA guidance). Download CSV
Standard errors in the table; brackets are not quintiles.
Source: EIA 2024 RECS microdata, preliminary v1 (PC&S tabulation). Download chart data (CSV)
The 2015 American Housing Survey asked about a pool anywhere on the grounds. Among US houses, 8.1% in the bottom household income quintile and 16.7% in the top quintile had one, a ratio of 2.1 (Census/HUD AHS 2015 PUF, PC&S tabulation).
Among all occupied US homes, including apartments with complex pools, the 2015 share rose only from 14.0% to 19.0% between the bottom and top income quintiles (Census/HUD AHS 2015).
2015 is the latest AHS year that asked all households about a pool; AHS 2023 asked only households where children aged 6 and under live or visit.
Source: Census/HUD AHS 2015 national PUF (PC&S tabulation). Download chart data (CSV)
AHS 2015 is used because it is the latest AHS year that asked every household about a pool. The 2023 AHS limited the pool questions to households where children aged 6 and under live or regularly visit (2023 AHS Definitions), so it cannot describe all households.
Reading neighborhood income data: the ecological caveat and other limits
The satellite join measures neighborhoods, not households. A rich tract can contain modest homes with pools, and a poor tract can contain a few large lots. The survey cross-checks exist for that reason.
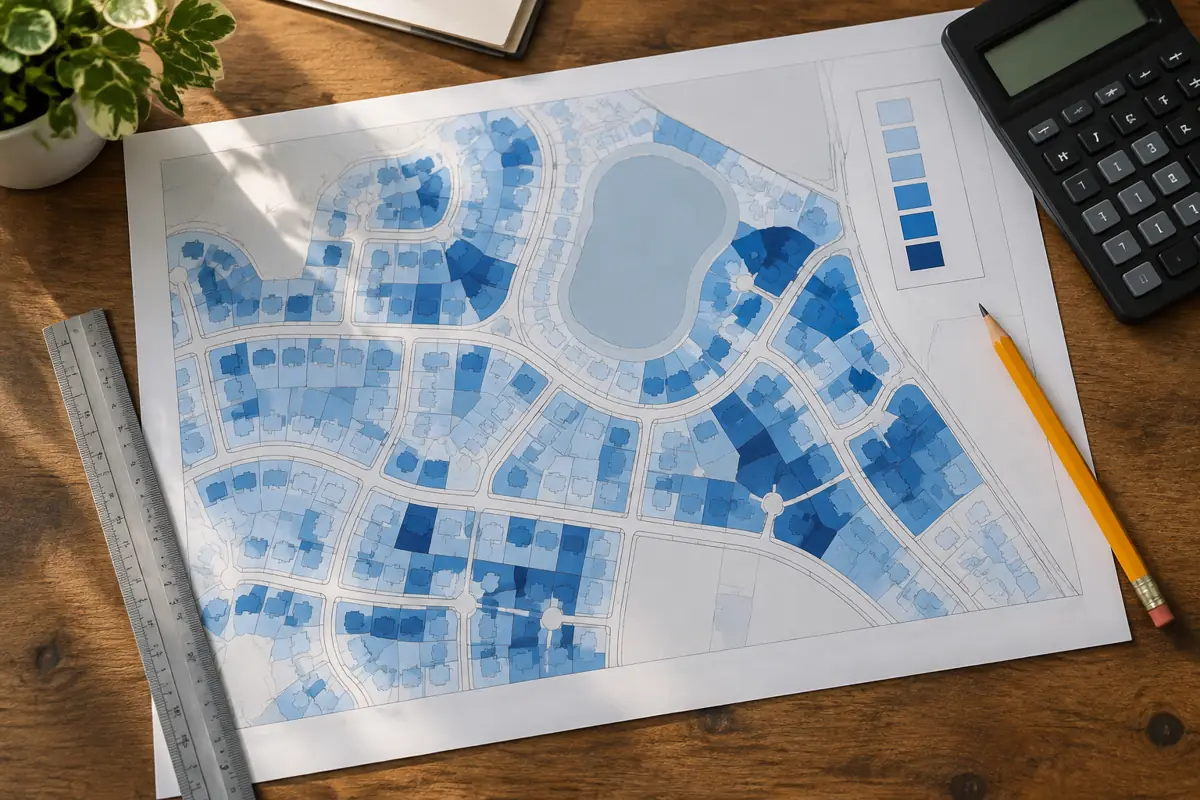
- Detector accuracy may differ by neighborhood. Precision and recall were measured per metro and region, not per income group, so the ratios assume equal accuracy across quintiles (PC&S satellite census).
- Detected pools include some community and apartment pools up to 200 m2, which may lift rates in dense, lower-income neighborhoods and make the income gap look smaller than it is for private pools (PC&S satellite census).
- Imagery dates (2022 to 2023) and ACS income (2020 to 2024) overlap but do not match exactly (Census ACS release notes).
- AHS 2015 is the oldest source used and counts any pool on the grounds; RECS 2024 microdata are a preliminary first version (Census/HUD AHS 2015; EIA RECS 2024).
- A remote-sensing study in Campinas, Brazil also found more pools in high socioeconomic areas, which supports using pools as a wealth marker but comes from a different country and method (Cunha et al., PLOS ONE, 2021).
Measures we built from the data
Recall-adjusted pools per 1,000 housing units by within-metro income quintile
How many backyard pools do neighborhoods at each income level have, holding the metro constant?
rate_mq = mean(pools_cell / HU_cell) / mean(covered share) over draws in quintile q of metro m x precision_m / recall_region x 1,000; composite = housing-unit-weighted mean over 22 metrosInputs: facts rows 9, 10, 4; derived rows D3 to D21
Limitations: Neighborhood (tract) income, not household income; precision and recall assumed equal across quintiles; about 19 cells per metro quintile.
Top vs bottom income quintile ratio per metro
Does the income gradient hold in every metro?
ratio_m = rate_m,q5 / rate_m,q1; bootstrap 95% interval from 5,000 within-metro resamplesInputs: derived rows D135 to D281 (seven rows per metro), D106
Limitations: Wide intervals; Denver excluded for too few detections; Chicago precision 65%.
Pools by within-metro home value quintile
Is home value a better predictor than income?
same domain estimator with quintiles of tract median home value (B25077)Inputs: derived rows D23 to D42, D109 to D111
Limitations: Home value missing for 5.7% of sampled housing units; home value also carries land prices, not only house size.
Income gradient after stratifying by housing density
How much of the income gap is explained by lot size, proxied by housing density?
index_d = 100 x ratio_d / metro mean ratio; standardised ratio = mean over density terciles of index[q5] / of index[q1]; share explained = 1 - ln(standardised) / ln(unstratified)Inputs: derived rows D284 to D293, D321 to D332
Limitations: Housing units per cell is a coarse lot-size proxy; residual confounding from lot size remains.
Pools per 1,000 detached homes by income quintile
Is the gradient just apartments vs houses?
rate = mean(pools_cell / HU_cell) / mean(detached share) x precision / recall / coverage x 1,000Inputs: derived rows D333 to D343
Limitations: All detected pools are divided by detached homes, so complex pools inflate the bottom quintile; detached share is a tract estimate.
Income vs pools between metros
Do richer metros have more pools?
Spearman rank correlation of ACS 2020-2024 metro median household income and source-census pools per 1,000 housing unitsInputs: derived rows D344, D345, D346
Limitations: 22 metros, chosen for pool relevance, not a random sample; climate is not measured directly.
Split-half check
Is the income ratio stable across independent samples?
composite q5 / q1 computed separately on sample wave 1 and wave 2 (48 draws per metro each)Inputs: derived rows D350, D351
Limitations: Point estimates only; each wave has half the sample.
Latest data in this edition
- First edition: 2,109 sampled 500 m cell draws in 22 US metros joined to ACS tract data (the sample touches 2,995 Census tracts), with bootstrap intervals for every quintile rate.
- EIA released the preliminary 2024 RECS microdata (version 1), used here for household pool ownership by income (EIA RECS 2024).
- Census released the 2020-2024 ACS 5-year estimates on January 29, 2026, the newest tract-level income and housing data (Census ACS release notes).
- The NAIP collection used for the pool counts ends in 2023; metros were imaged in 2022 (California, Nevada, Texas) or 2023 (Arizona, Florida, Colorado) or both (PC&S satellite census; Planetary Computer NAIP).
Quick answers
Do rich neighborhoods have more pools?
Yes. Within the same metro, the top income fifth of neighborhoods had 172 backyard pools per 1,000 housing units in 2022 to 2023 and the bottom fifth 20, across 22 US metros, and the top fifth had more pools in all 21 metros with enough data (PC&S analysis of the PC&S satellite census and Census ACS 2020-2024).
What income do you need to afford a pool?
The data show who owns pools, not affordability. In 2024, US houses first exceed the all-house pool rate of 9.8% in the $100,000 to $149,999 income bracket (12.7%) (EIA RECS 2024). The top satellite income quintile has a typical neighborhood median income of $141,191 (Census ACS 2020-2024). Costs are in average cost to build a pool.
What percentage of pool owners are high income?
In 2024, 38.7% of US houses with a pool were in households earning $150,000 or more, and 26.4% in households earning $200,000 or more. Households under $50,000 held 14.0% of pool houses (EIA RECS 2024 microdata, PC&S tabulation).
Are pools a luxury?
Pools skew to higher incomes but are not exclusive to them. In 2024, 20.6% of US houses earning $200,000 or more had a pool vs 2.3% under $25,000 (EIA RECS 2024), yet the bottom income quintile of North Port-Sarasota, FL has 101 pools per 1,000 housing units in 2023 imagery (PC&S analysis of the PC&S satellite census and Census ACS 2020-2024).
Which income group owns the most pools?
Households earning $200,000 or more have both the highest pool rate, 20.6% of their houses, and the largest share of US pool houses, 26.4%, in 2024; the $100,000 to $149,999 bracket holds 22.9% (EIA RECS 2024 microdata, PC&S tabulation).
Questions and answers
How were pools linked to income?
Each of 2,109 sampled 500 m cell draws in 22 US metros was matched to the Census tracts of its 2020 housing units, and given the housing-unit-weighted ACS 2020-2024 tract median household income (PC&S analysis of the PC&S satellite census and Census ACS 2020-2024).
Why rank neighborhoods within each metro?
Pool density varies widely between metros, from 239 per 1,000 housing units in Phoenix to 2 in Denver in 2023 (PC&S satellite census), largely for reasons of climate and housing stock, so ranking within each metro keeps those differences from posing as an income effect.
What does recall-adjusted mean?
The detector finds about 72% of visible pools in hand-audited cells (2022 to 2023 imagery), so counts are divided by the regional recall, from 59% in northern metros to 84% in Florida (PC&S satellite census).
Does this prove that richer households own pools?
Not on its own, because tract averages do not describe individuals. The household surveys do: 20.6% of US houses earning $200,000 or more had a pool in 2024 vs 2.3% under $25,000 (EIA RECS 2024).
Is the gap just because poorer areas have more apartments?
Partly. Per detached home, the top income fifth has 230 pools per 1,000 and the bottom fifth 87, a ratio of 2.7 instead of 8.4, 21 US metros, 2022 to 2023 (PC&S analysis of the PC&S satellite census and Census ACS 2020-2024).
Do bigger lots explain the income gap?
Less than a quarter of it. Housing density, the lot-size proxy, explains 17% to 24% of the gap on a log scale in 21 US metros, and the ratio stays at 4.3 after density, detached share and year built (PC&S analysis of the PC&S satellite census and Census ACS 2020-2024).
Is home value a better predictor of pools than income?
No. The top-to-bottom home value ratio is 4.5 against 8.4 for income, 22 US metros, 2022 to 2023 (PC&S analysis of the PC&S satellite census and ACS 2020-2024 home values).
Do newer neighborhoods have more pools?
Up to a point. Neighborhoods with a median build year near 1997 have 112 pools per 1,000 housing units, more than the newest fifth (median 2006) at 93, 22 US metros (ACS 2020-2024 year built).
Which metros were left out?
Atlanta, Washington DC and Seattle, where detector precision fell below 50% in October 2023 imagery, and Denver for per-metro ratios, with only 43 raw detections (PC&S satellite census).
How current are the data?
Imagery is from 2022 to 2023, tract data are the ACS 2020-2024 5-year release of January 29, 2026 (Census), RECS microdata were released in May 2026, and AHS 2015 is the oldest source (EIA RECS 2024; Census/HUD AHS 2015).
Data, citation and press kit
Figures ready to quote
- In 22 US metros, neighborhoods in the top income fifth had 172 backyard pools per 1,000 housing units in 2022 to 2023, against 20 in the bottom fifth. (U.S. Census Bureau)
- Within the same US metro, high-income neighborhoods have 8.4 times the backyard pools per housing unit of low-income neighborhoods (2022 to 2023 imagery). (Pool Construction & Service)
- Housing density explains 17% to 24% of the neighborhood income gap in pool ownership across 21 US metros, on a log scale. (Pool Construction & Service)
- In 2024, 20.6% of US houses in households earning $200,000 or more had their own swimming pool, against 2.3% under $25,000. (U.S. Energy Information Administration)
- US households earning $150,000 or more held 38.7% of houses with a pool in 2024 but 22.2% of all houses. (U.S. Energy Information Administration)
- Across 22 US metros, richer metros have fewer backyard pools per home (Spearman -0.54), while within each metro richer neighborhoods have more. (Pool Construction & Service)
If you cite only a few sources
- Cities With the Most Pools: satellite census of 25 US metros (source data), Pool Construction & Service
- ACS 2020-2024 5-year summary file, table B19013 (median household income), U.S. Census Bureau
- 2024 RECS microdata, preliminary version 1, U.S. Energy Information Administration
- AHS 2015 national public use file v3.1, U.S. Census Bureau and HUD
- Ecological correlations and the behavior of individuals (1950), American Sociological Review (Robinson, 1950)
Summary for editors
Pool Construction & Service joined its satellite count of backyard pools in 22 US metros to Census tract data on income, home value, housing age and housing type. Within each metro, neighborhoods in the top income fifth had 172 pools per 1,000 housing units in 2022 to 2023 imagery, against 20 in the bottom fifth, a ratio of 8.4. The top fifth had more pools than the bottom fifth in all 21 metros with enough data, from Chicago (3.2 times) to Tucson (49.5 times). Lower housing density, a stand-in for bigger lots, explains only 17% to 24% of the gap. Between metros the pattern reverses: higher-income metros such as San Diego, Denver and New York have fewer pools per home than Tucson or Cape Coral-Fort Myers. Federal survey data agree at the household level: in 2024, 20.6% of US houses earning $200,000 or more had a pool, against 2.3% under $25,000 (EIA RECS). Figures are neighborhood averages, not household records.
Headlines the data supports
- Top-Income Neighborhoods Have 8.4 Times the Backyard Pools of Low-Income Ones, Satellite Count Finds
- Richer Neighborhoods Have More Backyard Pools in All 21 US Metros Measured
- Housing Density Explains Less Than a Quarter of the Neighborhood Pool Income Gap
- Richer Metros, Fewer Pools: Income Sorts Pools Within Metros, Not Between Them
- One in Five US Houses Earning $200,000 or More Has a Pool, Federal Survey Shows
How to cite this report
Pool Construction & Service. "Swimming Pool Ownership by Income: Satellite Pool Counts Joined to Census Income in 22 US Metros." PC&S Research Desk, October 18, 2026. https://poolconstructionandservice.com/research/swimming-pool-ownership-by-income/
Reuse
The data tables and charts in this report are licensed under CC BY 4.0. Reuse them with this attribution: “Source: Pool Construction & Service (poolconstructionandservice.com), Swimming Pool Ownership by Income: Satellite Pool Counts Joined to Census Income in 22 US Metros.” Figures from third-party sources remain subject to their publishers’ terms.
Download the data
- Pools per 1,000 housing units by within-metro income quintile, 22 US metros, 2022 to 2023 CSV
- Top vs bottom income quintile pools by metro, 21 US metros CSV
- Pools by home value, year built, detached share and density quintile CSV
- Income gap before and after density and housing controls CSV
- Pool index by density third and income quintile CSV
- US houses with a pool by household income, RECS 2024 CSV
- US homes with a pool by household income quintile, AHS 2015 CSV
- Full fact sheet with sources and limitations CSV
How we graded sources
Tier 1: primary and government sources (21)
- U.S. Census Bureau: ACS 2020-2024 5-year summary file, table B19013 (median household income)
- U.S. Census Bureau: ACS 2020-2024 5-year summary file, table B25077 (median value)
- U.S. Census Bureau: ACS 2020-2024 5-year summary file, table B25035 (median year built)
- U.S. Census Bureau: ACS 2020-2024 5-year summary file, table B25024 (units in structure)
- U.S. Census Bureau: 2024 ACS data release: new and notable
- U.S. Census Bureau: 2025 ACS data release schedule
- U.S. Census Bureau: 2024 ACS subject definitions
- U.S. Census Bureau: Geography Program glossary: census tract
- U.S. Census Bureau: TIGERweb 2020 Census blocks (HU100)
- U.S. Census Bureau: Metropolitan and micropolitan delineation files, July 2023
- U.S. Geological Survey (EROS): USGS EROS Archive: National Agriculture Imagery Program (NAIP)
- U.S. Energy Information Administration: 2024 RECS microdata, preliminary version 1
- U.S. Energy Information Administration: Using the 2024 RECS microdata file to compute estimates and standard errors
- U.S. Census Bureau and HUD: AHS 2015 national public use file v3.1
- U.S. Census Bureau and HUD: 2015 AHS definitions (pool safety)
- U.S. Census Bureau and HUD: 2023 AHS definitions (pool safety universe)
- U.S. Census Bureau: Getting started with the AHS public use file: 2015 to 2023
- U.S. Census Bureau: Quick guide to estimating variance using replicate weights
- U.S. Census Bureau: Income in the United States: 2025 (P60-289)
- American Sociological Review (Robinson, 1950): Ecological correlations and the behavior of individuals (1950)
- PLOS ONE (Cunha et al., 2021): Water tank and swimming pool detection based on remote sensing and deep learning (2021)
Tier 2: trade bodies, public companies, market research (2)
- Pool Construction & Service: Cities With the Most Pools: satellite census of 25 US metros (source data)
- Microsoft Planetary Computer (USDA FSA NAIP): NAIP STAC collection
Tier 3: journalism and expert commentary (1)
Sources
- Pool Construction & Service. Cities With the Most Pools: satellite census of 25 US metros (source data). Accessed 2026-10-18.
- U.S. Census Bureau. ACS 2020-2024 5-year summary file, table B19013 (median household income). Accessed 2026-10-18.
- U.S. Census Bureau. ACS 2020-2024 5-year summary file, table B25077 (median value). Accessed 2026-10-18.
- U.S. Census Bureau. ACS 2020-2024 5-year summary file, table B25035 (median year built). Accessed 2026-10-18.
- U.S. Census Bureau. ACS 2020-2024 5-year summary file, table B25024 (units in structure). Accessed 2026-10-18.
- U.S. Census Bureau. 2024 ACS data release: new and notable. Accessed 2026-10-18.
- U.S. Census Bureau. 2025 ACS data release schedule. Accessed 2026-10-18.
- U.S. Census Bureau. 2024 ACS subject definitions. Accessed 2026-10-18.
- U.S. Census Bureau. Geography Program glossary: census tract. Accessed 2026-10-18.
- U.S. Census Bureau. TIGERweb 2020 Census blocks (HU100). Accessed 2026-10-18.
- U.S. Census Bureau. Metropolitan and micropolitan delineation files, July 2023. Accessed 2026-10-18.
- U.S. Geological Survey (EROS). USGS EROS Archive: National Agriculture Imagery Program (NAIP). Accessed 2026-10-18.
- Microsoft Planetary Computer (USDA FSA NAIP). NAIP STAC collection. Accessed 2026-10-18.
- U.S. Energy Information Administration. 2024 RECS microdata, preliminary version 1. Accessed 2026-10-18.
- U.S. Energy Information Administration. Using the 2024 RECS microdata file to compute estimates and standard errors. Accessed 2026-10-18.
- U.S. Census Bureau and HUD. AHS 2015 national public use file v3.1. Accessed 2026-10-18.
- U.S. Census Bureau and HUD. 2015 AHS definitions (pool safety). Accessed 2026-10-18.
- U.S. Census Bureau and HUD. 2023 AHS definitions (pool safety universe). Accessed 2026-10-18.
- U.S. Census Bureau. Getting started with the AHS public use file: 2015 to 2023. Accessed 2026-10-18.
- U.S. Census Bureau. Quick guide to estimating variance using replicate weights. Accessed 2026-10-18.
- U.S. Census Bureau. Income in the United States: 2025 (P60-289). Accessed 2026-10-18.
- American Sociological Review (Robinson, 1950). Ecological correlations and the behavior of individuals (1950). Accessed 2026-10-18.
- PLOS ONE (Cunha et al., 2021). Water tank and swimming pool detection based on remote sensing and deep learning (2021). Accessed 2026-10-18.
- Urban Journalism Network. Pools of privilege: detecting swimming areas in aerial images (2025). Accessed 2026-10-18.
Related pool research
Pool Construction Statistics: PC&S Pool Construction Index, September 2026
Number of Swimming Pools in the US: Published Estimates Reconciled

Pool Permit Processing Time: Days From Application to Issue in 12 US Cities, 2019 to 2026
Pool Removal Statistics: Permit Counts for US Cities, 2015 to 2026
Percentage of Homes With Pools by Metro and State: Backyard Pool Prevalence Index

How Many Homes Have a Hot Tub? US State Atlas of Hot Tub and Spa Ownership, 2024
All pool industry research (48 reports)