Pool Construction Statistics: New Pool Permits in 14 US Markets, 2015 to 2026
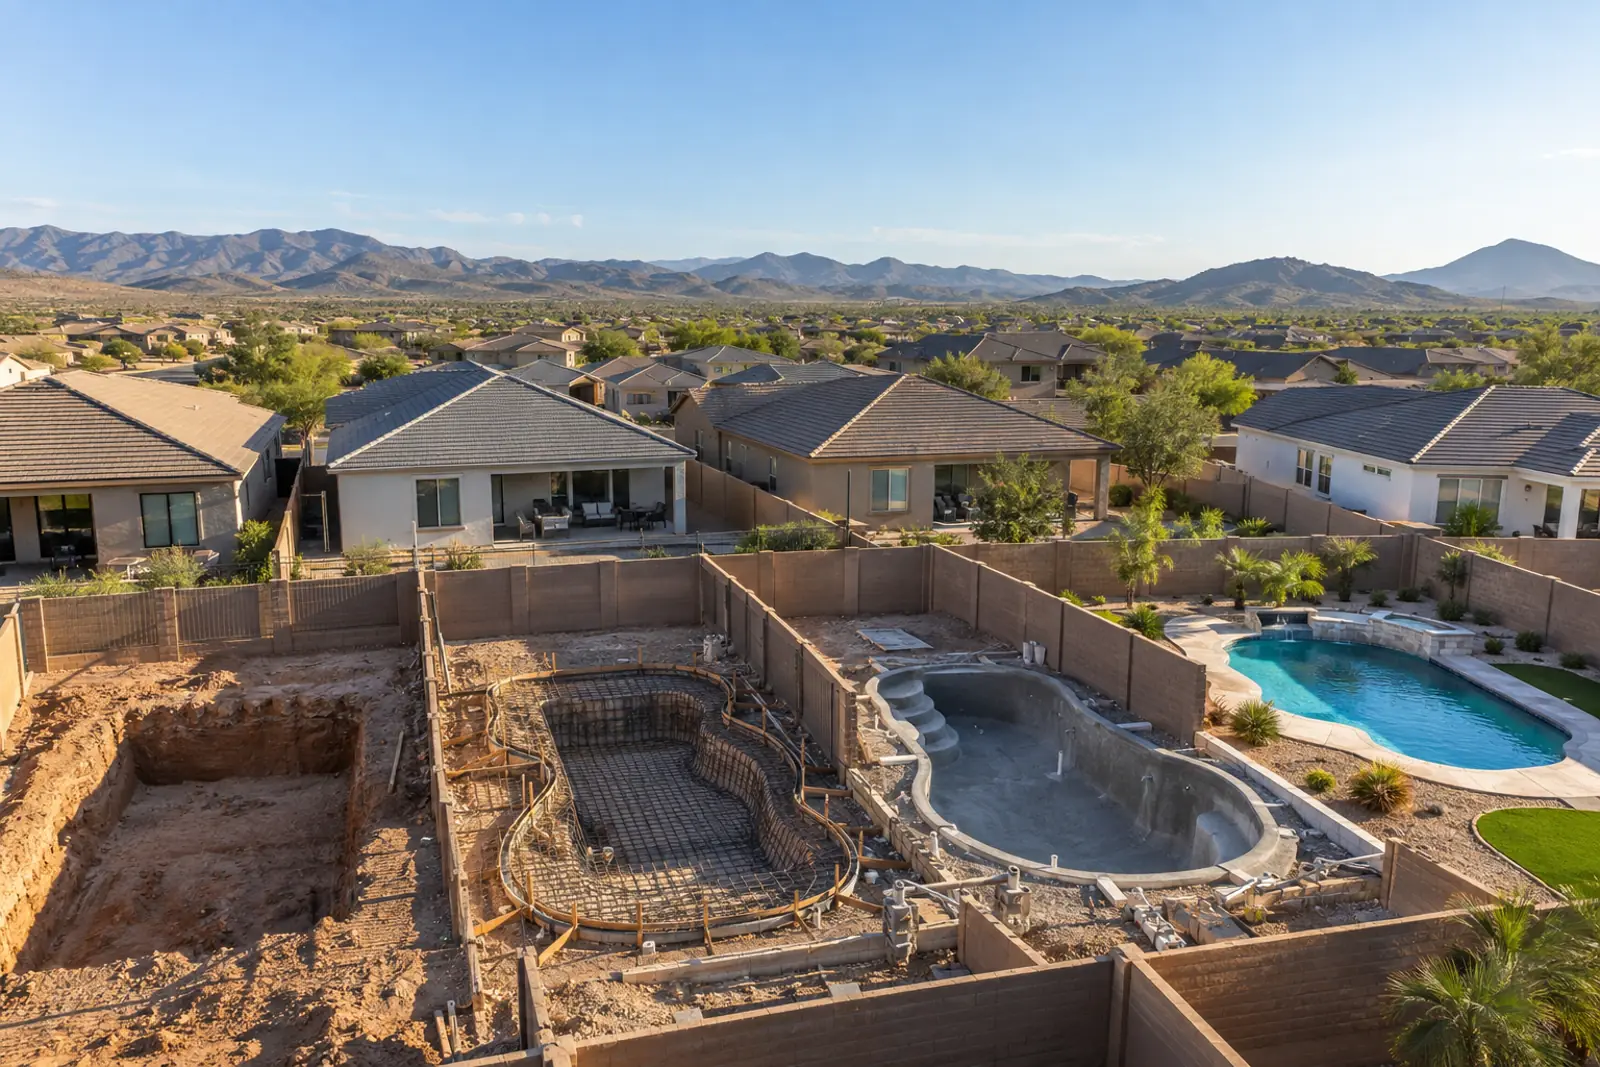
Pool construction statistics from city permit records show that nine US Sun Belt cities issued 3,773 new residential pool permits in 2025, 19.4% fewer than in 2019 and 47.7% below the 2021 peak. From January to August 2026, permits in those cities ran 3.6% above the same months of 2025.
How we built the dataset
- Searched the Socrata, ArcGIS Hub and CKAN catalogs for building-permit datasets in US pool markets, then tested each for permit-level records with a pool permit type or work description.
- Kept datasets with permit-level records from at least 2019 to August 2026 as the core sample (nine Sun Belt cities plus Montgomery County, Maryland), and datasets with shorter coverage for 2025 and 2026 comparisons only.
- Downloaded raw records on 2026-10-03 (raw/permits) and applied a city-specific record filter (tables/city_methods.csv).
- Screened work descriptions with documented text rules to remove remodels, repairs, replastering, supplemental and revision permits, spas added to existing pools, above-ground pools, pool removals and replacement pools, gas-line or heater-only permits and master-file templates (scripts/build_dataset.py).
- Removed duplicates: a permit at the same normalised street address within 365 days of a counted permit is treated as the same pool.
- Counted permits by issue year and month (Fort Worth: application filing date), compared January to August 2026 with January to August 2025, and computed indexes, changes, per-household rates and monthly shares (scripts/analyze.py).
- Cross-checked direction against Pool Corporation and Latham Group SEC filings, the NAHB Pool Construction Permit Index, the PHTA Market Intelligence Report and HBW market reviews.
- Published by the PC&S Research Desk at Pool Construction & Service, an independent matching and information service for homeowners looking for pool builders and pool service. More reports: PC&S research hub.
Included: Building or pool permits for new in-ground swimming pools at single-family or two-family homes, issued (or, in Fort Worth, filed) in a covered year. Pool-and-spa combinations count once.
Excluded: Commercial and multifamily pools, spa-only and hot tub permits where identifiable, above-ground pools, remodels and repairs, replacement pools, supplemental or revision permits, trade permits (electrical, plumbing, gas), and years with incomplete coverage. Cities that were blocked, lacked history, or showed coverage breaks are listed in excluded.md.
Conflicting numbers: Where Pool Corporation revised a prior-year unit estimate, the latest filing is used and the revision is noted. City counts and national estimates measure different things (permits vs units built), so they are compared as indexes, never added together.
Derived metrics: All derived metrics are computed by scripts/analyze.py and scripts/make_facts.py from the counted permit file; each derived value is listed in derived.csv with its formula and the facts.csv rows it uses.
Caveats
- Permit counts measure approvals, not completed pools.
- City definitions and record systems differ; compare trends, not levels.
- Three cities (Las Vegas, San Antonio, part of Fort Worth) cannot separate spa-only permits from pools.
- The sample covers 13 cities and one county; it is not a national estimate and over-represents the Southwest and California.
- ACS households (2020 to 2024 average) include apartment households.
- San Diego shows a high share of later-cancelled approvals; counting only non-cancelled permits changes its 2019 to 2025 decline from 31.6% to 22.1%.
Method last reviewed October 3, 2026.
The short version
- Nine Sun Belt cities issued 3,773 new residential pool permits in 2025, down from 7,213 in 2021 and 4,683 in 2019 (PC&S analysis of city permit data; sources: City of Austin, LA Department of Building and Safety, City of Las Vegas and six others).
- The 2020 to 2022 boom was real in permit data: the nine-city total rose 54.0% from 2019 to 2021, compared with a 46.3% rise in Pool Corporation national unit estimates over the same years.
- By 2025 the median city sat 45.5% below its own peak year, with Mesa, Arizona down 63.4% from 2020 (City of Mesa).
- Six of nine Sun Belt cities issued fewer pool permits in 2025 than in 2019; Austin (+23.0%) and Raleigh (+171.1%) were the clear exceptions (City of Austin, City of Raleigh).
- From January to August 2026, 7 of 13 jurisdictions issued more pool permits than a year earlier and 6 issued fewer; the 13 combined were +1.0% (PC&S analysis of city permit data).
- Cape Coral, Florida issued 1,229 new pool permits in 2025, or 148.2 per 10,000 households, about seven times the rate of the next-highest city, Las Vegas (21.3) (City of Cape Coral; US Census Bureau).
- Sun Belt pool permits are issued almost evenly through the year: March is busiest at 9.1% of 2019 to 2025 permits and November quietest at 7.2% (PC&S analysis of city permit data).
What the permit data shows
- The nine-city total of new residential pool permits peaked at 7,213 in 2021, 54.0% above the 4,683 issued in 2019 (PC&S analysis of city permit data).
- Average annual permits in the nine cities were 6,429 in 2020 to 2022, 38.4% above the 2017 to 2019 average of 4,645 (PC&S analysis of city permit data).
- The nine-city total fell in each year after 2021, reaching 3,773 in 2025, an index of 80.6 on a 2019 = 100 base (PC&S analysis of city permit data).
- Mesa, Arizona issued 329 new pool permits in 2025, 54.8% fewer than the 728 issued in 2019, the steepest 2019-to-2025 decline among the core cities (City of Mesa).
- Las Vegas issued 527 residential pool permits in 2025, 54.1% below its 2021 peak of 1,148 (City of Las Vegas).
- Los Angeles issued 1,093 new pool permits for one- and two-family homes in 2025, down 45.5% from 2,004 in 2021 (LA Department of Building and Safety).
- Austin issued 648 new residential pool permits in 2025, 23.0% more than in 2019 but 36.9% fewer than at the 2021 peak of 1,027 (City of Austin).
- San Antonio issued 346 swimming pool or spa permits in 2025, 51.3% below the 710 issued in 2021, the first full year of its published records (City of San Antonio).
- Orlando was the only core Sun Belt city whose peak came after 2022: it issued 432 residential pool permits in 2023 and 259 in 2025 (City of Orlando).
- Montgomery County, Maryland, the non-Sun Belt comparator, issued 111 in-ground pool permits in 2025, 63.2% more than in 2019 and close to its 2023 high of 114 (Montgomery County).
- From January to August 2026, the nine Sun Belt cities issued 2,687 pool permits, 3.6% more than the 2,593 issued in the same months of 2025 (PC&S analysis of city permit data).
- San Antonio pool and spa permits fell 28.6% from January to August 2026 versus the same period of 2025, the largest year-to-date decline among the 13 jurisdictions (City of San Antonio).
- Cape Coral, Florida issued 1,229 new residential pool permits in 2025, more than Los Angeles (1,093) with about one-seventeenth as many households (City of Cape Coral; US Census Bureau ACS).
- Pool Corporation estimates that new in-ground pool construction in the United States fell from 62,000 units in 2024 to just below 60,000 units in 2025 (Pool Corporation Form 10-K).
- The NAHB Pool Construction Permit Index for December 2025 was 23.4% below its January 2020 base on a seasonally adjusted basis (NAHB Eye on Housing).
How this pool construction dataset was built from city permit records
National figures for new pools come from industry estimates, so this report counts pools where they are recorded: municipal building permits. We pulled raw permit records from 14 city and county open-data portals, kept only new residential in-ground pools, and removed duplicates.
The study screened 121,259 permit records issued from January 2015 to August 2026 and identified 65,037 as new residential in-ground pool permits; the analysis uses only the years with complete coverage in the methods table. Each city was filtered on its own permit type (for example ‘Swimming-Pool/Spa’ for one- and two-family homes in Los Angeles, or building permit class R-329 with a pool description in Austin). Where a city publishes a work description, the text was screened to drop remodels, replastering, supplemental permits, spas added to an existing pool, above-ground pools, pool removals and gas-line-only permits.
Dates are permit issue dates, except Fort Worth, which publishes only the application filing date. Every issued permit counts, even if it now shows a later status such as cancelled or expired, because later status changes pile up over time and would make older years look smaller.
| city | publisher | dataset | url | record_filter | description_rule | date_field | dedupe_rule | years_used | source_records_2015_2026 | counted_permits_2015_2026 | known_issues |
|---|---|---|---|---|---|---|---|---|---|---|---|
| Austin, TX | City of Austin | Issued Construction Permits (3syk-w9eu) | https://data.austintexas.gov/d/3syk-w9eu | permittype BP; permit_class 'R- 329 Res Structures Other Than Bldg'; work_class New; jurisdiction AUSTIN FULL PURPOSE | description must contain pool/swimming; exclusion patterns applied | issue_date | same normalised street address within 365 days counted once | 2015 to Aug 2026 | 8037 | 7516 | Separate plumbing and electrical permits for the same pool are not counted (building permit only). |
| Fort Worth, TX | City of Fort Worth | CFW Open Data Development Permits (ArcGIS view) | https://services5.arcgis.com/3ddLCBXe1bRt7mzj/arcgis/rest/services/CFW_Open_Data_Development_Permits_View/FeatureServer/0 | Permit_Type 'Residential Accessory Struct'; Use_Type 'Pool or Spa'; subtype New or Addition; status Finaled, Issued, Expired or Closed | exclusion patterns on work description | File_Date (application date) | same normalised street address within 365 days counted once | 2015 to Aug 2026 | 6403 | 6319 | No issue date is published, so Fort Worth counts are dated by application filing, not issuance. |
| Las Vegas, NV | City of Las Vegas | Building Permits (OpenData_Building_Permits_, ArcGIS) | https://services1.arcgis.com/F1v0ufATbBQScMtY/arcgis/rest/services/OpenData_Building_Permits_/FeatureServer/0 | WORKTYPE PoolSpa; APTYPE Res; permits with 1 to 2,499 gallons treated as spa-only and excluded | no description published | ISSDTTM | same normalised street address within 365 days counted once | 2015 to Aug 2026 | 8750 | 8317 | City of Las Vegas only; unincorporated Clark County and Henderson are not included. |
| Los Angeles, CA | LA Department of Building and Safety | Building Permits Issued 2010 to 2019 (dyxf-7hc4) and 2020 to Present (pi9x-tg5x) | https://data.lacity.org/d/pi9x-tg5x | permit_type 'Swimming-Pool/Spa'; permit_sub_type '1 or 2 Family Dwelling' | exclusion patterns on work_desc (supplementals, remodels, spa added to existing pool, demolitions) | issue_date | same normalised street address within 365 days counted once | 2015 to Aug 2026 | 27500 | 16689 | Two datasets joined at 1 Jan 2020; issuance fell to 31 permits in April 2020. |
| Mesa, AZ | City of Mesa | Building Permits (dzpk-hxfb) | https://citydata.mesaaz.gov/d/dzpk-hxfb | permit_type RES (all residential permits) | description must describe building a pool; gas-line and heater-only permits excluded | issued_date | same normalised street address within 365 days counted once | 2015 to Aug 2026 | 49742 | 6747 | Permit numbering changed from BLD to PMT in 2017; pool counts are continuous across the change. |
| New Orleans, LA | City of New Orleans | Permits (rcm3-fn58) | https://data.nola.gov/d/rcm3-fn58 | type 'Swimming Pool'; land use single-family or two-family | exclusion patterns on description | issuedate | same normalised street address within 365 days counted once | 2015 to Aug 2026 | 2240 | 2177 | Small annual counts (under 300). |
| Orlando, FL | City of Orlando | Permit Applications (ryhf-m453) | https://data.cityoforlando.net/d/ryhf-m453 | application_type 'Building Permit'; worktype Pool; plan_review_type 'Residential 1/2' | exclusion patterns on project name; master files excluded | issue_permit_date | same normalised street address within 365 days counted once | 2015 to Aug 2026 | 3715 | 3612 | Project name field is often an owner name, so text screening is weaker than elsewhere. |
| Raleigh, NC | City of Raleigh | Building Permits (ArcGIS) | https://services.arcgis.com/v400IkDOw1ad7Yad/arcgis/rest/services/Building_Permits/FeatureServer/0 | workclass 'Pool/Spa' or 'Swimming Pool - Resd'; permitclassmapped Residential; inside city limits | exclusion patterns on work description | issueddate | same normalised street address within 365 days counted once | 2018 to Aug 2026 | 1019 | 849 | The Pool/Spa work class first appears in 2017; small annual counts (under 140). |
| San Diego, CA | City of San Diego Development Services | Approvals for development projects (approvals issued file) | https://data.sandiego.gov/datasets/development-permits/ | JOB_BC_CODE 3293 'Pool or Spa/1 or 2 Family'; approval type Combination Building Permit or Building Permit | exclusion patterns on approval scope (removals, remodels, spa-only) | APPROVAL_ISSUE_DATE | same normalised street address within 365 days counted once | 2015 to Aug 2026 | 4484 | 3973 | About one in four 2017 to 2022 approvals now show Cancelled status; issued permits are counted regardless of later status. |
| Montgomery County, MD | Montgomery County Government | Residential Permit (m88u-pqki) | https://data.montgomerycountymd.gov/d/m88u-pqki | usecode 'SWIMMING POOL - IN GROUND'; worktype CONSTRUCT | explicit exclusion patterns only | issueddate | same normalised street address within 365 days counted once | 2015 to Aug 2026 | 1021 | 957 | Non Sun Belt comparator; county excludes some municipalities with their own permitting. |
| San Antonio, TX | City of San Antonio | Building Permits: Permits Issued (CKAN CSV files) | https://data.sanantonio.gov/dataset/building-permits | PERMIT TYPE 'Swimming Pool or Spa Permit' | no description published | DATE ISSUED | same normalised street address within 365 days counted once | 2021 to Aug 2026 | 2812 | 2777 | Published records begin 2 Dec 2020, so no 2019 baseline; permit type includes spas, which cannot be separated. |
| East Baton Rouge Parish, LA | City of Baton Rouge / Parish of East Baton Rouge | EBR Building Permits (7fq7-8j7r) | https://data.brla.gov/d/7fq7-8j7r | permittype 'Swimming Pool Permit (R)' | exclusion patterns on project description | issueddate | same normalised street address within 365 days counted once | 2015 to 2024 only | 2225 | 2176 | Structural break in 2025: new single-family permits in the same file fell from 994 (2024) to 434 (2025); 2025 and 2026 excluded. |
| Nashville-Davidson, TN | Metropolitan Government of Nashville and Davidson County | Building Permits Issued (ArcGIS) | https://services2.arcgis.com/HdTo6HJqh92wn4D8/arcgis/rest/services/Building_Permits_Issued_2/FeatureServer/0 | Permit_Subtype_Description 'Accessory Structure, Pools - Residential' | exclusion patterns on purpose text | Date_Issued | same normalised street address within 365 days counted once | 2024 to Aug 2026 | 987 | 763 | Published layer starts 28 Sep 2023; used for 2025 and 2026 year-to-date only. |
| Cape Coral, FL | City of Cape Coral | Building Permits (OpenData MapServer layer 1) | https://capeims.capecoral.gov/arcgis/rest/services/OpenData/OpenData/MapServer/1 | Work_Class 'Pool: Above Ground / In Ground / Spa / Renovation' | exclusion patterns incl. AG (above-ground) shorthand, fountains, enclosure-only | issuedate | same normalised street address within 365 days counted once | 2025 to Aug 2026 | 2324 | 2165 | Published layer starts 2 Jan 2025; used for 2025 and 2026 year-to-date only. |
Source: PC&S Research Desk; dataset links in the table. Download CSV
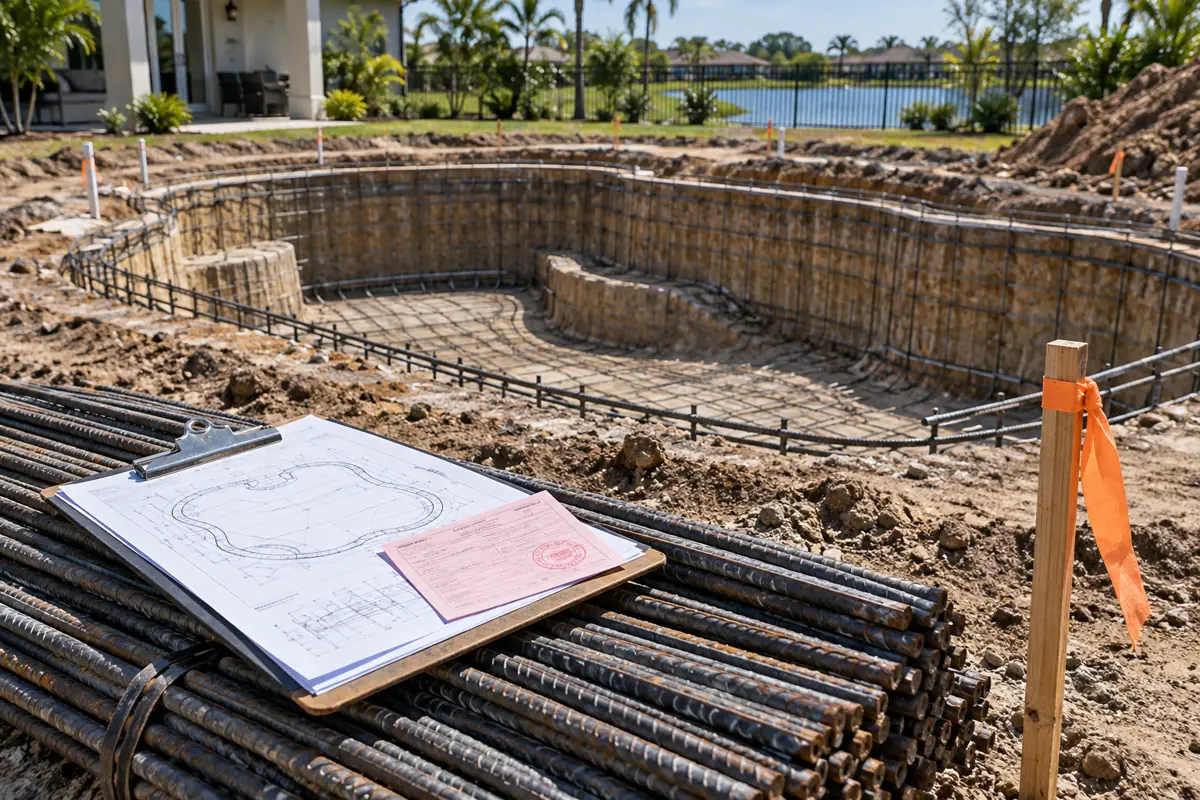
Pool construction statistics by city, 2015 to 2025
Most cities in the core sample show the same shape: a jump in 2020 or 2021, then a slide through 2024 or 2025. The nine-city total went from 4,683 permits in 2019 to 7,213 in 2021 and 3,773 in 2025.
| city | 2015 | 2016 | 2017 | 2018 | 2019 | 2020 | 2021 | 2022 | 2023 | 2024 | 2025 | jan_aug_2025 | jan_aug_2026 | group |
|---|---|---|---|---|---|---|---|---|---|---|---|---|---|---|
| Austin, TX | 409 | 390 | 407 | 463 | 527 | 857 | 1027 | 935 | 715 | 605 | 648 | 438 | 476 | core Sun Belt |
| Fort Worth, TX | 389 | 432 | 451 | 536 | 477 | 862 | 829 | 766 | 469 | 418 | 408 | 296 | 272 | core Sun Belt |
| Las Vegas, NV | 442 | 523 | 639 | 786 | 705 | 913 | 1148 | 961 | 635 | 654 | 527 | 386 | 349 | core Sun Belt |
| Los Angeles, CA | 1351 | 1482 | 1451 | 1507 | 1434 | 1198 | 2004 | 1889 | 1236 | 1121 | 1093 | 725 | 825 | core Sun Belt |
| Mesa, AZ | 460 | 550 | 620 | 766 | 728 | 899 | 894 | 528 | 384 | 348 | 329 | 234 | 207 | core Sun Belt |
| New Orleans, LA | 154 | 177 | 177 | 158 | 154 | 192 | 276 | 232 | 205 | 160 | 155 | 103 | 121 | core Sun Belt |
| Orlando, FL | 231 | 234 | 239 | 257 | 274 | 373 | 417 | 392 | 432 | 300 | 259 | 181 | 188 | core Sun Belt |
| Raleigh, NC | 48 | 45 | 94 | 133 | 106 | 96 | 90 | 122 | 81 | 92 | core Sun Belt | |||
| San Diego, CA | 280 | 291 | 334 | 398 | 339 | 421 | 485 | 455 | 316 | 239 | 232 | 149 | 157 | core Sun Belt |
| Montgomery County, MD | 47 | 39 | 56 | 56 | 68 | 91 | 111 | 102 | 114 | 95 | 111 | 76 | 59 | comparator (non Sun Belt) |
| San Antonio, TX | 710 | 595 | 479 | 401 | 346 | 245 | 175 | partial coverage | ||||||
| East Baton Rouge Parish, LA | 173 | 191 | 178 | 179 | 153 | 264 | 298 | 266 | 194 | 148 | partial coverage | |||
| Nashville-Davidson, TN | 229 | 248 | 161 | 196 | partial coverage | |||||||||
| Cape Coral, FL | 1229 | 812 | 807 | partial coverage |
Source: PC&S analysis of city permit data; dataset links in the methods table. Blank cells are years without complete coverage. Download CSV
New Orleans, Raleigh and Montgomery County, MD are in the scorecard table. Nine-city total = Austin, Fort Worth, Las Vegas, Los Angeles, Mesa, New Orleans, Orlando, Raleigh, San Diego.
Source: PC&S analysis of municipal building-permit open data (14 portals), accessed 2026-10-03. Download chart data (CSV)
Indexed to 2019 = 100, the nine-city total reached 154.0 in 2021 and fell to 80.6 in 2025. The median city index in 2025 was 85.5, meaning the typical Sun Belt city in the study issued about 14.5% fewer pool permits in 2025 than in 2019 (PC&S analysis of city permit data).
Los Angeles is the largest single market in the core sample by count, with 1,093 permits in 2025 (LA Department of Building and Safety). Austin (648), Las Vegas (527) and Fort Worth (408) follow.
The 2020 to 2022 pool boom in permit data
City permits confirm a pool boom that began in 2020 and peaked in 2021. The timing closely matches national company estimates, although permit records alone cannot show why households built pools.
The nine cities issued an average of 6,429 new pool permits a year in 2020 to 2022, against 4,645 a year in 2017 to 2019, an increase of 38.4% (PC&S analysis of city permit data).
The boom did not start smoothly everywhere. Los Angeles issued 31 pool permits in April 2020, against 158 in April 2019, and its 2020 total of 1,198 was below 2019 before 2021 reached 2,004 (LA Department of Building and Safety).
2025 national value uses 60,000 units; Pool Corp says 'just below 60,000', so the true index is slightly lower than 75.
Source: Pool Corporation Form 10-K filings 2020 to 2025 (latest estimate for each year); PC&S permit analysis. Download chart data (CSV)
| year | pool_corp_new_inground_units_estimate | pool_corp_index_2019_100 | pool_corp_source | nine_city_permits | nine_city_index_2019_100 |
|---|---|---|---|---|---|
| 2019 | about 80,000 | 100.0 | Form 10-K for 2020 (filed 2021-02-25) | 4683 | 100.0 |
| 2020 | 96,000 | 120.0 | Form 10-K for 2021 (filed 2022-02-25) | 5809 | 124.0 |
| 2021 | 117,000 | 146.2 | Form 10-K for 2022 (filed 2023-02-24) | 7213 | 154.0 |
| 2022 | about 98,000 | 122.5 | Form 10-K for 2023 (filed 2024-02-27) | 6264 | 133.8 |
| 2023 | 72,000 | 90.0 | Form 10-K for 2024 (filed 2025-02-27) | 4488 | 95.8 |
| 2024 | 62,000 | 77.5 | Form 10-K for 2025 (filed 2026-02-26) | 3935 | 84.0 |
| 2025 | just below 60,000 | 75.0 | Form 10-K for 2025 (filed 2026-02-26) | 3773 | 80.6 |
Source: Pool Corporation Form 10-K filings for fiscal 2020 to 2025 (latest estimate for each year); PC&S analysis of city permit data. Download CSV
Pool Corporation estimated about 80,000 new pools in 2019, and later filings put 2021 at 117,000 units. That is a 46.3% rise, against 54.0% in the nine-city permit total. From 2021 to 2025 the national estimate fell at least 48.7% and the nine-city total fell 47.7%.
How far new pool permits have fallen from the peak, by city
Every jurisdiction with a measurable peak issued fewer pool permits in 2025 than in its peak year. The median decline across the nine Sun Belt cities was 45.5%, but the spread runs from 8.3% in Raleigh to 63.4% in Mesa.
Peak year is the highest calendar year from 2015 to 2024 within each city's valid coverage (San Antonio from 2021).
Source: PC&S analysis of municipal building-permit open data, accessed 2026-10-03. Download chart data (CSV)
| city | permits_2019 | peak_year | peak_permits | permits_2025 | index_2025_2019_100 | change_peak_to_2025_pct | change_2019_to_2025_pct | households_acs_2020_2024 | permits_per_10k_households_2025 | jan_aug_change_2026_vs_2025_pct |
|---|---|---|---|---|---|---|---|---|---|---|
| Austin, TX | 527 | 2021 | 1027 | 648 | 123.0 | -36.9 | 23.0 | 456113 | 14.2 | 8.7 |
| Fort Worth, TX | 477 | 2020 | 862 | 408 | 85.5 | -52.7 | -14.5 | 342126 | 11.9 | -8.1 |
| Las Vegas, NV | 705 | 2021 | 1148 | 527 | 74.8 | -54.1 | -25.2 | 247741 | 21.3 | -9.6 |
| Los Angeles, CA | 1434 | 2021 | 2004 | 1093 | 76.2 | -45.5 | -23.8 | 1439097 | 7.6 | 13.8 |
| Mesa, AZ | 728 | 2020 | 899 | 329 | 45.2 | -63.4 | -54.8 | 198498 | 16.6 | -11.5 |
| New Orleans, LA | 154 | 2021 | 276 | 155 | 100.6 | -43.8 | 0.6 | 155821 | 9.9 | 17.5 |
| Orlando, FL | 274 | 2023 | 432 | 259 | 94.5 | -40.0 | -5.5 | 131179 | 19.7 | 3.9 |
| Raleigh, NC | 45 | 2021 | 133 | 122 | 271.1 | -8.3 | 171.1 | 203443 | 6.0 | 13.6 |
| San Diego, CA | 339 | 2021 | 485 | 232 | 68.4 | -52.2 | -31.6 | 530412 | 4.4 | 5.4 |
| Montgomery County, MD | 68 | 2023 | 114 | 111 | 163.2 | -2.6 | 63.2 | 389210 | 2.9 | -22.4 |
| San Antonio, TX | 2021 | 710 | 346 | -51.3 | 554581 | 6.2 | -28.6 | |||
| East Baton Rouge Parish, LA | 153 | 2021 | 298 | 177295 | ||||||
| Nashville-Davidson, TN | 248 | 313513 | 7.9 | 21.7 | ||||||
| Cape Coral, FL | 1229 | 82914 | 148.2 | -0.6 |
Source: PC&S analysis of city permit data; households from US Census Bureau ACS 2020 to 2024 5-year, table B11001. Download CSV
Arizona and Nevada show the deepest falls. Mesa issued 329 pool permits in 2025 against 899 in 2020 (City of Mesa), and Las Vegas issued 527 against 1,148 in 2021 (City of Las Vegas). Fort Worth (-52.7%) and San Diego (-52.2%) also lost more than half of their peak volume.
Measured against 2019 instead of the peak, the picture is milder. The median Sun Belt city was 14.5% below 2019 in 2025, and three of nine cities (Austin, New Orleans and Raleigh) were at or above their 2019 level (PC&S analysis of city permit data).
Pool permits in 2026 so far: January to August versus 2025
The decline paused in the aggregate in 2026, but not everywhere. The nine Sun Belt cities are +3.6% for January to August 2026, with Los Angeles, New Orleans and Nashville up and San Antonio, Mesa and Las Vegas still falling.
Source: PC&S analysis of municipal building-permit open data, accessed 2026-10-03. Download chart data (CSV)
| city | jan_aug_2025 | jan_aug_2026 | change | change_pct |
|---|---|---|---|---|
| Austin, TX | 438 | 476 | 38 | 8.7 |
| Fort Worth, TX | 296 | 272 | -24 | -8.1 |
| Las Vegas, NV | 386 | 349 | -37 | -9.6 |
| Los Angeles, CA | 725 | 825 | 100 | 13.8 |
| Mesa, AZ | 234 | 207 | -27 | -11.5 |
| New Orleans, LA | 103 | 121 | 18 | 17.5 |
| Orlando, FL | 181 | 188 | 7 | 3.9 |
| Raleigh, NC | 81 | 92 | 11 | 13.6 |
| San Diego, CA | 149 | 157 | 8 | 5.4 |
| Montgomery County, MD | 76 | 59 | -17 | -22.4 |
| San Antonio, TX | 245 | 175 | -70 | -28.6 |
| Nashville-Davidson, TN | 161 | 196 | 35 | 21.7 |
| Cape Coral, FL | 812 | 807 | -5 | -0.6 |
| Nine core Sun Belt cities combined | 2593 | 2687 | 94 | 3.6 |
| All 13 jurisdictions combined | 3887 | 3924 | 37 | 1.0 |
Source: PC&S analysis of city permit data. East Baton Rouge Parish excluded (coverage break in 2025). Download CSV
Texas cities split. Austin issued 476 permits from January to August 2026, +8.7% on 2025 (City of Austin), while San Antonio issued 175, -28.6% (City of San Antonio). The direction matches HBW metro data for the first half of 2026: Austin metro +14% and San Antonio metro -24%.
National trackers read the same way. The Pool & Hot Tub Alliance counted 5,499 pool permits over $30,000 in June 2026, 2.5% above June 2025, with the rolling 12-month total down 3.5%. Pool Corporation built its 2026 outlook on new construction units consistent with 2025, and Latham Group projected 2026 US in-ground pool starts roughly in line with 2025.
Which cities build the most pools: totals and permits per 10,000 households
By raw count, Cape Coral, Los Angeles and Austin issued the most new pool permits in 2025. Adjusted for the number of households, Cape Coral is in a category of its own, followed by Las Vegas, Orlando and Mesa.
Households include apartments, so cities with more multifamily housing score lower.
Source: PC&S analysis of municipal permit data; households from US Census Bureau ACS 2020 to 2024 5-year, table B11001. Download chart data (CSV)
Cape Coral issued 148.2 new pool permits per 10,000 households in 2025 (City of Cape Coral; ACS). Las Vegas issued 21.3, Orlando 19.7 and Mesa 16.6. Los Angeles, the largest city by count, issued 7.6 per 10,000 households, and San Diego 4.4.
The Cape Coral figure is consistent with industry data: HBW counted 2,568 new pool permits in Lee County, which contains Cape Coral, in 2025, and NAHB reports that almost one-third of US pool permits in 2025 were in Florida.
Which months pool permits are issued
In the Sun Belt, pool permits are not concentrated in spring. Pooling 36,165 permits from 2019 to 2025, no month took more than 9.1% or less than 7.2% of the year.
An even spread would be 8.3 percent per month.
Source: PC&S analysis of municipal building-permit open data, accessed 2026-10-03. Download chart data (CSV)
| month | pooled_permits | pooled_share_pct | Austin, TX | Fort Worth, TX | Las Vegas, NV | Los Angeles, CA | Mesa, AZ | New Orleans, LA | Orlando, FL | Raleigh, NC | San Diego, CA | Montgomery County, MD (comparator) |
|---|---|---|---|---|---|---|---|---|---|---|---|---|
| Jan | 2802 | 7.7 | 8.3 | 7.4 | 7.9 | 8.0 | 7.4 | 8.1 | 7.0 | 8.6 | 6.6 | 8.2 |
| Feb | 2731 | 7.6 | 7.0 | 6.8 | 8.0 | 7.4 | 7.2 | 7.1 | 8.0 | 9.6 | 9.4 | 8.2 |
| Mar | 3292 | 9.1 | 9.1 | 8.3 | 9.9 | 9.0 | 10.3 | 7.9 | 8.1 | 9.6 | 8.7 | 7.9 |
| Apr | 3007 | 8.3 | 8.0 | 8.7 | 8.4 | 8.3 | 8.5 | 9.1 | 7.4 | 9.5 | 7.9 | 9.1 |
| May | 3272 | 9.0 | 8.2 | 9.9 | 8.8 | 8.9 | 9.8 | 10.5 | 9.6 | 8.5 | 8.0 | 10.3 |
| Jun | 3162 | 8.7 | 8.6 | 9.9 | 9.0 | 8.4 | 9.3 | 9.8 | 8.3 | 7.9 | 7.3 | 7.7 |
| Jul | 3210 | 8.9 | 9.1 | 10.2 | 9.1 | 8.1 | 9.4 | 8.4 | 9.2 | 8.2 | 7.8 | 7.8 |
| Aug | 3270 | 9.0 | 8.4 | 8.7 | 9.1 | 9.1 | 9.1 | 9.4 | 9.6 | 6.4 | 10.3 | 6.5 |
| Sep | 2991 | 8.3 | 8.2 | 9.1 | 8.6 | 8.7 | 7.4 | 7.7 | 7.3 | 9.6 | 6.9 | 7.5 |
| Oct | 3188 | 8.8 | 9.7 | 8.5 | 8.3 | 8.6 | 7.6 | 8.7 | 8.9 | 9.3 | 11.3 | 11.3 |
| Nov | 2602 | 7.2 | 7.7 | 6.2 | 6.5 | 7.4 | 7.0 | 6.7 | 9.0 | 6.9 | 7.6 | 9.2 |
| Dec | 2638 | 7.3 | 7.7 | 6.3 | 6.3 | 8.0 | 7.0 | 6.7 | 7.6 | 6.0 | 8.2 | 6.2 |
Source: PC&S analysis of city permit data. Fort Worth uses application month. Download CSV
March (9.1%) and May (9.0%) are the busiest months, and November (7.2%), December (7.3%) and January (7.7%) the quietest. The busiest month is only 1.26 times the quietest. Peak months differ by city: Mesa and Las Vegas peak in March, Orlando and New Orleans in May, and Austin and San Diego in October (PC&S analysis of city permit data).
National data look more seasonal. NAHB notes that most pool permits nationally are submitted in warmer months such as May and June, a national mix that includes northern states this Sun Belt sample does not cover.
How many pools are built in the US each year: national estimates
The most cited national figure for new pools comes from Pool Corporation, which describes itself as the world’s largest wholesale distributor of swimming pool supplies and estimates new in-ground units each year from industry data.
- 2025: just below 60,000 new in-ground pools, down 3% to 5% from 62,000 in 2024 (Pool Corporation Form 10-K, fiscal 2025).
- 2023: 72,000 units (Pool Corporation Form 10-K, fiscal 2024).
- 2022: about 98,000 units (Pool Corporation Form 10-K, fiscal 2023).
- 2021: 117,000 units (Pool Corporation Form 10-K, fiscal 2022).
- 2020: 96,000 units (Pool Corporation Form 10-K, fiscal 2021).
- 2019: about 80,000 units (Pool Corporation Form 10-K, fiscal 2020).
Latham Group estimates that Florida, Texas, Arizona and California accounted for approximately two-thirds of US pool starts in 2025. The 13 jurisdictions in this study with valid 2025 data issued 5,707 new residential pool permits that year (PC&S analysis of city permit data).
This report measures new construction only. For the total number of pools in use, see the number of swimming pools in the US.
Where city pool permit counts can mislead
Permit records capture what each city approves, but cities differ in how they record pools. These are the points most likely to change a reading of the numbers.
- Cities, not metros: Las Vegas covers the City of Las Vegas only, not Henderson or unincorporated Clark County; Fort Worth and Mesa are city limits only.
- Type-only cities: Las Vegas, San Antonio and part of Fort Worth publish no work description, so spa-only permits cannot always be removed. 11,503 of the 65,037 counted permits rely on permit type alone.
- A permit is not a finished pool: some permitted pools are never built, and Fort Worth is dated by application, not issuance.
- Replacement pools are excluded where the text says an existing pool is demolished, so counts slightly understate total pool-building work.
- Small samples: Raleigh, New Orleans and Montgomery County issue a few hundred or fewer pool permits a year, so single-year percentages swing widely.
Many permit descriptions in this dataset list safety items such as a required enclosure device or pool alarm (Austin descriptions often read “w/ reqd enclosure device”). For safety outcomes see pool drowning statistics by state.
Measures we built from the data
Pool Permit Index (2019 = 100)
Where is each city now relative to the last pre-pandemic year?
Index = permits in year / permits in 2019 x 100Inputs: fact rows #5, #11, #18, #24, #31, #37, #44, #50, #57, #63, #70, #76, #83, #89, #93, #99, #106, #112, #296, #300
Limitations: Cities with small 2019 counts (Raleigh, Montgomery County) produce large index values from small changes.
Peak-to-2025 decline
How much of the boom has unwound in each city?
Change = (permits 2025 - permits in peak year) / permits in peak year x 100, peak = highest year 2015 to 2024Inputs: fact rows #228, #233, #238, #243, #248, #253, #258, #263, #268, #307, #273
Limitations: Peak years differ (2020, 2021 or 2023), so declines cover different spans.
Pool permits per 10,000 households
Which markets build the most pools relative to their size?
Rate = permits 2025 / ACS 2020 to 2024 households x 10,000Inputs: fact rows #229, #234, #239, #244, #249, #254, #259, #264, #269, #274, #277, #279, #281, #163, #157, #159, #158, #164
Limitations: Denominator includes apartment households; ACS is a five-year average.
Seasonality of pool permits
In which months are pool permits issued?
Share = permits issued in month / all permits 2019 to 2025 x 100, pooled across nine Sun Belt citiesInputs: fact rows #166, #167, #168, #169, #170, #171, #172, #173, #174, #175, #176, #177, #333, #349
Limitations: Large cities (Los Angeles) weigh more in the pooled share; issue month is not construction month.
Permit data vs national estimate
Do city permits track the national new-pool estimate?
Both series indexed to 2019 = 100Inputs: fact rows #195, #193, #186, #337, #336, #296, #300
Limitations: The national series is a company estimate; the city sample over-represents the Southwest and California.
Latest data in this edition
- This report adds January to August 2026 permits for 13 jurisdictions: the nine Sun Belt core cities are +3.6% year to date, and all 13 combined are +1.0%.
- The Pool & Hot Tub Alliance reported 5,499 national pool permits for June 2026, up 2.5% from June 2025, while the rolling 12-month total was down 3.5%.
- Latham Group reported second-quarter 2026 in-ground pool sales up 22.5% (13.6% organically), a company sales figure rather than a market count.
- HBW reported 2,916 new pool permits in Texas for the first half of 2026, down 11% from the first half of 2025.
- Pool Corporation reported building-materials sales, used mainly in new construction and remodeling, up about 5% in the first half of 2026.
- Latham Group estimated that the US in-ground pool market declined by a low- to mid-single-digit rate in 2025 and projected 2026 starts roughly in line with 2025.
- Pool Corporation estimated 2025 US new in-ground pool construction at just below 60,000 units and assumed consistent new construction units in 2026.
- NAHB reported that December 2025 pool permits were the lowest in its Pool Construction Permit Index series.
Quick answers
How many pools are built each year in the US?
Pool Corporation estimates that just below 60,000 new in-ground pools were built in the United States in 2025, down from 62,000 in 2024 and 117,000 in 2021 (Pool Corporation Form 10-K). The 13 jurisdictions in this study with full 2025 data issued 5,707 new residential pool permits in 2025.
Is pool construction slowing down?
It slowed sharply from 2022 to 2025 and has levelled off in 2026. Nine Sun Belt cities issued 47.7% fewer pool permits in 2025 than in 2021, but January to August 2026 was +3.6% on the same months of 2025 (PC&S analysis of city permit data). The Pool & Hot Tub Alliance reported June 2026 national permits up 2.5% year on year.
What is the best month to build a pool?
Permit data cannot say which month is cheapest, but they show when approvals are least crowded. In nine Sun Belt cities, November (7.2%) and December (7.3%) had the smallest shares of 2019 to 2025 pool permits, and March (9.1%) the largest (PC&S analysis of city permit data). This is data, not advice.
Which cities build the most pools?
Among the 13 jurisdictions with 2025 data, Cape Coral, Florida issued the most new pool permits (1,229), followed by Los Angeles (1,093) and Austin (648). Per 10,000 households, Cape Coral (148.2) and Las Vegas (21.3) lead (PC&S analysis of city permit data). At state level, NAHB reports almost one-third of 2025 US pool permits were in Florida.
Did the pandemic cause a pool boom?
Permit data show a boom that coincides with the pandemic years: nine Sun Belt cities issued 38.4% more pool permits a year in 2020 to 2022 than in 2017 to 2019, and 2021 was 54.0% above 2019 (PC&S analysis of city permit data). Pool Corporation estimates national units rose from about 80,000 in 2019 to 117,000 in 2021. The records show timing, not the reasons households built pools.
Questions and answers
How many new pool permits did Austin issue in 2025?
Austin issued 648 building permits for new residential in-ground pools in 2025, 23.0% more than in 2019 (City of Austin).
How many pool permits does Los Angeles issue a year?
Los Angeles issued 1,093 new pool permits for one- and two-family homes in 2025 and 2,004 at the 2021 peak (LA Department of Building and Safety).
Which year had the most new pool permits?
2021. The nine Sun Belt cities in this study issued 7,213 new residential pool permits that year, the highest total from 2015 to 2025 (PC&S analysis of city permit data).
How much has pool construction fallen since 2021?
The nine-city permit total fell 47.7% from 2021 to 2025. Pool Corporation’s national estimate fell from 117,000 to just below 60,000 units (Pool Corporation).
Are pool permits up or down in 2026?
Slightly up in aggregate. Nine Sun Belt cities issued 2,687 pool permits from January to August 2026, 3.6% more than the same months of 2025 (PC&S analysis of city permit data).
Which city in the study had the largest decline in pool permits?
Mesa, Arizona. Its new pool permits fell from 899 in 2020 to 329 in 2025, a 63.4% decline (City of Mesa).
What share of US new pools are built in Florida, Texas, Arizona and California?
Approximately two-thirds of US pool starts in 2025, according to Latham Group. NAHB puts Florida alone at almost one-third of 2025 pool permits and California at 14%.
How many pool permits were issued nationally in June 2026?
The Pool & Hot Tub Alliance counted 5,499 pool permits nationally in June 2026, up 2.5% from 5,364 in June 2025, counting only permits over $30,000.
Do pool permits peak in spring?
Not in the Sun Belt. Across nine Sun Belt cities, the busiest month (March) took 9.1% of 2019 to 2025 pool permits and the quietest (November) 7.2% (PC&S analysis of city permit data). Nationally, NAHB reports most permits in May and June.
Can I download the pool permit data?
Yes. All six tables are downloadable as CSV under CC BY 4.0, including annual counts for 14 jurisdictions built from 65,037 new pool permits identified from 2015 to August 2026 (PC&S analysis of city permit data).
Data, citation and press kit
Figures ready to quote
- Nine US Sun Belt cities issued 3,773 new residential pool permits in 2025, 47.7% fewer than at the 2021 peak. (Pool Construction & Service (PC&S Research Desk))
- The median Sun Belt city in the study issued 45.5% fewer new pool permits in 2025 than in its peak year. (Pool Construction & Service (PC&S Research Desk))
- Mesa, Arizona issued 329 new pool permits in 2025, down 63.4% from 899 in 2020. (City of Mesa)
- Cape Coral, Florida issued 148.2 new pool permits per 10,000 households in 2025, about seven times the Las Vegas rate. (City of Cape Coral)
- From January to August 2026, nine Sun Belt cities issued 3.6% more pool permits than in the same months of 2025. (Pool Construction & Service (PC&S Research Desk))
- Pool Corporation estimates just below 60,000 new in-ground pools were built in the United States in 2025, down from 117,000 in 2021. (Pool Corporation)
- In the Sun Belt, no calendar month accounted for more than 9.1% of new pool permits from 2019 to 2025. (Pool Construction & Service (PC&S Research Desk))
If you cite only a few sources
- New residential pool permits by city and year, compiled from references r1 to r15 (CSV), Pool Construction & Service (PC&S Research Desk)
- Building and Safety: Building Permits Issued from 2020 to Present (pi9x-tg5x), City of Los Angeles, Department of Building and Safety
- Issued Construction Permits (3syk-w9eu), City of Austin
- Building Permits (OpenData_Building_Permits_), City of Las Vegas
- Building Permits (dzpk-hxfb), City of Mesa
- Form 10-K for fiscal year 2025, Pool Corporation
- Pool Permitting Falls Lower in 2025 (Eye on Housing), National Association of Home Builders
Summary for editors
Pool construction in major US Sun Belt cities has fallen by close to half from its pandemic-era peak, according to a new analysis of municipal building-permit records by the PC&S Research Desk. Nine cities, including Los Angeles, Austin, Las Vegas, Fort Worth and Mesa, issued 3,773 permits for new residential in-ground pools in 2025, down 47.7% from 7,213 in 2021 and 19.4% below 2019. The median city was 45.5% below its own peak. Mesa fell furthest, by 63.4%, while Austin remained 23.0% above its 2019 level. The decline paused in 2026: from January to August, permits in the nine cities were 3.6% higher than a year earlier, though Mesa, Las Vegas and Fort Worth, and San Antonio outside the core group, were still down. The city data track Pool Corporation’s national estimate, which fell from 117,000 new pools in 2021 to just below 60,000 in 2025. The dataset covers 14 jurisdictions and 65,037 identified new pool permits from 2015 to August 2026.
Headlines the data supports
- Sun Belt pool permits fell 47.7% from the 2021 peak, city records show
- Mesa, Arizona pool permits down 63.4% from their 2020 peak
- Pool construction steadies in 2026: Sun Belt permits up 3.6% through August
- Cape Coral issues new pool permits at about seven times the Las Vegas rate per household
- Austin pool permits stay 23.0% above 2019 while most Sun Belt cities fall short
How to cite this report
Pool Construction & Service. "Pool Construction Statistics: New Pool Permits in 14 US Markets, 2015 to 2026." PC&S Research Desk, October 3, 2026. https://poolconstructionandservice.com/research/pool-construction-statistics/
Reuse
The data tables and charts in this report are licensed under CC BY 4.0. Reuse them with this attribution: “Source: Pool Construction & Service (poolconstructionandservice.com), Pool Construction Statistics: New Pool Permits in 14 US Markets, 2015 to 2026.” Figures from third-party sources remain subject to their publishers’ terms.
Download the data
- New residential pool permits by city and year, 14 US jurisdictions, 2015 to August 2026 CSV
- Pool permit scorecard: peak, 2025, index, per-household rate and 2026 change CSV
- Pool permits January to August 2026 vs 2025, 13 jurisdictions CSV
- Monthly share of pool permits, 2019 to 2025 CSV
- Pool Corporation national estimates vs nine-city permits, 2019 to 2025 CSV
- Dataset, filters and known issues for each city CSV
- Pool Permit Index (2019 = 100), 2019 to 2025 CSV
- Full fact sheet with sources and limitations CSV
How we graded sources
Tier 1: primary and government sources (17)
- City of Austin: Issued Construction Permits (3syk-w9eu)
- City of Los Angeles, Department of Building and Safety: Building and Safety: Building Permits Issued from 2020 to Present (pi9x-tg5x)
- City of Los Angeles, Department of Building and Safety: Building and Safety: Building Permits Issued Between 2010 and 2019 (dyxf-7hc4)
- City of San Diego, Development Services Department: Approvals for development projects
- City of Orlando: Permit Applications (ryhf-m453)
- City of Mesa: Building Permits (dzpk-hxfb)
- City of Las Vegas: Building Permits (OpenData_Building_Permits_)
- City of Fort Worth: CFW Open Data Development Permits
- City of San Antonio: Building Permits: Permits Issued
- City of New Orleans: Permits (rcm3-fn58)
- City of Baton Rouge / Parish of East Baton Rouge: EBR Building Permits (7fq7-8j7r)
- City of Raleigh: Building Permits
- Montgomery County, Maryland: Residential Permit (m88u-pqki)
- Metropolitan Government of Nashville and Davidson County: Building Permits Issued
- City of Cape Coral: Building Permits (OpenData layer 1)
- US Census Bureau: American Community Survey 2020-2024 5-Year Estimates, Table B11001 Household Type
- Pool Construction & Service (PC&S Research Desk): New residential pool permits by city and year, compiled from references r1 to r15 (CSV)
Tier 2: trade bodies, public companies, market research (15)
- Pool Corporation: Form 10-K for fiscal year 2025
- Pool Corporation: Form 10-K for fiscal year 2024
- Pool Corporation: Form 10-K for fiscal year 2023
- Pool Corporation: Form 10-K for fiscal year 2022
- Pool Corporation: Form 10-K for fiscal year 2021
- Pool Corporation: Form 10-K for fiscal year 2020
- Pool Corporation: Form 10-K for fiscal year 2019
- Pool Corporation: Form 10-Q for the quarter ended June 30, 2026
- Latham Group, Inc.: Fourth quarter and full year 2025 results (Form 8-K Exhibit 99)
- Latham Group, Inc.: Form 10-K for fiscal year 2025
- Latham Group, Inc.: Second quarter 2026 results (Form 8-K Exhibit 99)
- National Association of Home Builders: Pool Permitting Falls Lower in 2025 (Eye on Housing)
- Pool & Hot Tub Alliance: Market Intelligence Report: Pool Permit Activity Improves in June
- HBW, Inc.: Texas Swimming Pool Construction: Mid-Year Market Review
- HBW, Inc.: Florida Swimming Pool Construction Activity: 2025 Market Review
Sources
- City of Austin. Issued Construction Permits (3syk-w9eu). Accessed 2026-10-03.
- City of Los Angeles, Department of Building and Safety. Building and Safety: Building Permits Issued from 2020 to Present (pi9x-tg5x). Accessed 2026-10-03.
- City of Los Angeles, Department of Building and Safety. Building and Safety: Building Permits Issued Between 2010 and 2019 (dyxf-7hc4). Accessed 2026-10-03.
- City of San Diego, Development Services Department. Approvals for development projects. Accessed 2026-10-03.
- City of Orlando. Permit Applications (ryhf-m453). Accessed 2026-10-03.
- City of Mesa. Building Permits (dzpk-hxfb). Accessed 2026-10-03.
- City of Las Vegas. Building Permits (OpenData_Building_Permits_). Accessed 2026-10-03.
- City of Fort Worth. CFW Open Data Development Permits. Accessed 2026-10-03.
- City of San Antonio. Building Permits: Permits Issued. Accessed 2026-10-03.
- City of New Orleans. Permits (rcm3-fn58). Accessed 2026-10-03.
- City of Baton Rouge / Parish of East Baton Rouge. EBR Building Permits (7fq7-8j7r). Accessed 2026-10-03.
- City of Raleigh. Building Permits. Accessed 2026-10-03.
- Montgomery County, Maryland. Residential Permit (m88u-pqki). Accessed 2026-10-03.
- Metropolitan Government of Nashville and Davidson County. Building Permits Issued. Accessed 2026-10-03.
- City of Cape Coral. Building Permits (OpenData layer 1). Accessed 2026-10-03.
- US Census Bureau. American Community Survey 2020-2024 5-Year Estimates, Table B11001 Household Type. Accessed 2026-10-03.
- Pool Corporation. Form 10-K for fiscal year 2025. Accessed 2026-10-03.
- Pool Corporation. Form 10-K for fiscal year 2024. Accessed 2026-10-03.
- Pool Corporation. Form 10-K for fiscal year 2023. Accessed 2026-10-03.
- Pool Corporation. Form 10-K for fiscal year 2022. Accessed 2026-10-03.
- Pool Corporation. Form 10-K for fiscal year 2021. Accessed 2026-10-03.
- Pool Corporation. Form 10-K for fiscal year 2020. Accessed 2026-10-03.
- Pool Corporation. Form 10-K for fiscal year 2019. Accessed 2026-10-03.
- Pool Corporation. Form 10-Q for the quarter ended June 30, 2026. Accessed 2026-10-03.
- Latham Group, Inc.. Fourth quarter and full year 2025 results (Form 8-K Exhibit 99). Accessed 2026-10-03.
- Latham Group, Inc.. Form 10-K for fiscal year 2025. Accessed 2026-10-03.
- Latham Group, Inc.. Second quarter 2026 results (Form 8-K Exhibit 99). Accessed 2026-10-03.
- National Association of Home Builders. Pool Permitting Falls Lower in 2025 (Eye on Housing). Accessed 2026-10-03.
- Pool & Hot Tub Alliance. Market Intelligence Report: Pool Permit Activity Improves in June. Accessed 2026-10-03.
- HBW, Inc.. Texas Swimming Pool Construction: Mid-Year Market Review. Accessed 2026-10-03.
- HBW, Inc.. Florida Swimming Pool Construction Activity: 2025 Market Review. Accessed 2026-10-03.
- Pool Construction & Service (PC&S Research Desk). New residential pool permits by city and year, compiled from references r1 to r15 (CSV). Accessed 2026-10-03.
Related pool research
Number of Swimming Pools in the US: Published Estimates Reconciled
Pool Permit Processing Time: Days From Application to Issue in 12 US Cities, 2019 to 2026
Pool Removal Statistics: Permit Counts for US Cities, 2015 to 2026
Percentage of Homes With Pools by Metro and State: Backyard Pool Prevalence Index
How Many Homes Have a Hot Tub? US State Atlas of Hot Tub and Spa Ownership, 2024
Pool Industry Market Size: US Revenue Estimates Reconciled, 2017 to 2026
All pool industry research (40 reports)