Pool Injury Statistics: U.S. Emergency Room Visits by Product, Age and Month, 2015 to 2024
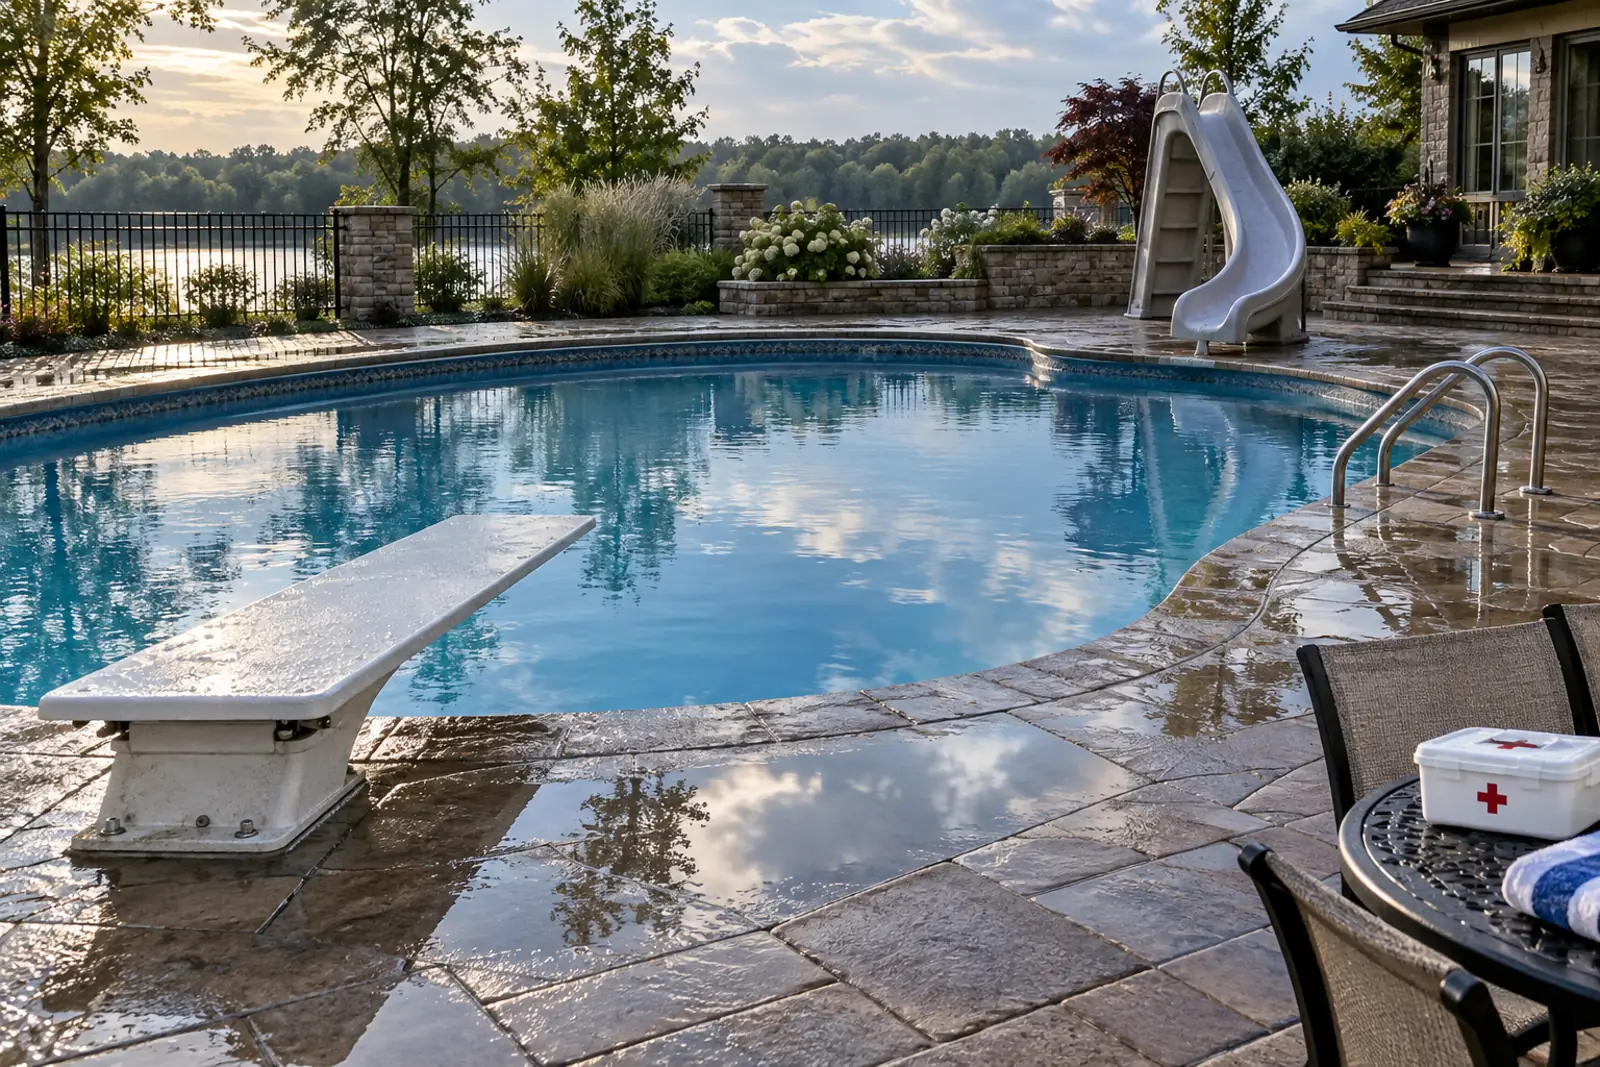
Pool injury statistics from CPSC's NEISS sample show an estimated 90,300 people were treated in U.S. hospital emergency departments in 2024 for nonfatal, non-drowning injuries involving swimming pools, pool equipment, diving boards, pool slides or pool chemicals. Children aged 5 to 9 had the highest rate, and 63.0% of 2015 to 2024 injuries were treated in June, July or August.
At a glance
- U.S. emergency departments treated an estimated 90,300 nonfatal pool injuries in 2024, with a 95% confidence interval of 65,800 to 114,900 (CPSC NEISS microdata, PC&S analysis).
- Swimming pools themselves were involved in 80,400 of those 2024 injuries, diving or diving boards in 6,800, pool equipment in 6,200, pool chemicals in 4,700 and pool slides in 1,700 (CPSC NEISS microdata, PC&S analysis).
- Children aged 5 to 9 had the highest U.S. pool injury rate in 2024, at 93.0 per 100,000, which is 3.5 times the all-ages rate of 26.6 (CPSC NEISS microdata, PC&S analysis; Census Bureau Vintage 2025).
- June, July and August accounted for 63.0% of U.S. pool injuries treated from 2015 to 2024, against 26.8% of all consumer product injuries in 2024 (CPSC NEISS microdata, PC&S analysis).
- Only 5.3% of U.S. pool injuries in 2024 led to hospital admission or transfer, less than half the 12.3% share for all consumer product injuries (CPSC NEISS microdata, PC&S analysis).
- Diving injuries had the highest share admitted or transferred of the five pool product families from 2015 to 2024, at 7.6% (CPSC NEISS microdata, PC&S analysis).
- The U.S. pool injury estimate moved from 107,000 in 2015 to 90,300 in 2024, 15.6% lower, although the 95% confidence intervals for the two years overlap (CPSC NEISS microdata, PC&S analysis).
What counts as a pool injury in this report
This report counts emergency department visits in which a NEISS coder recorded a swimming pool, pool equipment, diving or diving board, pool slide or pool chemical product code. Fatal cases and drowning-type diagnoses are taken out, so the figures describe nonfatal, non-drowning injuries.
The National Electronic Injury Surveillance System (NEISS) collects emergency department records from a probability sample of about 100 U.S. hospitals grouped into 5 strata (CPSC NEISS FAQ). The current sample was drawn from a 2020 frame of 4,723 eligible hospital emergency departments (CPSC sample design statement). Each case carries a statistical weight, and summing the weights gives a national estimate (CPSC NEISS Data Highlights 2024).
- Swimming pools: product codes 1284 (not specified), 3221 (above-ground), 3251 (built-in) and 5043 (portable) (NEISS Coding Manual 2025).
- Pool equipment: code 3262, which excludes chemicals, diving boards and pool slides (NEISS Coding Manual 2025).
- Diving or diving boards: code 1278, which covers diving in any setting, not only pools (NEISS Coding Manual 2025).
- Pool slides: code 1277 (NEISS Coding Manual 2025).
- Pool chemicals: code 0938 (NEISS Coding Manual 2025).
- All U.S. emergency department visits linked to a pool product family, 2024: 98,100 (CPSC NEISS microdata, PC&S analysis).
- Minus fatal cases (dead on arrival or died in the emergency department), 2024: 400, an unstable estimate shown only to define scope (CPSC NEISS microdata, PC&S analysis).
- Minus nonfatal submersion-type visits, 2024: 7,400 (CPSC NEISS microdata, PC&S analysis).
- Equals nonfatal pool injuries, the scope of this report, 2024: 90,300 (CPSC NEISS microdata, PC&S analysis).
Pool injury statistics by product family, 2024
Swimming pools are named in most 2024 cases, usually without the pool type. Diving, equipment, chemical and slide injuries are smaller but have distinct injury patterns and age profiles.
| Product family | ED-treated injuries 2024 | 95% CI low | 95% CI high | Sample cases | CV | Under age 15 (%) | Male (%) | Stability flag |
|---|---|---|---|---|---|---|---|---|
| Swimming pools (all types) | 80400 | 56700 | 104200 | 2125 | 0.151 | 47.5 | 51.2 | |
| Pool equipment (ladders, filters, pumps, etc.) | 6200 | 4100 | 8200 | 143 | 0.168 | 28.9 | 49.9 | |
| Diving or diving boards | 6800 | 4800 | 8800 | 181 | 0.147 | 31.9 | 72.9 | |
| Pool slides | 1700 | 900 | 2500 | 42 | 0.233 | 79.7 | 47.9 | |
| Pool chemicals | 4700 | 3100 | 6400 | 111 | 0.18 | 41.0 | 45.7 | |
| All pool product families | 90300 | 65800 | 114900 | 2362 | 0.139 | 45.8 | 52.2 |
Source: CPSC NEISS microdata, PC&S analysis. Estimates rounded to the nearest 100. CV is a PC&S approximation of sampling error. Download CSV
The swimming pool family covered 89.0% of U.S. pool injuries in 2024 (CPSC NEISS microdata, PC&S analysis). Most of those records did not state the pool type: 60,800 were coded as pool type not specified, against 16,100 built-in pools, 1,800 above-ground pools and 1,700 portable pools (CPSC NEISS microdata, PC&S analysis).
Ten-year trend in U.S. pool injuries, 2015 to 2024
Annual estimates ranged from 71,300 in 2020 to 108,600 in 2016. All ten annual 95% confidence intervals overlap, and a change of hospital sample in 2024 limits comparisons across that year.
2024 uses a new NEISS hospital sample. Year-to-year changes are within sampling error.
Source: CPSC NEISS microdata, PC&S analysis. Download chart data (CSV)
The U.S. estimate was 107,000 in 2015 and 90,300 in 2024, 15.6% lower (CPSC NEISS microdata, PC&S analysis). Averaging three years at each end gives 105,600 a year for 2015 to 2017 and 88,500 a year for 2022 to 2024, a decline of 16.1% (CPSC NEISS microdata, PC&S analysis). Adjusted for population growth, the rate fell from 33.4 to 26.6 per 100,000 residents, a decline of 20.4% (CPSC NEISS microdata, PC&S analysis; Census Bureau Vintage 2025).
| Year | All pool product families | 95% CI low | 95% CI high | CV | Rate per 100,000 residents | Swimming pools | Pool equipment | Diving or diving boards | Pool slides | Pool chemicals | Estimates failing CPSC stability rule |
|---|---|---|---|---|---|---|---|---|---|---|---|
| 2015 | 107000 | 69000 | 145100 | 0.181 | 33.4 | 93600 | 6000 | 9200 | 1500 | 5100 | |
| 2016 | 108600 | 68200 | 148900 | 0.19 | 33.6 | 98500 | 5100 | 9600 | 1400 | 3700 | |
| 2017 | 101000 | 65000 | 137000 | 0.182 | 31.1 | 91000 | 4400 | 8500 | 1600 | 4400 | |
| 2018 | 95900 | 56700 | 135100 | 0.209 | 29.3 | 85300 | 5900 | 8300 | 900 | 4100 | Pool slides |
| 2019 | 103100 | 57200 | 149000 | 0.227 | 31.4 | 94400 | 4900 | 9000 | 1200 | 4300 | |
| 2020 | 71300 | 34600 | 108100 | 0.263 | 21.5 | 65000 | 4900 | 5300 | 800 | 3100 | Pool slides |
| 2021 | 80600 | 41600 | 119600 | 0.247 | 24.3 | 74600 | 4700 | 4600 | 1000 | 3300 | Pool slides |
| 2022 | 94900 | 47800 | 142000 | 0.253 | 28.4 | 86700 | 5900 | 7400 | 1100 | 4100 | Pool slides |
| 2023 | 80400 | 46700 | 114100 | 0.214 | 23.9 | 72400 | 4400 | 6800 | 1000 | 3800 | Pool slides |
| 2024 | 90300 | 65800 | 114900 | 0.139 | 26.6 | 80400 | 6200 | 6800 | 1700 | 4700 |
Source: CPSC NEISS microdata, PC&S analysis; population from Census Bureau Vintage 2020 and Census Bureau Vintage 2025. Download CSV
Some pool slide years fail the CPSC stability rule; see the table.
Source: CPSC NEISS microdata, PC&S analysis. Download chart data (CSV)
The 2020 low of 71,300 was 30.8% below the 2019 estimate. It coincides with the first year of the COVID-19 pandemic, when the NEISS estimate for all consumer product injuries also fell 18.3% (CPSC NEISS microdata, PC&S analysis). The pool injury estimate was back at 94,900 in 2022 (CPSC NEISS microdata, PC&S analysis).
Who gets hurt: pool injury rates by age and sex, 2024
School-age children carry the highest pool injury rates. Once drownings are excluded, the rate for children aged 5 to 9 is 1.9 times the rate for children under 5, and adults 25 and older have the lowest rates.
Source: CPSC NEISS microdata and U.S. Census Bureau Vintage 2025, PC&S calculation. Download chart data (CSV)
| Age group | ED-treated injuries 2024 | Sample cases | CV | Resident population July 1 2024 | Injuries per 100,000 | Share of injuries (%) | Stability flag |
|---|---|---|---|---|---|---|---|
| 0-4 | 8900 | 293 | 0.31 | 18584735 | 48.0 | 9.9 | |
| 5-9 | 18600 | 594 | 0.193 | 19978615 | 93.0 | 20.6 | |
| 10-14 | 13900 | 455 | 0.149 | 20692272 | 67.0 | 15.3 | |
| 15-24 | 13700 | 322 | 0.136 | 45388450 | 30.2 | 15.2 | |
| 25-44 | 13000 | 277 | 0.134 | 90945499 | 14.3 | 14.3 | |
| 45-64 | 13000 | 250 | 0.158 | 81601645 | 15.9 | 14.4 | |
| 65+ | 9200 | 170 | 0.203 | 62812581 | 14.6 | 10.2 | |
| All ages, male | 47200 | 1256 | 0.15 | 166868649 | 28.3 | 52.2 | |
| All ages, female | 43100 | 1104 | 0.131 | 173135148 | 24.9 | 47.7 | |
| All ages, both sexes | 90300 | 2362 | 0.139 | 340003797 | 26.6 | 100.0 |
Source: CPSC NEISS microdata, PC&S analysis; population: Census Bureau Vintage 2025. Download CSV
Children aged 5 to 9 had 18,600 U.S. pool injuries in 2024, a rate of 93.0 per 100,000 (CPSC NEISS microdata, PC&S analysis; Census Bureau Vintage 2025). Children aged 10 to 14 followed at 67.0 per 100,000, and children under 5 at 48.0 per 100,000 (CPSC NEISS microdata, PC&S analysis; Census Bureau Vintage 2025). Adults aged 25 to 44 had a rate of 14.3 per 100,000, and adults 65 and older 14.6 per 100,000 (CPSC NEISS microdata, PC&S analysis; Census Bureau Vintage 2025).
When pool injuries happen: monthly seasonality, 2015 to 2024
Pool injuries are concentrated in the summer far more than consumer product injuries in general. July has a seasonality index of 324, where 100 is an average month, and December has an index of 24.
Source: CPSC NEISS microdata, PC&S analysis. Download chart data (CSV)
| Month | Injuries 2024 | Share 2024 (%) | Seasonality index 2024 | Share 2015 to 2024 (%) | Seasonality index 2015 to 2024 | Stability flag |
|---|---|---|---|---|---|---|
| Jan | 1800 | 2.0 | 24 | 2.1 | 25 | |
| Feb | 2100 | 2.3 | 27 | 2.4 | 29 | unstable (CPSC rule) |
| Mar | 3200 | 3.6 | 43 | 3.6 | 43 | |
| Apr | 4500 | 5.0 | 60 | 5.3 | 63 | |
| May | 8300 | 9.2 | 110 | 9.5 | 114 | |
| Jun | 22600 | 25.1 | 301 | 20.9 | 251 | |
| Jul | 22600 | 25.1 | 301 | 27.0 | 324 | |
| Aug | 12800 | 14.2 | 170 | 15.1 | 181 | |
| Sep | 5400 | 6.0 | 72 | 6.4 | 77 | |
| Oct | 3100 | 3.4 | 41 | 3.4 | 41 | |
| Nov | 2200 | 2.5 | 30 | 2.2 | 27 | |
| Dec | 1600 | 1.8 | 22 | 2.0 | 24 |
Source: CPSC NEISS microdata, PC&S analysis. Index: monthly share x 12 x 100, so 100 equals an average month. Download CSV
From 2015 to 2024, June, July and August accounted for 63.0% of U.S. pool injuries, and May through September for 78.9% (CPSC NEISS microdata, PC&S analysis). In 2024 the summer share was 64.4%, which is 2.4 times the 26.8% summer share for all consumer product injuries (CPSC NEISS microdata, PC&S analysis). The seasonality index peaks at 324 in July and bottoms out at 24 in December (CPSC NEISS microdata, PC&S analysis).
How people get hurt: diagnoses, body parts and narrative patterns, 2024
Head and face injuries, lacerations and fractures dominate the trauma side of the profile. A sizeable share of visits are not trauma at all: ear complaints, eye irritation and chemical exposures make up part of the total.
Source: CPSC NEISS microdata, PC&S analysis. Download chart data (CSV)
| Dimension | Category | Injuries 2024 | Share (%) | Sample cases | Stability flag |
|---|---|---|---|---|---|
| Diagnosis | Other or not stated | 27000 | 29.9 | 739 | |
| Diagnosis | Laceration | 15400 | 17.1 | 389 | |
| Diagnosis | Fracture | 8800 | 9.8 | 210 | |
| Diagnosis | Internal organ injury | 8400 | 9.3 | 254 | |
| Diagnosis | Contusion or abrasion | 7700 | 8.5 | 180 | |
| Diagnosis | Strain or sprain | 7300 | 8.1 | 159 | |
| Diagnosis | Dermatitis or conjunctivitis | 5100 | 5.7 | 132 | |
| Diagnosis | Concussion | 2100 | 2.3 | 63 | |
| Body part | Head | 15100 | 16.7 | 425 | |
| Body part | Ear | 10900 | 12.0 | 320 | |
| Body part | Face | 10600 | 11.8 | 261 | |
| Body part | Foot | 4800 | 5.3 | 125 | |
| Body part | Lower trunk | 4800 | 5.3 | 118 | |
| Body part | All parts of body | 4300 | 4.7 | 111 | |
| Body part | Knee | 4000 | 4.4 | 101 | |
| Body part | Upper trunk | 3900 | 4.4 | 96 |
The head was the injured body part in 16.7% of U.S. pool injuries in 2024, the face in 11.8% and the ear in 12.0% (CPSC NEISS microdata, PC&S analysis). Internal head injuries, the NEISS code used for closed head injuries (NEISS Coding Manual 2025), made up 8.8% of cases, and concussions 2.3% (CPSC NEISS microdata, PC&S analysis).
The largest diagnosis group in 2024 was ‘other or not stated’ at 29.9% (CPSC NEISS microdata, PC&S analysis). Narrative keywords show that much of this group is ear-related: about 11.8% of all 2024 pool injury visits, roughly 10,700, described ear pain, ear infection or swimmer’s ear (CPSC NEISS microdata, PC&S analysis).
| Product family | Average annual injuries 2022 to 2024 | Sample cases 2022 to 2024 | Top diagnosis | Top diagnosis (%) | Second diagnosis | Second diagnosis (%) | Top body part | Top body part (%) | Under age 15 (%) | Male (%) | Narrative mentions dove or diving (%) | Narrative mentions slipped (%) | Narrative mentions jumped (%) | Narrative mentions ladder or steps (%) | Narrative mentions chlorine (%) | Admitted or transferred 2015 to 2024 (%) | Admitted 95% CI low (%) | Admitted 95% CI high (%) |
|---|---|---|---|---|---|---|---|---|---|---|---|---|---|---|---|---|---|---|
| Swimming pools (all types) | 79800 | 6095 | Other or not stated | 31.4 | Laceration | 16.6 | Head | 16.4 | 49.1 | 51.1 | 5.7 | 10.1 | 13.8 | 4.8 | 2.4 | 5.2 | 4.4 | 6.1 |
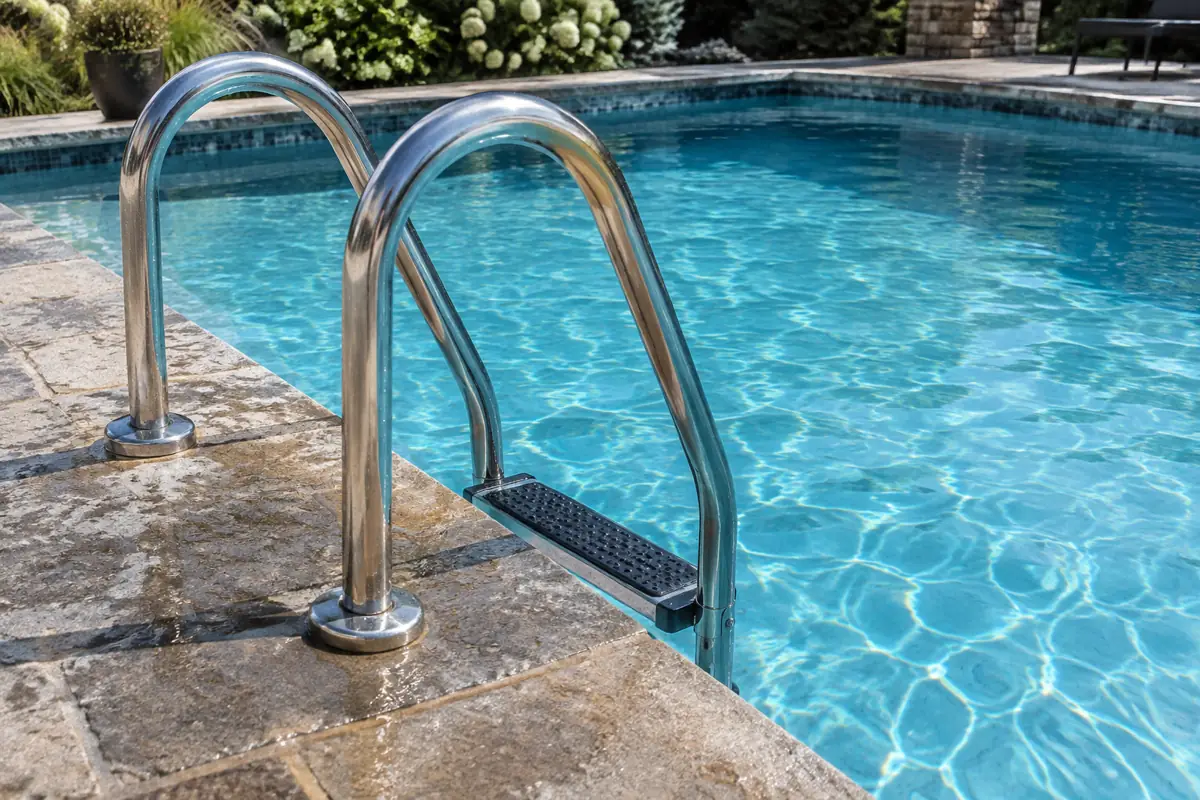
| Pool equipment (ladders, filters, pumps, etc.) | 5500 | 386 | Fracture | 23.1 | Laceration | 21.8 | Head | 14.4 | 36.2 | 50.9 | 0.7 | 13.5 | 4.1 | 52.7 | 0.7 | 6.6 | 4.7 | 8.5 |
| Diving or diving boards | 7000 | 541 | Internal organ injury | 19.7 | Other or not stated | 19.4 | Head | 32.5 | 30.4 | 70.1 | 96.8 | 7.0 | 21.9 | 0.8 | 0.0 | 7.6 | 5.7 | 9.5 |
| Pool slides | 1300 | 103 | Laceration | 21.9 | Internal organ injury | 18.5 | Head | 32.7 | 77.6 | 45.1 | 0.0 | 5.5 | 2.3 | 7.1 | 0.0 | 4.6 | 1.8 | 7.4 |
| Pool chemicals | 4200 | 307 | Poisoning | 33.4 | Dermatitis or conjunctivitis | 28.4 | All parts of body | 42.4 | 43.3 | 56.2 | 0.1 | 0.1 | 0.9 | 0.0 | 65.7 | 5.3 | 3.5 | 7.1 |
| All pool product families | 88500 | 6739 | Other or not stated | 30.1 | Laceration | 16.4 | Head | 16.5 | 47.5 | 52.3 | 9.3 | 9.9 | 13.7 | 5.6 | 3.3 | 5.4 | 4.5 | 6.2 |
Source: CPSC NEISS microdata, PC&S analysis. Keyword shares are approximate weighted shares of free-text narratives. Download CSV
- Swimming pools, 2022 to 2024: 21.7% of narratives mention a fall, 13.8% a jump and 10.1% slipping (CPSC NEISS microdata, PC&S analysis).
- Pool equipment, 2022 to 2024: 52.7% mention a ladder or steps and 42.7% a fall; fractures were the top diagnosis at 23.1% (CPSC NEISS microdata, PC&S analysis).
- Diving, 2022 to 2024: 53.3% mention striking or hitting something and 7.2% mention shallow water (CPSC NEISS microdata, PC&S analysis).
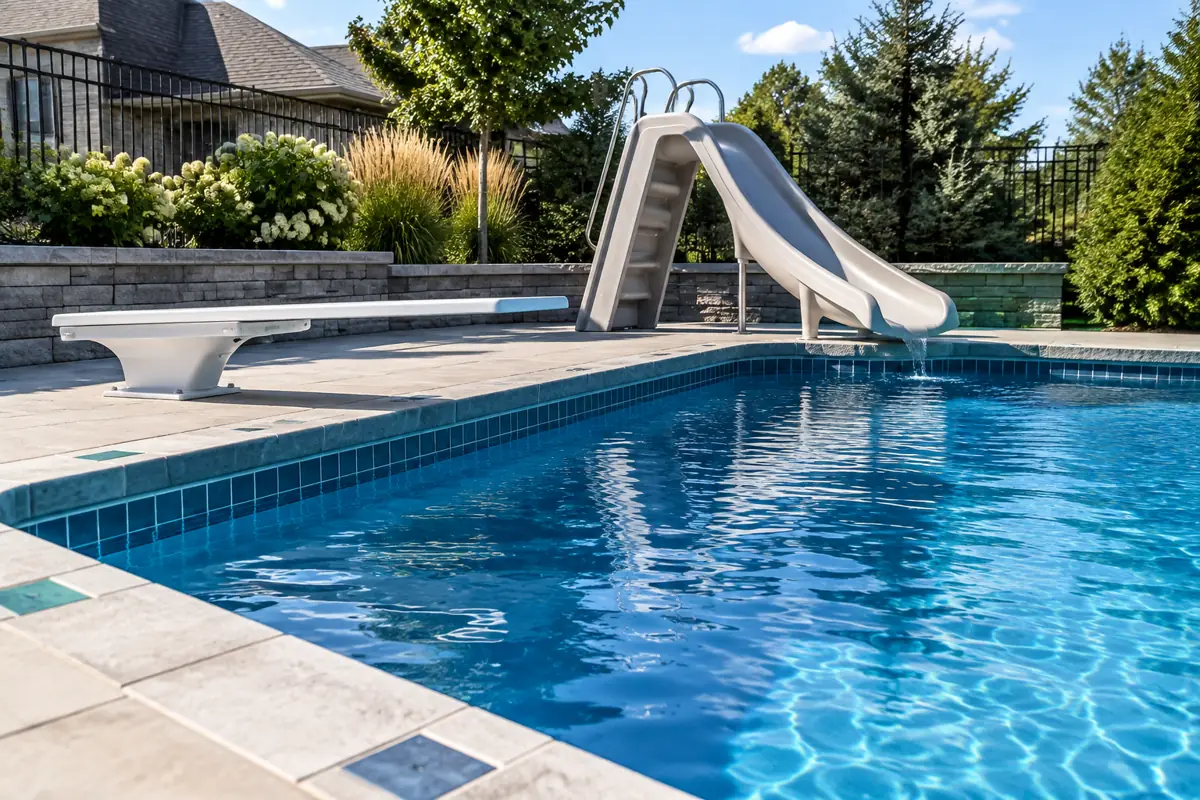
- Pool slides, 2022 to 2024: the head was injured in 32.7% of cases (CPSC NEISS microdata, PC&S analysis).
- Pool chemicals, 2022 to 2024: 65.7% mention chlorine and 22.4% mention fumes, gas or inhalation (CPSC NEISS microdata, PC&S analysis).
Diving board injury statistics and severity by product, 2015 to 2024
Diving injuries are less common than general pool injuries but have the highest share of hospital admissions or transfers among the five product families, although the confidence interval overlaps those of pool equipment and swimming pools. Diving injuries also skew strongly male and toward head injuries.
Source: CPSC NEISS microdata, PC&S analysis. Download chart data (CSV)
From 2015 to 2024, 7.6% of U.S. diving or diving board injuries were admitted or transferred (95% CI 5.7% to 9.5%), compared with 5.2% for swimming pools, 6.6% for pool equipment, 5.3% for pool chemicals and 4.6% for pool slides (CPSC NEISS microdata, PC&S analysis).
In 2024, NEISS recorded an estimated 6,800 U.S. diving or diving board injuries (CPSC NEISS microdata, PC&S analysis). From 2022 to 2024, 70.1% involved males and the head was the injured body part in 32.5% (CPSC NEISS microdata, PC&S analysis). In 2024, 43.1% of diving narratives mentioned a pool, 39.0% a board and 15.0% natural water or structures such as lakes, docks or cliffs (CPSC NEISS microdata, PC&S analysis).
Earlier research on U.S. children found that collision with a diving board or platform caused 43.9% of pediatric diving injuries from 1990 to 2006 (Day et al., Pediatrics 2008). Among U.S. children with facial injuries from 2007 to 2016, 12% of diving injuries were fractures against 7% of swimming injuries (Guys et al., 2018).
Pool chemical injury statistics, 2015 to 2024
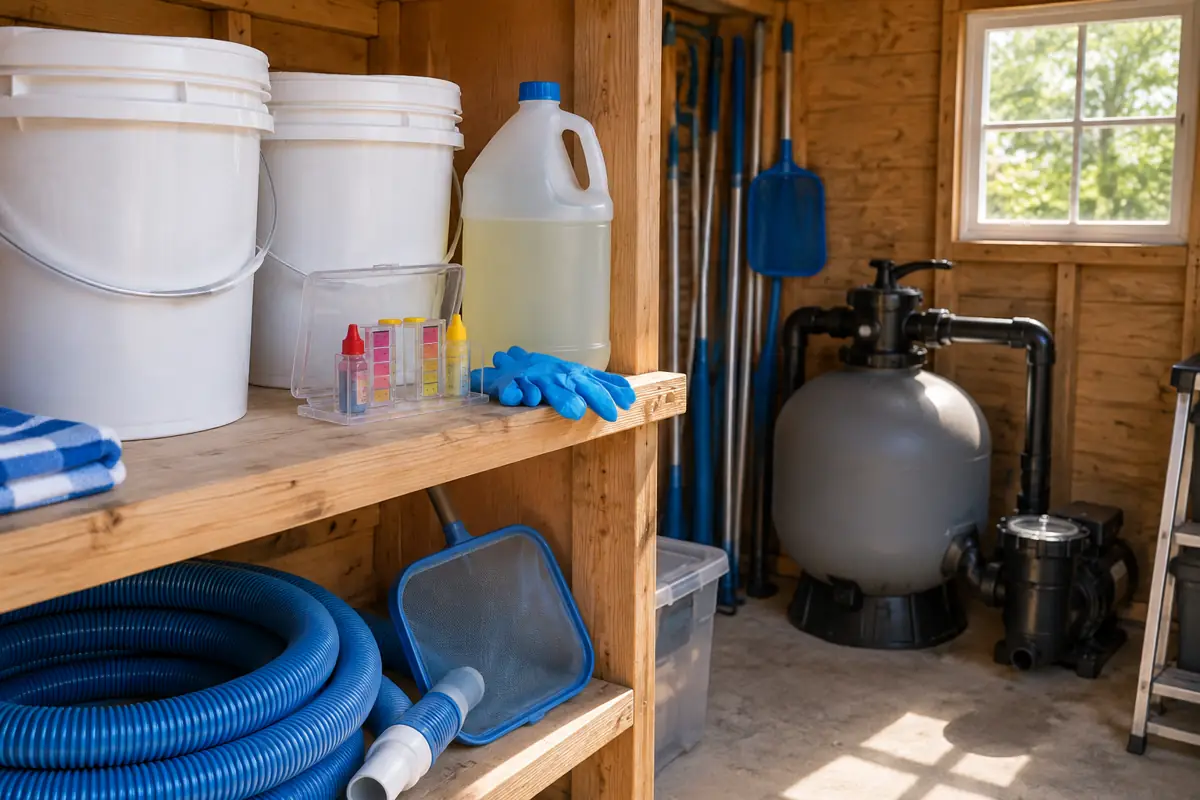
Pool chemical injuries are a small share of pool-related emergency visits. They are mostly poisonings and eye or skin irritation, and a larger share happens at home than for pool injuries in general.
NEISS recorded an estimated 4,700 nonfatal U.S. pool chemical injuries in 2024 (95% CI 3,100 to 6,400) and an average of 4,200 a year from 2022 to 2024 (CPSC NEISS microdata, PC&S analysis). CDC puts the figure at about 4,500 a year (CDC), and CDC’s MMWR found a median of 4,535 a year from 2008 to 2017 (CDC MMWR).
From 2022 to 2024, poisoning was the top diagnosis at 33.4% and dermatitis or conjunctivitis followed at 28.4% (CPSC NEISS microdata, PC&S analysis). The eyeball was the injured body part in 33.9% of cases, 36.8% of narratives mentioned an eye, and 39.9% of cases occurred at home, against 21.4% for all pool product families (CPSC NEISS microdata, PC&S analysis).
How these pool injury statistics compare with other published figures
Published pool injury numbers differ mainly because of scope. This report’s total is 49.5% of CPSC’s broader product grouping, which adds swimming as an activity, and drowning reports count a different outcome.
- CPSC’s ‘Swimming, Pools, Equipment’ grouping: 182,344 U.S. injuries in 2024 (CPSC NEISS Data Highlights 2024). This report’s 90,300 is 49.5% of that figure because swimming as an activity and flotation toys are excluded, as are submersions.
- PC&S replication of the CPSC grouping: 182,267 for 2024, 0.04% below CPSC’s published number (CPSC NEISS microdata, PC&S analysis).
- CDC pool chemical injuries: 13,508 ED visits for 2015 to 2017 (CDC MMWR); PC&S tabulation of NEISS code 938 for the same years: 13,508 (CPSC NEISS microdata, PC&S analysis).
- CPSC pool and spa drownings: an annual average of 5,900 nonfatal drowning injuries to children under 15 from 2023 to 2025 (CPSC 2026 submersion report). See our pool drowning statistics by state report.
- Eye injuries from swimming and water sports: 42,472 U.S. emergency visits from 2013 to 2022, 12.5% of them from chlorine or chemical irritation (Lee et al., 2025).
Fifteen numbers that matter
- An estimated 90,300 nonfatal pool injuries were treated in U.S. emergency departments in 2024, based on 2,362 NEISS sample cases (CPSC NEISS microdata, PC&S analysis).
- Children under 15 accounted for 45.8% of U.S. pool injuries in 2024, about 41,400 emergency visits (CPSC NEISS microdata, PC&S analysis).
- The 2024 U.S. pool injury rate for children under 15 was 69.9 per 100,000, 4.7 times the rate for adults 25 and older (15.0 per 100,000) (CPSC NEISS microdata, PC&S analysis; Census Bureau Vintage 2025).
- Males made up 52.2% of U.S. pool injuries in 2024, a rate of 28.3 per 100,000 against 24.9 for females (CPSC NEISS microdata, PC&S analysis; Census Bureau Vintage 2025).
- July was the peak month for U.S. pool injuries from 2015 to 2024, with a seasonality index of 324, 13.5 times the December index of 24 (CPSC NEISS microdata, PC&S analysis).
- The head was the most frequently injured body part in U.S. pool injuries in 2024, at 16.7% of cases (CPSC NEISS microdata, PC&S analysis).
- Lacerations were the most common specific diagnosis in U.S. pool injuries in 2024, at 17.1%, followed by fractures at 9.8% (CPSC NEISS microdata, PC&S analysis).
- About 11.8% of U.S. pool injury emergency visits in 2024 described an ear complaint such as ear pain or ear infection rather than trauma (CPSC NEISS microdata, PC&S analysis).
- Diving or diving board injuries averaged 7,000 a year in the U.S. from 2022 to 2024, and 70.1% involved males (CPSC NEISS microdata, PC&S analysis).
- Pool equipment injury narratives mentioned a ladder or steps in 52.7% of U.S. cases from 2022 to 2024 (CPSC NEISS microdata, PC&S analysis).
- Pool slides were linked to 1,700 U.S. emergency visits in 2024, and 77.6% of slide injuries from 2022 to 2024 involved children under 15 (CPSC NEISS microdata, PC&S analysis).
- Pool chemicals were linked to 4,700 nonfatal U.S. emergency visits in 2024, close to CDC’s figure of about 4,500 a year (CPSC NEISS microdata, PC&S analysis; CDC).
- Built-in (in-ground) pools were named in 16,100 U.S. pool injuries in 2024, above-ground pools in 1,800 and portable pools in 1,700, while 60,800 did not specify the pool type (CPSC NEISS microdata, PC&S analysis).
- Separately from the injury count, NEISS recorded an estimated 7,400 nonfatal submersion-type visits linked to pool products in 2024; drownings are covered in our pool drowning statistics by state report (CPSC NEISS microdata, PC&S analysis).
Rates, trends and severity we calculated
Pool injury rate by age group
Which ages are injured most often relative to their population size?
weighted NEISS injuries in age group / Census resident population of age group x 100,000Inputs: fact rows #193, #437, #191, #436, #57, #434
Limitations: NEISS covers territories while the Census denominator does not; rates are per resident, not per swimmer; the under-5 estimate has a CV close to CPSC’s 33% limit.
Ten-year trend with percent change and peak year
Are U.S. pool injuries rising or falling from 2015 to 2024?
(2024 estimate / 2015 estimate - 1) x 100; peak = year with highest estimate; 3-year averages at each endInputs: fact rows #101, #182, #461, #462, #466
Limitations: 95% confidence intervals of single years overlap; the 2024 hospital sample change raised all-product estimates by 18.3%, so recent years are not strictly comparable.
Seasonality index
How concentrated are pool injuries in the summer?
monthly share of annual weighted injuries x 12 x 100 (100 = average month)Inputs: fact rows #264, #274, #262, #266, #433
Limitations: Treatment month, not incident month; no state field in NEISS, so climates are blended.
Product risk profile: share admitted or transferred
Which pool products produce the most serious injuries?
weighted cases with disposition 2 or 4 / all weighted cases in the family, pooled over ten yearsInputs: fact rows #408, #400, #404, #416, #412, #420, #432
Limitations: Confidence intervals overlap for most pairs; admission practice varies by hospital; treated-and-released injuries can still be serious.
Ear complaints inside the injury count
How much of the pool injury total is non-traumatic?
weighted share of narratives matching ear-complaint keywords (otitis, ear infection, swimmer's ear, ear pain, earache, otalgia)Inputs: fact rows #249, #216, #234
Limitations: Keyword matching on short narratives; some ear trauma may be counted and some ear infections missed.
Children versus adults
How much higher is the child injury rate?
(injuries age 0-14 / population 0-14) / (injuries age 25+ / population 25+)Inputs: fact rows #495, #496
Limitations: Uses rounded numerators; no exposure adjustment for time spent in pools.
New in this edition
- This edition analyses NEISS microdata for 2015 to 2024. The CPSC NEISS query page listed a 2025 annual data file when it was captured on 2026-09-23 (CPSC NEISS query page), but the CPSC NEISS server returned an error page on 2026-10-03 and the Internet Archive holds no copy of the 2025 file, so 2024 is the latest year analysed.
- The latest NEISS Data Highlights edition listed on the CPSC NEISS query page in its 2026-09-23 capture was for 2024 (CPSC NEISS query page). That edition puts CPSC’s broader ‘Swimming, Pools, Equipment’ grouping at 182,344 U.S. emergency department injuries in 2024, based on 4,825 cases (CPSC NEISS Data Highlights 2024).
- CPSC published its 2026 pool or spa submersion report, built on calendar-year 2025 NEISS data extracted on 2026-04-27. It estimates 6,200 nonfatal pool or spa drowning injuries to U.S. children under 15 in 2025 (CPSC 2026 submersion report). Drownings are outside this report’s injury count.
- CDC’s pool chemical emergencies page, updated May 28, 2025, states that pool chemical injuries account for about 4,500 emergency department visits a year (CDC).
- NEISS estimates for 2024 come from a new hospital sample drawn from a 2020 frame of 4,723 eligible emergency departments (CPSC sample design statement; CPSC 2026 submersion report). CPSC reports that 77 of the 100 sampled hospitals reported in 2024 (CPSC NEISS Data Highlights 2024).
What people ask
How many people get injured in pools each year?
An estimated 90,300 people were treated in U.S. emergency departments for nonfatal pool injuries in 2024, and the 2015 to 2024 average was 93,300 a year (CPSC NEISS microdata, PC&S analysis). Drowning-type visits are counted separately.
What is the most common pool injury?
Lacerations were the most common specific diagnosis in 2024, at 17.1% of U.S. pool injuries, and the head was the most injured body part at 16.7% (CPSC NEISS microdata, PC&S analysis). About 11.8% of visits were ear complaints rather than trauma (CPSC NEISS microdata, PC&S analysis).
How dangerous are diving boards?
Diving or diving boards were linked to 6,800 U.S. emergency visits in 2024, and 7.6% of diving injuries from 2015 to 2024 were admitted or transferred, the highest share of the five pool product families (CPSC NEISS microdata, PC&S analysis). The head was injured in 32.5% of 2022 to 2024 cases (CPSC NEISS microdata, PC&S analysis).
How many pool chemical injuries happen each year?
NEISS data show 4,700 nonfatal pool chemical injuries in the U.S. in 2024 and an average of 4,200 a year from 2022 to 2024 (CPSC NEISS microdata, PC&S analysis). CDC cites about 4,500 emergency visits a year (CDC).
What age group gets hurt most in pools?
Children aged 5 to 9 had the most U.S. pool injuries in 2024, 18,600, and the highest rate, 93.0 per 100,000 (CPSC NEISS microdata, PC&S analysis; Census Bureau Vintage 2025). For nonfatal drownings the pattern differs: children under 5 accounted for 71% of cases among children under 15 from 2023 to 2025 (CPSC 2026 submersion report).
Common questions
Are pool injuries increasing in the United States?
No clear trend is visible. U.S. estimates went from 107,000 in 2015 to 90,300 in 2024, and three-year averages fell 16.1% (CPSC NEISS microdata, PC&S analysis). The annual 95% confidence intervals all overlap.
When do most pool injuries happen?
In summer: 63.0% of U.S. pool injuries from 2015 to 2024 were treated in June, July or August, with July the peak month (CPSC NEISS microdata, PC&S analysis).
What share of pool injuries need a hospital stay?
In 2024, 5.3% of U.S. pool injuries were admitted or transferred, and 93.2% were treated and released (CPSC NEISS microdata, PC&S analysis).
Are males or females injured more often in pools?
Males accounted for 52.2% of U.S. pool injuries in 2024, a rate of 28.3 per 100,000 against 24.9 for females (CPSC NEISS microdata, PC&S analysis; Census Bureau Vintage 2025).
How many people are hurt on pool slides?
Pool slides were linked to 1,700 U.S. emergency visits in 2024, and 77.6% of 2022 to 2024 slide injuries involved children under 15 (CPSC NEISS microdata, PC&S analysis).
How many injuries involve pool ladders and other equipment?
Pool equipment was linked to 6,200 U.S. emergency visits in 2024; 52.7% of 2022 to 2024 equipment narratives mention a ladder or steps (CPSC NEISS microdata, PC&S analysis).
Do in-ground or above-ground pools cause more injuries?
NEISS named built-in pools in 16,100 U.S. injuries and above-ground pools in 1,800 in 2024, but 60,800 records did not state the pool type (CPSC NEISS microdata, PC&S analysis). Without the type for most cases or data on hours of use, the two cannot be compared fairly.
Do these pool injury statistics include drownings?
No. An estimated 7,400 nonfatal submersion-type visits in 2024 are excluded from the injury count (CPSC NEISS microdata, PC&S analysis). Drowning deaths are covered in our pool drowning statistics by state report.
Why is CPSC's swimming and pools figure higher than this report's?
CPSC’s 2024 ‘Swimming, Pools, Equipment’ grouping of 182,344 includes swimming as an activity and flotation toys (CPSC NEISS Data Highlights 2024). This report’s 90,300 covers pool products only and excludes submersions.
Where do pool injuries happen?
The location was not recorded for 48.8% of U.S. pool injuries in 2024. Where recorded, places of recreation or sports accounted for 23.3% of all cases and homes for 21.7% (CPSC NEISS microdata, PC&S analysis).
Method and data notes
- Downloaded the CPSC NEISS public-use annual files for 2015 to 2024 (Internet Archive captures of the exact CPSC file URLs, because the CPSC NEISS server returned an error page on 2026-10-03).
- Kept every case whose Product_1, Product_2 or Product_3 is a pool code from the January 2025 NEISS Coding Manual: 1284, 3221, 3251, 5043, 3262, 1278, 1277 and 0938.
- Assigned each case to one or more of five product families, counting it once per family and once in the total.
- Excluded fatal cases (disposition 8) and submersion-type cases (diagnosis or second diagnosis 69, 65 or 42), following CPSC’s drowning definition.
- Summed NEISS case weights to produce national estimates, rounded to the nearest 100, and computed coefficients of variation with a stratified, with-replacement linearization over all hospitals in each year’s file.
- Flagged estimates that fail CPSC’s stability rule (fewer than 20 cases, an estimate under 1,200, or a CV above 33%).
- Divided by U.S. Census Bureau resident population estimates (Vintage 2025 for 2020 to 2024, Vintage 2020 for 2015 to 2019) to compute rates per 100,000.
- Counted narrative keywords as weighted shares of cases; narratives were never quoted.
- Validated the method by reproducing CPSC’s published 2024 ‘Swimming, Pools, Equipment’ estimate (182,344) to within 0.04% and CDC’s 2015 to 2017 pool chemical total (13,508) exactly.
- This report is part of the PC&S research hub. Pool Construction & Service is an independent matching and information service for pool builders and pool service companies; it does not sell pool products.
Included: Government data (CPSC, Census Bureau, CDC), CPSC methodology documents, OMB sample design filings and peer-reviewed NEISS studies indexed in PubMed.
Excluded: Law firm, retailer and marketing pages that repeat older CPSC figures without new data; a hospital infographic with an undisclosed sample size; any figure that could not be opened and checked.
Conflicting numbers: CPSC’s FAQ describes the NEISS universe as 5,000+ hospitals, while the 2020 sampling frame lists 4,723 eligible emergency departments; this report uses the frame figure. Where published figures differ, this report explains the scope difference (activity versus product codes, drowning versus injury, all visits versus nonfatal) instead of averaging them. PC&S estimates come only from microdata the reader can rebuild with the scripts provided.
Derived metrics: Rates, percent changes, seasonality indices and severity shares were computed in Python from the downloaded microdata and Census files; formulas and input rows are listed in derived.csv.
Caveats
- The most recent NEISS year, 2025, was released by CPSC but could not be downloaded on 2026-10-03; 2024 is the latest year analysed.
- NEISS switched to a new hospital sample in 2024; all-product estimates rose 18.3% from 2023 to 2024, so comparisons across those years mix real change and sample change.
- Single-year estimates have wide confidence intervals; the 2024 total has a 95% CI of 65,800 to 114,900.
- PC&S coefficients of variation approximate CPSC’s variance method and can differ slightly from CPSC-published CVs.
- NEISS records products associated with an injury, not necessarily the cause, and coders may omit a pool code when only swimming is mentioned.
- No state field: NEISS does not support state-level pool injury estimates.
- Rates are per resident, not per swimmer or per pool.
Method last reviewed October 3, 2026.
For reporters and researchers
Quotable statistics
- An estimated 90,300 people were treated in U.S. emergency departments for nonfatal pool injuries in 2024. (U.S. Consumer Product Safety Commission (CPSC))
- U.S. children aged 5 to 9 had a pool injury rate of 93.0 per 100,000 in 2024, the highest of any age group. (U.S. Census Bureau)
- From 2015 to 2024, 63.0% of U.S. pool injuries were treated in June, July or August. (U.S. Consumer Product Safety Commission (CPSC))
- From 2015 to 2024, 7.6% of U.S. diving and diving board injuries led to hospital admission or transfer, the highest share among five pool product families. (U.S. Consumer Product Safety Commission (CPSC))
- Pool chemicals sent an estimated 4,700 people in the U.S. to emergency departments with nonfatal injuries in 2024. (U.S. Consumer Product Safety Commission (CPSC))
- About 11.8% of U.S. pool injury emergency visits in 2024 were for ear complaints rather than trauma. (U.S. Consumer Product Safety Commission (CPSC))
- Only 5.3% of U.S. pool injuries in 2024 led to admission or transfer, against 12.3% of all consumer product injuries. (U.S. Consumer Product Safety Commission (CPSC))
Best-sourced figures
- NEISS Injury Data and archived annual data files (2015 to 2024), U.S. Consumer Product Safety Commission (CPSC)
- NEISS Coding Manual, January 2025 (rev. 1), CPSC
- Explanation of NEISS Estimates Obtained Through the CPSC Website, CPSC
- Pool or Spa Submersion: Estimated Nonfatal Drowning Injuries and Reported Drownings, 2026 Report, CPSC
- Vintage 2025 national population estimates by age and sex, U.S. Census Bureau
- Pool Chemical Injuries in Public and Residential Settings, United States, 2008 to 2017, and New York, 2018, CDC, Morbidity and Mortality Weekly Report
150-word brief
U.S. hospital emergency departments treated an estimated 90,300 nonfatal injuries involving swimming pools, pool equipment, diving boards, pool slides and pool chemicals in 2024, according to a Pool Construction & Service analysis of CPSC’s National Electronic Injury Surveillance System microdata. Drownings were counted separately. Children aged 5 to 9 had the highest injury rate, 93.0 per 100,000, and children under 15 accounted for 45.8% of injuries. Injuries cluster in summer: 63.0% of cases from 2015 to 2024 were treated in June, July or August. Diving injuries had the highest admission share, with 7.6% admitted or transferred. Pool chemicals caused 4,700 visits in 2024, mostly poisonings and eye or skin irritation. The ten-year estimates show no clear trend once sampling error and a 2024 change in NEISS hospitals are taken into account. The 2025 NEISS file was not downloadable when this report was prepared, so 2024 is the latest year analysed.
Possible headlines
- About 90,300 Americans Went to the ER With Pool Injuries in 2024
- Children Aged 5 to 9 Have the Highest Pool Injury Rate, 93.0 per 100,000
- 63.0% of U.S. Pool Injuries From 2015 to 2024 Were Treated in June, July or August
- Diving Injuries Have the Highest Hospital Admission Share Among Pool Products
- Pool Chemicals Sent 4,700 People to U.S. Emergency Rooms in 2024
Citation
Pool Construction & Service. "Pool Injury Statistics: U.S. Emergency Room Visits by Product, Age and Month, 2015 to 2024." PC&S Research Desk, October 3, 2026. https://poolconstructionandservice.com/research/pool-injury-statistics/
License
The data tables and charts in this report are licensed under CC BY 4.0. Reuse them with this attribution: “Source: Pool Construction & Service (poolconstructionandservice.com), Pool Injury Statistics: U.S. Emergency Room Visits by Product, Age and Month, 2015 to 2024.” Figures from third-party sources remain subject to their publishers’ terms.
Datasets
- Pool injuries by product family, United States, 2024 CSV
- Pool injuries by year and product family, 2015 to 2024 CSV
- Pool injury rates by age and sex, 2024 CSV
- Pool injuries by month and seasonality index, 2015 to 2024 CSV
- Pool injuries by diagnosis and body part, 2024 CSV
- Injury profile and severity by pool product family, 2022 to 2024 CSV
- Full fact sheet with sources and limitations CSV
Evidence tiers
Tier 1: primary and government sources (18)
- U.S. Consumer Product Safety Commission (CPSC): NEISS Injury Data and archived annual data files (2015 to 2024)
- CPSC: NEISS Coding Manual, January 2025 (rev. 1)
- CPSC: Explanation of NEISS Estimates Obtained Through the CPSC Website
- CPSC: NEISS Frequently Asked Questions
- CPSC: NEISS Data Highlights, Calendar Year 2024
- CPSC: NEISS Data Highlights, Calendar Year 2023
- CPSC: Pool or Spa Submersion: Estimated Nonfatal Drowning Injuries and Reported Drownings, 2026 Report
- CPSC via OMB (reginfo.gov): Supporting Statement Part B: New NEISS Sample
- CPSC via OMB (reginfo.gov): Supporting Statement for Collection of Information: Follow-up Activities for Product-Related Injuries
- CPSC (Internet Archive capture): CPSC NEISS On-Line Query System (Internet Archive capture, 2026-09-23)
- CPSC: NEISS Data Dictionary
- U.S. Census Bureau: Vintage 2025 national population estimates by age and sex
- U.S. Census Bureau: Vintage 2020 national population estimates by age and sex
- CDC, Morbidity and Mortality Weekly Report: Pool Chemical Injuries in Public and Residential Settings, United States, 2008 to 2017, and New York, 2018
- CDC: Pool Chemical Emergencies
- Pediatrics (Day et al.): Diving-related injuries in children under 20 years old treated in emergency departments in the United States: 1990 to 2006
- International Journal of Pediatric Otorhinolaryngology (Guys et al.): Wet and wounded: pediatric facial trauma from swimming and diving
- American Journal of Emergency Medicine (Lee et al.): Epidemiology of eye injuries in swimming and water sports presenting to United States emergency departments
References
- U.S. Consumer Product Safety Commission (CPSC). NEISS Injury Data and archived annual data files (2015 to 2024). Accessed 2026-10-03.
- CPSC. NEISS Coding Manual, January 2025 (rev. 1). Accessed 2026-10-03.
- CPSC. Explanation of NEISS Estimates Obtained Through the CPSC Website. Accessed 2026-10-03.
- CPSC. NEISS Frequently Asked Questions. Accessed 2026-10-03.
- CPSC. NEISS Data Highlights, Calendar Year 2024. Accessed 2026-10-03.
- CPSC. NEISS Data Highlights, Calendar Year 2023. Accessed 2026-10-03.
- CPSC. Pool or Spa Submersion: Estimated Nonfatal Drowning Injuries and Reported Drownings, 2026 Report. Accessed 2026-10-03.
- CPSC via OMB (reginfo.gov). Supporting Statement Part B: New NEISS Sample. Accessed 2026-10-03.
- CPSC via OMB (reginfo.gov). Supporting Statement for Collection of Information: Follow-up Activities for Product-Related Injuries. Accessed 2026-10-03.
- CPSC (Internet Archive capture). CPSC NEISS On-Line Query System (Internet Archive capture, 2026-09-23). Accessed 2026-10-03.
- CPSC. NEISS Data Dictionary. Accessed 2026-10-03.
- U.S. Census Bureau. Vintage 2025 national population estimates by age and sex. Accessed 2026-10-03.
- U.S. Census Bureau. Vintage 2020 national population estimates by age and sex. Accessed 2026-10-03.
- CDC, Morbidity and Mortality Weekly Report. Pool Chemical Injuries in Public and Residential Settings, United States, 2008 to 2017, and New York, 2018. Accessed 2026-10-03.
- CDC. Pool Chemical Emergencies. Accessed 2026-10-03.
- Pediatrics (Day et al.). Diving-related injuries in children under 20 years old treated in emergency departments in the United States: 1990 to 2006. Accessed 2026-10-03.
- International Journal of Pediatric Otorhinolaryngology (Guys et al.). Wet and wounded: pediatric facial trauma from swimming and diving. Accessed 2026-10-03.
- American Journal of Emergency Medicine (Lee et al.). Epidemiology of eye injuries in swimming and water sports presenting to United States emergency departments. Accessed 2026-10-03.
Related pool research
Pool Drowning Statistics by State: Deaths and Rates, 2018 to 2024
Pool Product Recalls: A Registry of U.S. CPSC Recalls of Pool and Spa Products, 2001 to 2026
Pool Fence Laws by State: Residential Pool Barrier Rules in All 50 States and DC, 2026
Swimming Pool Illness Outbreaks: U.S. Registry of CDC-Reported Outbreaks, 2009 to 2023
Pool Electrocution Statistics: U.S. Deaths, Shock Injuries and the Equipment Involved
How Many Americans Can't Swim: National Estimates Reconciled, 2014 to 2023
All pool industry research (40 reports)