Public Pool Inspection Violations: Closure Rates and Most Common Citations in Six US Jurisdictions, 2019 to 2026
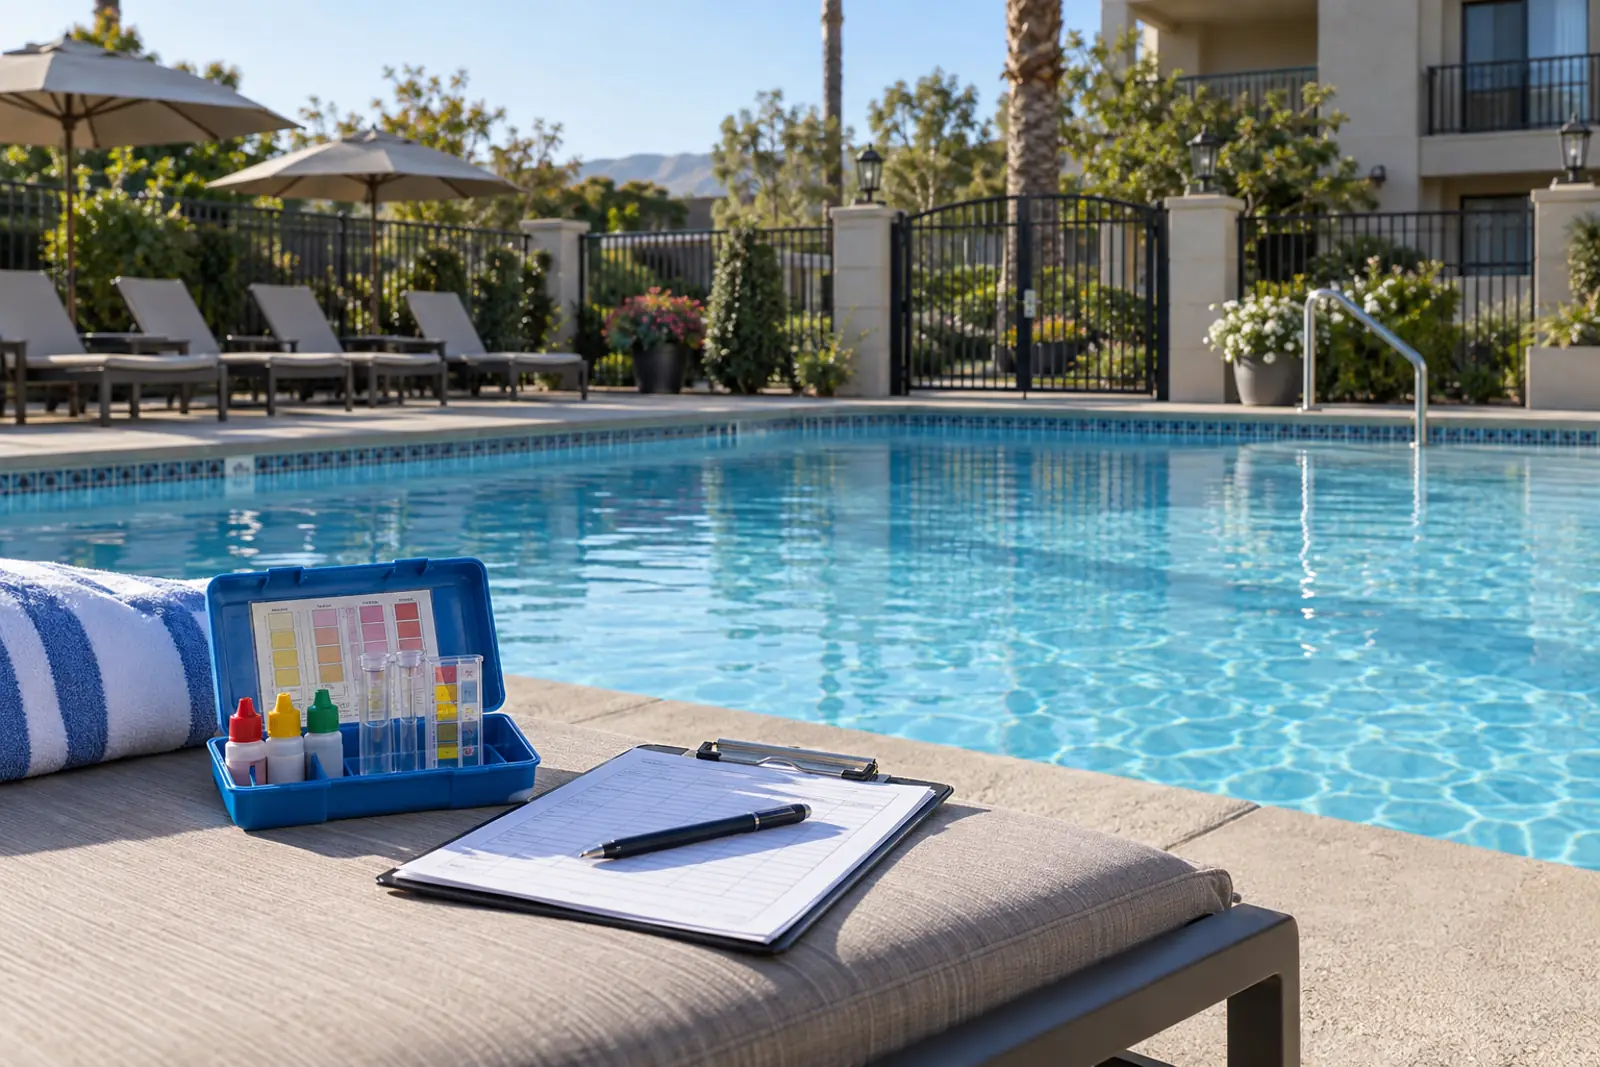
Public pool inspection violations are common in US health department records. In the latest year available, 10.0% to 13.9% of routine inspections in five jurisdictions ended in a closure or found a closure-level hazard, including 13.9% in Sacramento County, California in 2025. Drain-cover, disinfectant and pH problems were the most cited violations there from 2023 to 2025.
At a glance
- Sacramento County, California ended 13.9% of 2,163 routine pool inspections in 2025 with a permit suspension, imminent hazard finding or closure (Sacramento County EMD).
- New York City found at least one public health hazard violation in 11.2% of 960 routine pool inspections in 2025 (NYC DOHMH).
- Arlington, Texas closed 12.5% of routine pool inspections in its 2026 permit season (October 2025 to September 2026) (City of Arlington).
- VGB suction (drain) covers were the single most cited violation in Sacramento County routine inspections from April 2023 to March 2026, at 17.4% of 12,371 citations (Sacramento County EMD).
- Disinfectant, pH and cyanuric acid problems made up 32.2% of Sacramento County violation citations from April 2023 to March 2026 (PC&S analysis of Sacramento County EMD data).
- In Louisville Metro, Kentucky, 53.6% of spa free chlorine readings and 14.5% of pool readings were below the MAHC minimums from October 2021 to April 2024 (Louisville Metro Public Health and Wellness; CDC, 2024 MAHC).
- Montgomery County, Maryland failed 15.2% of pre-opening pool inspections in 2026, against 7.2% of annual inspections (Montgomery County DHHS).
- CDC found that 12.3% of routine inspections in 16 jurisdictions in five states resulted in immediate closure in 2013 (8,118 of 66,098 inspections with closure data), the most recent multi-state benchmark this review found (CDC, MMWR 2016).
Public pool inspection violations and closure rates in six US jurisdictions
Closure-level outcomes cluster between 10.0% and 13.9% of routine inspections in the latest year for five of the six jurisdictions, close to the 12.1% and 12.3% immediate closure shares CDC found in 2008 and 2013. The definitions differ, so the figures show a common order of magnitude rather than a ranking. Austin is the outlier because it counts operator self-closures.
Sacramento County, California recorded a permit suspension, imminent public health hazard or closure in 14.9% of routine inspections in 2023, 14.8% in 2024 and 13.9% in 2025 (Sacramento County EMD).
Arlington, Texas closed 56 of 449 evaluated routine pool inspections (12.5%) in the 2026 season, and another 16.0% passed with a follow-up required (City of Arlington).
New York City does not publish closures in its pool file. The city recorded at least one public health hazard violation, the category that allows immediate closure under Health Code Article 165.11, in 11.2% of routine inspections in 2025 (NYC DOHMH; NYC Health Code Article 165).
Louisville Metro, Kentucky recorded an imminent health hazard in 10.7% of routine inspections in 2022 and 11.2% in 2023 (Louisville Metro Public Health and Wellness).
Austin, Texas ended 32.1% of routine inspections from February to December 2025 in a closure. Self-closures made up 70.8% of Austin closures from February 2025 to September 2026, and COA-closures (the dataset’s label, read here as City of Austin) made up the rest (Austin Public Health).
Montgomery County, Maryland reported a ‘Pool closed’ result in 14.1% to 18.8% of routine inspections in 2018 and 2019 and 13.8% in 2023 under its previous system; its current system recorded Fail or Closed status for 9.1% of 2026 inspections (Montgomery County DHHS, 2018 to 2024 data; Montgomery County DHHS, 2025 to 2026 data).
Definitions differ: New York City and Louisville measure closure-level hazards found, not closures carried out. Montgomery County, MD is excluded because its 2025 to 2026 system records Fail rather than closure.
Source: PC&S analysis of NYC DOHMH, Austin Public Health, Louisville Metro, Sacramento County EMD and City of Arlington open data; CDC MMWR 2010 and 2016. Download chart data (CSV)
| Jurisdiction | Inspecting agency | Dataset | Period in data | Latest inspection date | Records downloaded | Routine inspections in 2025 (Arlington: 2026 season) | Failure definition | Closure-level measure used here | Venue types |
|---|---|---|---|---|---|---|---|---|---|
| New York City, NY | NYC Department of Health and Mental Hygiene (DOHMH) | NYC Pool Inspections (NYC Open Data 3kfa-rvez) | Jan 2019 to Dec 2025 | 2025-12-31 | 7080 | 960 | Public health hazard (PHH) violation: a condition under Health Code Article 165.11 for which DOHMH may close the pool immediately | No closure field; PHH count used as a closure-level measure | Indoor and outdoor pools; spas not separable |
| Austin, TX | Austin Public Health, Environmental Health Services | Pool Inspections (data.austintexas.gov peux-uuwu) | Oct 2023 to Sep 2026 (rolling three years) | 2026-09-10 | 5622 | 1777 | Non-compliant result; from Feb 2025 split into Open, Self-closure and COA-Closure | Self-closure plus COA-Closure (labels as published) | Pools, spas, wading pools, splash pads (venue inferred from facility name) |
| Montgomery County, MD | Montgomery County DHHS, Licensure and Regulatory Services | Pool Inspections (k35y-k582) and HHS Pool Inspection from July 2024 (5zm9-xdka) | Apr 2018 to Oct 2024; Apr 2025 to Sep 2026 | 2026-09-25 | 15571 | 1616 | Old system: 'Critical Violations' and 'Pool closed' results; new system: Pass, Fail, Closed | Old system: results beginning 'Pool closed'; new system: Fail or Closed (not comparable) | Pools, spas (combined) and wading pools |
| Louisville Metro (Jefferson County), KY | Louisville Metro Public Health and Wellness | Louisville Metro KY Pool Inspections; Inspection Results Pools | Oct 2021 to Apr 2024 (inspection records); scores to Oct 2026 | 2026-10-01 | 3036 | 1082 | Pass = score of 86% or more with no critical violation | Imminent health hazard present (condition requiring immediate closure) | Pools, hot tubs/spas, wading pools, other |
| Sacramento County, CA | Sacramento County Environmental Management Department (EMD) | Pool Inspections, Inspection & Violation History table | Apr 2023 to Mar 2026 | 2026-03-26 | 7942 | 2163 | Critical violations, minor violations, pass or in compliance | Suspension of permit to operate, imminent public health hazard or closed | Facility-level inspections covering pools, spas, wading pools, spray grounds |
| Arlington, TX | City of Arlington Planning and Development, Health Services | Pool Inspection (Arlington Open Data) | Oct 2025 to Sep 2026 (2026 permit season) | 2026-09-30 | 1795 | 449 | Preliminary (permit) inspection Pass or Fail; routine Pass with or without follow-up | Closed by COA (label as published) | Pools, spas, public interactive water features |
Source: NYC DOHMH; Austin Public Health; Montgomery County DHHS; Montgomery County DHHS; Louisville Metro Public Health and Wellness; Sacramento County EMD; City of Arlington. Records downloaded 2026-10-06. Download CSV
| Jurisdiction | Year | Measure | Inspections | Closure-level outcomes | Share (%) |
|---|---|---|---|---|---|
| New York City, NY | 2019 | Routine inspections with at least one public health hazard violation | 911 | 151 | 16.6 |
| New York City, NY | 2020 | Routine inspections with at least one public health hazard violation | 389 | 54 | 13.9 |
| New York City, NY | 2021 | Routine inspections with at least one public health hazard violation | 704 | 61 | 8.7 |
| New York City, NY | 2022 | Routine inspections with at least one public health hazard violation | 829 | 110 | 13.3 |
| New York City, NY | 2023 | Routine inspections with at least one public health hazard violation | 887 | 103 | 11.6 |
| New York City, NY | 2024 | Routine inspections with at least one public health hazard violation | 905 | 122 | 13.5 |
| New York City, NY | 2025 | Routine inspections with at least one public health hazard violation | 960 | 108 | 11.2 |
| Austin, TX | 2025 (Feb 1 to Dec 31) | Routine inspections ending in self-closure or COA-closure | 1620 | 520 | 32.1 |
| Austin, TX | 2025 (Feb 1 to Dec 31) | Routine inspections ending in COA-closure only | 1620 | 145 | 9.0 |
| Austin, TX | 2026 (Jan 1 to Sep 10) | Routine inspections ending in self-closure or COA-closure | 1114 | 357 | 32.0 |
| Austin, TX | 2026 (Jan 1 to Sep 10) | Routine inspections ending in COA-closure only | 1114 | 111 | 10.0 |
| Montgomery County, MD | 2018 | Routine inspections with a 'Pool closed' result (old system) | 807 | 114 | 14.1 |
| Montgomery County, MD | 2019 | Routine inspections with a 'Pool closed' result (old system) | 809 | 152 | 18.8 |
| Montgomery County, MD | 2020 | Routine inspections with a 'Pool closed' result (old system) | 193 | 15 | 7.8 |
| Montgomery County, MD | 2021 | Routine inspections with a 'Pool closed' result (old system) | 664 | 89 | 13.4 |
| Montgomery County, MD | 2022 | Routine inspections with a 'Pool closed' result (old system) | 646 | 112 | 17.3 |
| Montgomery County, MD | 2023 | Routine inspections with a 'Pool closed' result (old system) | 689 | 95 | 13.8 |
| Montgomery County, MD | 2024 (to Oct 1) | Routine inspections with a 'Pool closed' result (old system) | 322 | 44 | 13.7 |
| Montgomery County, MD | 2025 (from Apr 1) | Inspections with Fail or Closed status, all types (new system) | 1616 | 117 | 7.2 |
| Montgomery County, MD | 2026 (to Sep 25) | Inspections with Fail or Closed status, all types (new system) | 2776 | 254 | 9.1 |
| Louisville Metro, KY | 2022 | Routine inspections with an imminent health hazard | 999 | 107 | 10.7 |
| Louisville Metro, KY | 2023 | Routine inspections with an imminent health hazard | 1082 | 121 | 11.2 |
| Sacramento County, CA | 2023 | Routine inspections ending in permit suspension, imminent hazard or closure | 1956 | 291 | 14.9 |
| Sacramento County, CA | 2024 | Routine inspections ending in permit suspension, imminent hazard or closure | 2012 | 297 | 14.8 |
| Sacramento County, CA | 2025 | Routine inspections ending in permit suspension, imminent hazard or closure | 2163 | 301 | 13.9 |
| Arlington, TX | 2026 season (Oct 2025 to Sep 2026) | Routine inspections closed by COA | 449 | 56 | 12.5 |
Source: PC&S tabulation of the six health department datasets listed in Table 1. Download CSV
Most common public pool inspection violations: drain covers, disinfectant and pH
Sacramento County is the only jurisdiction in this profile that publishes violation names for every inspection. Its 12,371 routine citations from April 2023 to March 2026 are led by drain-cover (VGB) violations, followed by low disinfectant, flow meters and low pH. Louisville and Montgomery County item data point the same way on water chemistry, with safety equipment second in Louisville.
VGB suction covers accounted for 17.4% of Sacramento County routine violation citations from April 2023 to March 2026 (Sacramento County EMD).
VGB refers to the federal Virginia Graeme Baker Pool and Spa Safety Act, which sets design requirements for drain covers and anti-entrapment systems in public pools and spas (Montgomery County DHHS). The MAHC treats a broken, unsecured or missing main drain grate as an imminent health hazard (MAHC 6.6.3.1) (CDC, 2024 MAHC).
Minimum disinfectant residual accounted for 10.8% of citations, flow meters 8.1% and minimum pH 7.9% in Sacramento County over the same period (Sacramento County EMD).
Grouped into categories, drain and suction outlet covers made up 18.2% of Sacramento County citations, circulation and chemical feed equipment 16.8%, disinfectant level 14.8%, pH 13.9% and enclosures and gates 12.9% (PC&S grouping of Sacramento County EMD data).
In Louisville Metro, Kentucky, 21.6% of routine inspections from October 2021 to April 2024 failed the disinfectant level item and 20.8% failed the safety equipment item (Louisville Metro Public Health and Wellness).
Source: PC&S analysis of Sacramento County EMD Pool Inspections, Inspection & Violation History. Download chart data (CSV)
| Violation (as cited) | PC&S category | Related MAHC 2024 section | Citations in routine inspections | Share of all citations (%) |
|---|---|---|---|---|
| VGB Suction Covers | Drain and suction outlet covers (VGB) | MAHC 5.7.1.5 | 2153 | 17.4 |
| Minimum Disinfectant Residual | Disinfectant level (free chlorine or bromine) | MAHC 5.7.3.1 | 1333 | 10.8 |
| Flow Meters | Circulation, filtration and chemical feed equipment | MAHC 5.7.1, 5.7.2, 5.7.3.5, 5.7.3.7 | 1001 | 8.1 |
| Minimum pH Level | pH | MAHC 5.7.3.4 | 978 | 7.9 |
| Safety Equipment | Safety and lifesaving equipment, signs | MAHC 5.8.5 | 829 | 6.7 |
| Self-Closing Self-Latching Gates | Enclosures, gates and barriers | MAHC 5.8.6 | 826 | 6.7 |
| Electrical Hazards | Electrical hazards | MAHC 5.6.3 | 766 | 6.2 |
| Maximum pH Level | pH | MAHC 5.7.3.4 | 744 | 6.0 |
| Pool Enclosure | Enclosures, gates and barriers | MAHC 5.8.6 | 510 | 4.1 |
| Maximum Disinfectant Residual | Disinfectant level (free chlorine or bromine) | MAHC 5.7.3.1 | 498 | 4.0 |
| Operation Records | Records and test kits | MAHC 6.4.1.2, 5.7.4 | 437 | 3.5 |
| Cyanuric Acid Concentration | Cyanuric acid (stabilizer) | MAHC 5.7.3.1.3 | 433 | 3.5 |
| Minimum Turnover Time | Circulation, filtration and chemical feed equipment | MAHC 5.7.1, 5.7.2, 5.7.3.5, 5.7.3.7 | 299 | 2.4 |
| Chemical Control And Monitoring System | Circulation, filtration and chemical feed equipment | MAHC 5.7.1, 5.7.2, 5.7.3.5, 5.7.3.7 | 296 | 2.4 |
| Disinfectant Feeders | Circulation, filtration and chemical feed equipment | MAHC 5.7.1, 5.7.2, 5.7.3.5, 5.7.3.7 | 291 | 2.4 |
| Recirculation System Operation | Circulation, filtration and chemical feed equipment | MAHC 5.7.1, 5.7.2, 5.7.3.5, 5.7.3.7 | 163 | 1.3 |
| Hand Activated Gate Hardware | Enclosures, gates and barriers | MAHC 5.8.6 | 135 | 1.1 |
| Pool Shell And Tile | Structure, deck, lighting and sanitation | MAHC 5.5, 5.6, 5.10 | 121 | 1.0 |
| Non-Climbable Pool Enclosure | Enclosures, gates and barriers | MAHC 5.8.6 | 119 | 1.0 |
| Safety Vacuum Release System | Drain and suction outlet covers (VGB) | MAHC 5.7.1.5 | 90 | 0.7 |
Source: PC&S analysis of Sacramento County EMD Inspection & Violation History; MAHC sections from CDC, 2024 MAHC. Download CSV
| Violation category | MAHC 2024 section (definition) | Sacramento County, CA: share of citations, routine 2023 to 2025 (%) | Louisville Metro, KY: share of routine inspections failing item, Oct 2021 to Apr 2024 (%) | Montgomery County, MD: share of unsatisfactory critical-item marks, Apr 2025 to Sep 2026 (%) |
|---|---|---|---|---|
| Disinfectant level (free chlorine or bromine) | MAHC 5.7.3.1 | 14.8 | 21.6 | |
| pH | MAHC 5.7.3.4 | 13.9 | 7.4 | |
| Water chemistry, combined item (pH and disinfectant) | MAHC 5.7.3 | 54.8 | ||
| Cyanuric acid (stabilizer) | MAHC 5.7.3.1.3 | 3.5 | ||
| Circulation, filtration and chemical feed equipment | MAHC 5.7.1, 5.7.2, 5.7.3.5, 5.7.3.7 | 16.8 | 15.3 | |
| Drain and suction outlet covers (VGB) | MAHC 5.7.1.5 | 18.2 | ||
| Enclosures, gates and barriers | MAHC 5.8.6 | 12.9 | 4.8 | |
| Safety and lifesaving equipment, signs | MAHC 5.8.5 | 7.1 | 20.8 | |
| Electrical hazards | MAHC 5.6.3 | 6.2 | ||
| Water clarity, main drain not visible | MAHC 5.7.6 | 0.4 | 1.2 | 6.3 |
| Records and test kits | MAHC 6.4.1.2, 5.7.4 | 3.6 | ||
| Supervision (lifeguard, CPR) | MAHC 6.3 | 1.8 |
Source: PC&S analysis of Sacramento County EMD, Louisville Metro Public Health and Wellness and Montgomery County DHHS data; definitions from CDC, 2024 MAHC. Download CSV
Chlorine and pH: water chemistry violations at public pools
Water chemistry is the most consistent problem across the datasets. It is 32.2% of Sacramento County citations and 54.8% of Montgomery County’s unsatisfactory critical items, and measured chlorine in Louisville shows why: spa readings often fall short of the higher spa minimum.
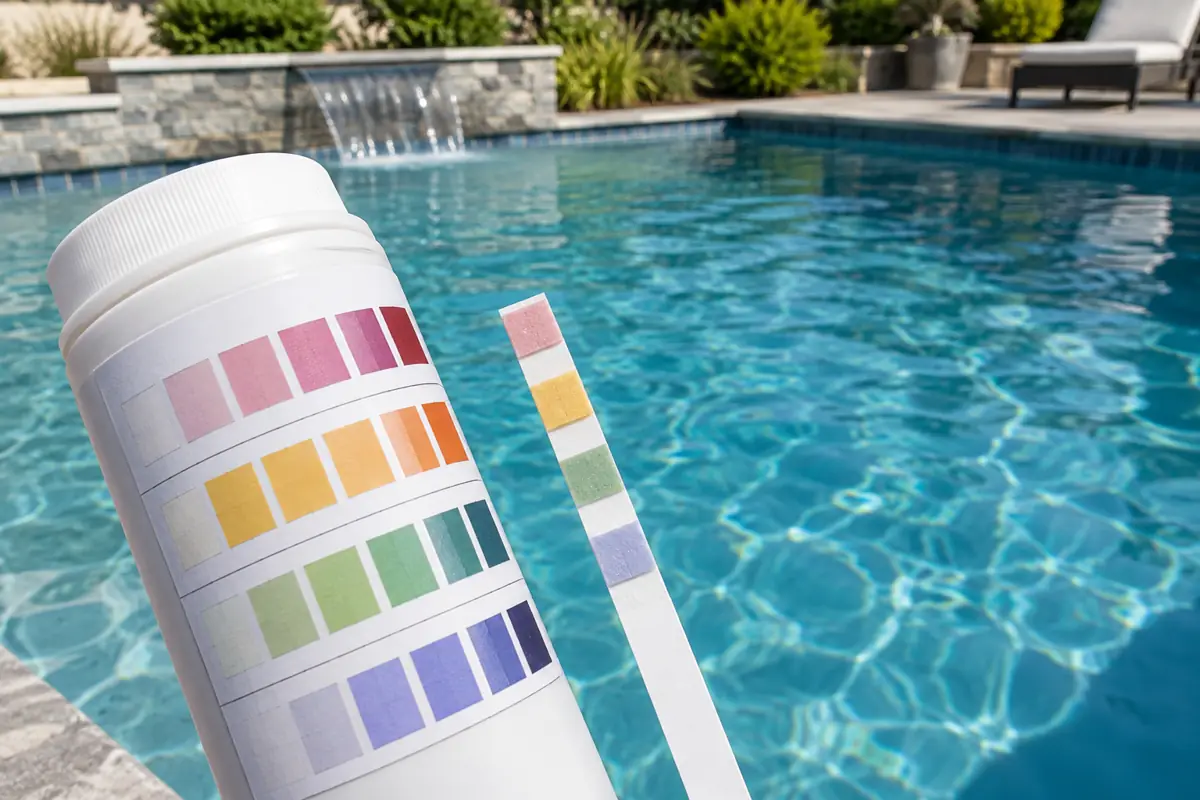
Sacramento County cited at least one disinfectant, pH or cyanuric acid violation in 47.6% of routine pool inspections from April 2023 to March 2026 (Sacramento County EMD).
Louisville Metro recorded disinfectant level or pH out of range in 24.2% of routine inspections from October 2021 to April 2024 (Louisville Metro Public Health and Wellness).
In Louisville, 14.5% of 1,748 pool free chlorine readings were below the MAHC minimum of 1.0 ppm, and 8.6% read 0 ppm (Louisville Metro Public Health and Wellness; CDC, 2024 MAHC).
The MAHC sets a minimum free chlorine of 1.0 ppm for venues without cyanuric acid, 2.0 ppm with cyanuric acid and 3.0 ppm for spas, and a pH range of 7.0 to 7.8 (CDC, 2024 MAHC).
Source: PC&S analysis of Sacramento County EMD, Montgomery County DHHS and Louisville Metro open data. Download chart data (CSV)
| Standard | Pool minimum free chlorine (ppm) | Spa minimum free chlorine (ppm) | Maximum free chlorine (ppm) | pH range | Reference |
|---|---|---|---|---|---|
| CDC Model Aquatic Health Code, 2024 (5th edition) | 1.0 (2.0 with cyanuric acid) | 3.0 | Set by product label; above 10 ppm with bathers present is an imminent health hazard | 7.0 to 7.8 (below 6.5 or above 8.0 is an imminent health hazard) | MAHC 5.7.3.1.1.2, 5.7.3.1.1.5, 5.7.3.4.1, 6.6.3.1 |
| New York City Health Code Article 165 | 0.6 (1.5 when pH is 7.8 to 8.2) | 1.5 | 5.0 (pools, during use) | Pools: up to 8.2; spas: 7.2 to 7.8 | Article 165.23 text |
| Texas 25 TAC 265.193 (Austin, Arlington) | 1.0 | 2.0 | 8.0 | 7.0 minimum, 7.8 maximum (ideal 7.2 to 7.6) | Figure 25 TAC 265.193(c) |
| California 22 CCR 65529 (Sacramento County) | 1.0 (2.0 with cyanuric acid) | 3.0 (also wading pools and spray grounds) | 10.0 | Not in 65529 | 22 CCR 65529(b) |
| Louisville Metro inspection standard (as stated in its open data dictionary) | 1.0 to 2.5 range | 2.0 to 3.0 range | 2.5 (pools), 3.0 (spas) per stated range | 7.2 to 7.8 | Data dictionary, Disinfectant Level and pH Balance fields |
Source: CDC, 2024 MAHC; NYC Health Code Article 165; Texas DSHS, 25 TAC 265; 22 CCR 65529; Louisville data dictionary. Download CSV
Hot tubs and spas versus pools: inspection failure rates
Spas close more often than pools in four of five closure-level comparisons, but only by 1.6 to 3.3 percentage points, and Louisville’s imminent hazard share runs the other way. The large gap is in chlorine: spas must hold a higher minimum, and in Louisville more than half of spa readings fell short of the MAHC spa level.
Arlington, Texas closed 14.6% of routine spa inspections and 12.4% of routine pool inspections in the 2026 season (City of Arlington).
Austin, Texas ended 33.9% of routine spa inspections and 32.3% of routine pool inspections in a closure from February 2025 to September 2026, with venue type inferred from facility names (Austin Public Health).
In Louisville Metro, 59.5% of routine spa inspections and 60.3% of routine pool inspections did not pass from October 2021 to April 2024, 0.8 percentage points lower for spas (Louisville Metro Public Health and Wellness).
In Louisville, 53.6% of 69 spa free chlorine readings were below the MAHC spa minimum of 3.0 ppm, against 14.5% of pool readings below the 1.0 ppm pool minimum (Louisville Metro Public Health and Wellness). The median spa reading was 2.4 ppm.
CDC reported that 15.1% of routine hot tub and spa inspections and 11.8% of pool inspections resulted in immediate closure in 2013; pH violations were found in 27.5% of spa inspections (CDC, MMWR 2016).
Source: PC&S analysis of Louisville Metro, City of Arlington and Austin Public Health open data; CDC MMWR 2016. Download chart data (CSV)
| Jurisdiction | Period | Measure | Pool inspections or readings | Pools (%) | Spa inspections or readings | Spas (%) |
|---|---|---|---|---|---|---|
| Louisville Metro, KY | Oct 2021 to Apr 2024 | Routine inspection failed (score below 86% or critical violation) | 1876 | 60.3 | 121 | 59.5 |
| Louisville Metro, KY | Oct 2021 to Apr 2024 | Disinfectant level out of range at routine inspection | 1876 | 21.4 | 121 | 31.4 |
| Louisville Metro, KY | Oct 2021 to Apr 2024 | Free chlorine reading below MAHC minimum (1.0 ppm pools, 3.0 ppm spas) | 1748 | 14.5 | 69 | 53.6 |
| Louisville Metro, KY | Most recent score, 2026 | Most recent inspection score below 86 | 432 | 16.0 | 24 | 12.5 |
| Arlington, TX | 2026 season | Preliminary (permit) inspection failed | 712 | 51.4 | 76 | 47.4 |
| Arlington, TX | 2026 season | Routine inspection closed by COA | 396 | 12.4 | 48 | 14.6 |
| Austin, TX | Feb 2025 to Sep 2026 | Routine inspection non-compliant | 2352 | 61.1 | 298 | 63.1 |
| Austin, TX | Feb 2025 to Sep 2026 | Routine inspection ended in self-closure or COA-closure | 2352 | 32.3 | 298 | 33.9 |
| Sacramento County, CA | Apr 2023 to Dec 2025 | Routine inspection ended in suspension or closure (pool-only vs spa-only permits) | 2562 | 15.4 | 34 | 17.6 |
| CDC NAFIS, 16 jurisdictions in AZ, CA, FL, NY, TX | 2013 | Routine inspection resulted in immediate closure | 43636 | 11.8 | 14637 | 15.1 |
Source: PC&S analysis of Louisville Metro Public Health and Wellness, Louisville Metro Public Health and Wellness, City of Arlington, Austin Public Health and Sacramento County EMD data; CDC, MMWR 2016. Download CSV
When public pools fail inspection: seasonality of violations
In New York City and Montgomery County, failure shares peak in spring and early summer, when pre-opening and first inspections find equipment and chemistry problems, and fall by July and August. Sacramento County’s closures are concentrated in its June to August inspection season, and the year-round Texas and Kentucky programs show no strong seasonal pattern.
New York City found a public health hazard violation in 17.7% of routine inspections from January to June and 9.1% in July and August, pooling 2019 to 2025 (NYC DOHMH).
Montgomery County, Maryland recorded Fail or Closed status in 16.7% of April and May inspections and 4.7% of July to September inspections, pooling April 2025 to September 2026 (Montgomery County DHHS).
Sacramento County ended 15.4% of June to August routine inspections in suspension or closure, against 1.8% from September to April; 91.1% of its routine inspections fall in June to August (Sacramento County EMD).
Austin’s monthly non-compliance share stayed between 48.3% and 63.3% across the calendar year from October 2023 to September 2026 (Austin Public Health).
Source: PC&S analysis of NYC DOHMH, Austin Public Health, Louisville Metro, Sacramento County EMD and Montgomery County DHHS open data. Download chart data (CSV)
New York City pool inspection violations, 2019 to 2025
New York City’s seven-year file shows fewer routine inspections with any violation since 2019, while the share with a public health hazard has held between 8.7% and 16.6%. Most violations cited are general (lowest severity).
General violations made up 60.3% of all violations cited at New York City routine pool inspections in 2025, and public health hazard violations 21.6% (NYC DOHMH).
New York City routine inspections averaged 0.87 violations each in 2025 (NYC DOHMH).
The share of New York City routine inspections with any violation fell 18.9 percentage points from 2019 to 2025 (NYC DOHMH).
2020 volumes were reduced by COVID-19 closures (DOHMH dataset note).
Source: PC&S analysis of NYC DOHMH, NYC Pool Inspections (NYC Open Data). Download chart data (CSV)
How often public pools are inspected
Inspection frequency ranges from one routine visit a year to monthly checks. The data show about one routine inspection per permit a year in New York City and Austin, and two or more in Louisville and Montgomery County.
- New York City: 1.0 routine inspection per permitted pool in 2025 (NYC DOHMH).
- Austin, Texas: 1.02 routine inspections per facility in 2025; operating permits are valid for 1 year (Austin Public Health; City of Austin).
- Sacramento County, California: 1.69 routine inspections per facility in 2025; EMD conducts annual inspections at approximately 2,200 public pools, spas, spray grounds and water parks (Sacramento County EMD; EMD Recreational Health Program).
- Louisville Metro, Kentucky: 2.57 routine inspections per facility in 2023; the department says pools are inspected twice annually (Louisville Metro Public Health and Wellness; Louisville Metro bulletin, June 19, 2026).
- Montgomery County, Maryland: 2.84 inspections per registered pool in 2026, counting pre-opening, annual and monitoring visits (Montgomery County DHHS).
- Metro Nashville, Tennessee: pools are inspected at a minimum every month that they are open (Metro Nashville Public Health).
- CDC: routine inspections are conducted one to three times per year, primarily in warmer months, in the 2013 NAFIS jurisdictions (CDC, MMWR 2016).
How local pool inspection results compare with CDC surveillance
The latest local closure-level shares sit near the CDC multi-state benchmarks from 2008 and 2013. Those two CDC reports are the most recent multi-state inspection summaries this review found, so local open data carry the newer evidence.
CDC analysed 121,020 routine pool inspections from 15 agencies in 2008; 12.1% of the 111,487 with closure data resulted in immediate closure and 61.1% identified at least one violation (CDC, MMWR 2010).
CDC’s Network for Aquatic Facility Inspection Surveillance found that 12.3% of routine inspections resulted in immediate closure in 2013, and 78.9% identified at least one violation (CDC, MMWR 2016).
Austin, Texas was one of the 16 NAFIS jurisdictions, reporting 1,348 routine inspections for 2013 (CDC, MMWR 2016).
Sacramento County’s 2025 closure share was 1.6 percentage points above the 2013 NAFIS immediate closure share, a difference within the range expected from different codes and years (Sacramento County EMD; CDC, MMWR 2016).
Hotel and motel pools had an immediate closure share of 15.3% in CDC’s 2008 sample (CDC, MMWR 2010).
Fifteen numbers that matter
- New York City: 43.4% of 960 routine pool inspections in 2025 found at least one violation of any severity, down from 62.3% in 2019 (NYC DOHMH).
- New York City: the annual share of routine inspections with a public health hazard violation ranged from 8.7% to 16.6% between 2019 and 2025 (NYC DOHMH).
- New York City: indoor pools had a public health hazard violation in 13.8% of routine inspections from 2023 to 2025, compared with 9.0% for outdoor pools (NYC DOHMH).
- Austin, Texas: 60.4% of 1,777 routine pool and spa inspections in 2025 were rated non-compliant (Austin Public Health).
- Austin, Texas: 32.0% of routine inspections from January 1 to September 10, 2026 ended in a closure, 22.1% self-closures and 10.0% COA-closures (Austin Public Health).
- Montgomery County, Maryland: 13.8% of routine pool inspections in 2023 ended with a ‘Pool closed’ result under the county’s previous reporting system (Montgomery County DHHS).
- Montgomery County, Maryland: water chemistry accounted for 54.8% of 602 unsatisfactory critical-item marks from April 2025 to September 2026 (Montgomery County DHHS).
- Louisville Metro, Kentucky: 62.6% of 1,082 routine pool inspections did not meet the passing standard (score of 86% with no critical violation) in 2023 (Louisville Metro Public Health and Wellness).
- Louisville Metro, Kentucky: 11.2% of routine pool inspections in 2023 recorded an imminent health hazard, the condition that requires immediate closure (Louisville Metro Public Health and Wellness).
- Louisville Metro, Kentucky: 13.9% of 533 permitted pools had a most recent 2026 inspection score below 86, through October 1, 2026 (Louisville Metro Public Health and Wellness).
- Sacramento County, California: 80.2% of routine pool inspections in 2025 found critical violations or ended in suspension, and 9.5% were rated pass or in compliance (Sacramento County EMD).
- Sacramento County, California: 47.6% of routine pool inspections from April 2023 to March 2026 cited at least one disinfectant, pH or cyanuric acid violation (Sacramento County EMD).
- Arlington, Texas: 50.7% of 793 preliminary (permit) pool inspections in the 2026 season were rated Fail (City of Arlington).
- CDC: hot tub and spa inspections resulted in immediate closure in 15.1% of routine inspections in 2013, compared with 11.8% for pools, in 16 jurisdictions in five states (CDC, MMWR 2016).
Rates, trends and severity we calculated
Closure-level share per jurisdiction and year
How often do routine public pool inspections end in a closure or find a closure-level hazard?
Closure-level outcomes / routine inspections with a result, per jurisdiction and year (each jurisdiction's own definition)Inputs: facts.csv Sacramento, Arlington, NYC, Louisville, Austin and Montgomery County annual rows; derived D1, D2, D21, D22
Limitations: Definitions differ (closures carried out versus hazards found). Montgomery County’s current system records Fail, not closure, and is excluded from the range.
Top violation categories as a share of all violations
Which violations are cited most often?
Citations in category / all citations, routine inspections, Sacramento County April 2023 to March 2026Inputs: facts.csv Sacramento category rows; derived D6, D7
Limitations: One jurisdiction with violation names; categories are a PC&S keyword grouping (scripts/04_analyze.py).
Seasonality of failures
Do pool inspection failures peak in summer?
Adverse outcomes / inspections, by calendar month, pooled across yearsInputs: facts.csv monthly rows; derived D8, D9, D10
Limitations: Monthly mixes of inspection type and venue type change; months with fewer than 30 inspections are left out of the chart.
Spas versus pools failure rates
Do hot tubs and spas fail inspection more often than pools?
Spa share minus pool share for the same measure and source (percentage points)Inputs: derived D12, D13, D17, D14, D15, D18, D16
Limitations: Small spa samples; Austin venue type inferred from names; different minimums for spas and pools drive the chlorine gap.
Chemistry violations share
What share of pool inspection problems involve water chemistry?
(disinfectant + pH + cyanuric acid citations) / all citations; and inspections with at least one chemistry item / inspectionsInputs: derived D5; facts.csv Sacramento chemistry, Montgomery water chemistry item and Louisville chemistry rows
Limitations: Different counting units in each jurisdiction; chemical feed equipment counted separately.
Operator self-closures in Austin
Who closes the pool when an Austin inspection finds a closure-level problem?
Self-closures / (self-closures + COA-closures), routine inspections February 2025 to September 2026Inputs: derived D4
Limitations: Labels as published; Austin does not define the terms in the dataset.
Inspection frequency
How many inspections does a permitted pool receive in a year?
Inspections / distinct permits or facilities inspected in the yearInputs: facts.csv frequency rows; derived D19
Limitations: Facility and permit definitions differ (Sacramento counts sites; NYC counts permits).
New in this edition
- Arlington, Texas published inspections through September 30, 2026, covering its full 2026 permit season (1,795 records) (City of Arlington).
- Montgomery County, Maryland’s current dataset runs to September 25, 2026, with 2,776 evaluated inspections in 2026 (Montgomery County DHHS).
- Austin Public Health’s rolling three-year file runs to September 10, 2026 (Austin Public Health).
- Louisville Metro Public Health and Wellness restated that pools are inspected twice a year and pointed residents to its open inspection data (Louisville Metro Public Health and Wellness).
- New York City’s dataset now holds the full 2025 inspection year (960 routine inspections) (NYC DOHMH).
- Austin began labelling non-compliant results as Open, Self-closure or COA-Closure in February 2025, which makes closure rates measurable (Austin Public Health).
- CDC posted the 2024 Model Aquatic Health Code (5th edition), which adds three imminent health hazards requiring immediate closure, including free chlorine above 10 ppm with bathers present; the Annex was revised on February 4, 2025 (CDC).
What people ask
How often are public pools inspected?
It depends on the jurisdiction: New York City averaged 1.0 routine inspection per permitted pool in 2025 (NYC DOHMH), Louisville says it inspects pools twice a year (Louisville Metro Public Health and Wellness) and Metro Nashville inspects pools at least every month they are open (Metro Nashville Public Health).
What is the most common pool inspection violation?
In Sacramento County, California, VGB suction (drain) covers were the most cited violation from April 2023 to March 2026, at 17.4% of citations, followed by minimum disinfectant residual at 10.8% (Sacramento County EMD).
Why do public pools get closed?
Pools are closed for imminent health hazards such as low disinfectant, pH below 6.5 or above 8.0, missing or broken drain grates, a cloudy pool bottom, missing lifesaving equipment or a broken enclosure, as listed in MAHC 6.6.3.1 (CDC, 2024 MAHC). In Sacramento County, 13.9% of routine inspections ended in suspension or closure in 2025 (Sacramento County EMD).
What chlorine level is required in public pools?
The 2024 MAHC sets a minimum of 1.0 ppm free chlorine (2.0 ppm with cyanuric acid) for pools and 3.0 ppm for spas (CDC, 2024 MAHC). Texas requires at least 1.0 ppm in pools and 2.0 ppm in spas (Texas DSHS, 25 TAC 265), and New York City requires at least 0.6 mg/l in pools at pH 7.8 or lower (NYC Health Code Article 165).
Are hotel hot tubs inspected?
Yes. New York City’s bathing establishment permit covers hotels and motels (NYC DOHMH), and Sacramento County counts hotel and motel pools and spas as public (Sacramento County EMD). Arlington inspected 48 spas on routine visits in the 2026 season and closed 14.6% of them (City of Arlington). CDC advises checking a hot tub’s latest inspection results and recommends at least 3 ppm chlorine (CDC).
Common questions
What counts as a public pool for inspection purposes?
Sacramento County treats a pool as public when it serves the general public or members and guests, including hotel, motel and apartment pools; it inspects approximately 2,200 public pools, spas, spray grounds and water parks a year (Sacramento County EMD).
What share of public pool inspections find a violation?
New York City found at least one violation in 43.4% of routine pool inspections in 2025 (NYC DOHMH); CDC found 78.9% in 16 jurisdictions in 2013 (CDC, MMWR 2016).
What is a public health hazard violation at a New York City pool?
It is a condition listed in Health Code Article 165.11, such as inadequate disinfectant or a missing main drain grate, that allows DOHMH to close the pool immediately (NYC Health Code Article 165). 11.2% of 2025 routine inspections had one (NYC DOHMH).
How many pools fail their opening inspection?
Montgomery County, Maryland failed 15.2% of pre-opening inspections in 2026 (Montgomery County DHHS), and Arlington, Texas failed 50.7% of preliminary permit inspections in its 2026 season (City of Arlington).
Are drain cover violations common?
Yes in Sacramento County: 34.7% of routine inspections from April 2023 to March 2026 cited VGB suction covers (Sacramento County EMD). Product-level drain cover issues are covered in pool product recalls.
Are pool fence and gate violations common?
Enclosures and gates made up 12.9% of Sacramento County routine citations from April 2023 to March 2026 (Sacramento County EMD); residential fence rules are compared in pool fence laws by state.
What pH is allowed in a public pool?
The MAHC range is 7.0 to 7.8, and pH below 6.5 or above 8.0 is an imminent health hazard (CDC, 2024 MAHC). pH made up 13.9% of Sacramento County citations from April 2023 to March 2026 (Sacramento County EMD).
Do wading pools fail more often than other pools?
CDC found an immediate closure share of 21.6% for wading pools in 2013 (CDC, MMWR 2016); in Montgomery County, Maryland, wading pools had a Fail or Closed share of 6.7% from April 2025 to September 2026, below the 8.9% for pools and spas (Montgomery County DHHS).
What changed in the 2024 Model Aquatic Health Code?
Where can I look up a specific pool's inspection results?
Most health departments publish them: Louisville posts results on its open data portal (Louisville Metro Public Health and Wellness), Florida lists inspections by county (Florida Department of Health) and DeKalb County, Georgia grades pools on a 100-point scale (DeKalb Public Health). This report publishes aggregate figures only.
Method and data notes
- Searched the Socrata open data catalog, ArcGIS Hub and Google (Serper) for US health department pool inspection datasets; kept inspection-level datasets with results that were current in 2024 or later.
- Downloaded every record from seven datasets in six jurisdictions on 2026-10-06 (raw/, scripts/01_download.py): NYC DOHMH, Austin Public Health, Montgomery County DHHS (two datasets), Louisville Metro (two layers), Sacramento County EMD (inspection and violation history) and the City of Arlington.
- Read each dataset’s description or data dictionary to define pass, fail and closure; recorded those definitions in Table 1.
- Restricted rate calculations to routine inspections (Arlington: preliminary and routine separately) because follow-up and complaint inspections target known problems.
- Deduplicated Sacramento County history rows to one row per inspection report, because each report repeats across permit elements.
- Grouped Sacramento County’s 47 violation names into 12 categories by keyword (scripts/04_analyze.py) and mapped each category to a 2024 MAHC section as a definition.
- Compared Louisville free chlorine readings with MAHC minimums (1.0 ppm pools, 3.0 ppm spas).
- Read CDC MMWR 2010 and 2016 inspection summaries, the 2024 MAHC and jurisdiction rules (NYC Article 165, Texas 25 TAC 265, California 22 CCR 65529) for benchmarks and definitions.
- Computed derived metrics in scripts/06_build_facts.py (derived.csv) and verified every number on the page against facts.csv, derived.csv and the table CSVs (scripts/08_verify.py).
Included: Health department datasets with inspection-level results for public, commercial or semi-public pools and spas, a published result field and records from 2024 or later. CDC surveillance reports and official rule texts for definitions and benchmarks.
Excluded: Facility names, addresses and identifiers (aggregate figures only). Datasets with only facility lists or no results (Monroe County, IN geocoded list). Lewisville, TX, as too small for rate calculations. Montgomery County’s pre-2024 critical-item fields, which read ‘In Compliance’ on every row. Market estimates and news summaries of CDC figures.
Conflicting numbers: Harris County Public Health states the 2013 CDC closure share as 12.5%; this report uses the 12.3% in the CDC report itself. Where a jurisdiction changed its reporting system (Montgomery County 2024, Austin February 2025), the two periods are reported separately and not joined.
Derived metrics: Shares are counts divided by routine inspections with a result. Gaps are percentage-point differences. Seasonality pools all years by calendar month. All formulas, inputs and results are in derived.csv; scripts/04_analyze.py to 06_build_facts.py reproduce them from raw/.
Caveats
- Six jurisdictions are a convenience sample of those that publish inspection-level open data; they do not represent the United States.
- Pass, fail and closure definitions differ by jurisdiction, so cross-jurisdiction comparisons show orders of magnitude, not rankings.
- Louisville’s inspection-level layer ends April 19, 2024 despite a stated rolling update; its 2026 score layer has scores but no critical-violation flag.
- Sacramento County’s file ends March 26, 2026, so the 2026 season is not yet included.
- Austin venue types (spa, wading pool, splash pad) are inferred from facility names.
- New York City publishes violation counts by severity, not violation names or closures.
- Inspection results describe one moment; operators often correct violations on site.
Method last reviewed October 6, 2026.
For reporters and researchers
Quotable statistics
- Sacramento County, California ended 13.9% of routine public pool inspections in 2025 with a permit suspension or closure. (Sacramento County (Environmental Management Department data, County GIS))
- New York City found a public health hazard violation in 11.2% of routine pool inspections in 2025. (NYC Department of Health and Mental Hygiene (DOHMH), NYC Open Data)
- Drain-cover (VGB) violations were 17.4% of all routine pool inspection citations in Sacramento County from April 2023 to March 2026, the most cited single violation. (Sacramento County (Environmental Management Department data, County GIS))
- Disinfectant, pH and cyanuric acid problems made up 32.2% of Sacramento County pool violation citations from April 2023 to March 2026. (Sacramento County (Environmental Management Department data, County GIS))
- In Louisville, Kentucky, 53.6% of spa chlorine readings from October 2021 to April 2024 were below the 3.0 ppm MAHC spa minimum. (Louisville Metro Public Health and Wellness, Louisville Open Data)
- Arlington, Texas failed 50.7% of preliminary pool permit inspections in its 2026 season. (City of Arlington, TX, Planning and Development Services, Health Services)
- Montgomery County, Maryland failed 15.2% of pre-opening pool inspections in 2026, against 7.2% of annual inspections. (Montgomery County, MD, Department of Health and Human Services (dataMontgomery))
Best-sourced figures
- Pool Inspections: Facilities and Inspection & Violation History, Sacramento County (Environmental Management Department data, County GIS)
- NYC Pool Inspections (dataset 3kfa-rvez), NYC Department of Health and Mental Hygiene (DOHMH), NYC Open Data
- Louisville Metro KY: Pool Inspections (feature layer and data dictionary), Louisville Metro Public Health and Wellness, Louisville Open Data
- Pool Inspection (Arlington Open Data), City of Arlington, TX, Planning and Development Services, Health Services
- Immediate Closures and Violations Identified During Routine Inspections of Public Aquatic Facilities: Network for Aquatic Facility Inspection Surveillance, Five States, 2013 (MMWR Surveill Summ 2016;65(No. SS-5)), Centers for Disease Control and Prevention (CDC)
- 2024 Model Aquatic Health Code, 5th edition (code), Centers for Disease Control and Prevention (CDC)
150-word brief
Public pool inspection violations are routine findings: closure-level problems turn up in a median 11.2% of routine inspections across five jurisdictions, according to a Pool Construction & Service analysis of 41,046 inspection records from six US health departments. Sacramento County, California ended 13.9% of routine inspections in 2025 with a permit suspension or closure, and New York City found a public health hazard in 11.2% of 2025 routine inspections. Drain-cover (VGB) violations led Sacramento County citations, and water chemistry (disinfectant, pH, cyanuric acid) made up 32.2% of them. Spas close only slightly more often than pools; in Louisville 53.6% of spa chlorine readings fell below the 3.0 ppm CDC model code minimum. In New York City and Montgomery County, failure shares peak in spring and early summer. The results sit close to CDC’s 2008 and 2013 immediate closure shares of 12.1% and 12.3%. Definitions differ, so they show scale, not a ranking.
Possible headlines
- Closure-Level Problems Found in 10.0% to 13.9% of Routine Pool Inspections Across Five US Jurisdictions
- Drain Covers Are the Single Most Cited Pool Violation in Sacramento County
- Sacramento County Suspended or Closed Pools After 13.9% of Routine Inspections in 2025
- Over Half of Louisville Spa Chlorine Readings Fell Below the CDC Model Code Minimum
- New York City and Montgomery County Pools Fail Inspection Most Often Before Midsummer
Citation
Pool Construction & Service. "Public Pool Inspection Violations: Closure Rates and Most Common Citations in Six US Jurisdictions, 2019 to 2026." PC&S Research Desk, October 6, 2026. https://poolconstructionandservice.com/research/public-pool-inspection-violations/
License
The data tables and charts in this report are licensed under CC BY 4.0. Reuse them with this attribution: “Source: Pool Construction & Service (poolconstructionandservice.com), Public Pool Inspection Violations: Closure Rates and Most Common Citations in Six US Jurisdictions, 2019 to 2026.” Figures from third-party sources remain subject to their publishers’ terms.
Datasets
- Pool inspection datasets and definitions, six US jurisdictions CSV
- Closure-level pool inspection outcomes by jurisdiction and year, 2018 to 2026 CSV
- Top 20 pool inspection violations, Sacramento County, 2023 to 2026 CSV
- Violation categories with MAHC sections, three jurisdictions CSV
- Spas versus pools: failure, closure and chlorine measures CSV
- Required free chlorine and pH: MAHC 2024, NYC, Texas, California, Louisville CSV
- Pool inspection failure share by calendar month, five jurisdictions CSV
- Full fact sheet with sources and limitations CSV
Evidence tiers
Tier 1: primary and government sources (23)
- Sacramento County (Environmental Management Department data, County GIS): Pool Inspections: Facilities and Inspection & Violation History
- NYC Department of Health and Mental Hygiene (DOHMH), NYC Open Data: NYC Pool Inspections (dataset 3kfa-rvez)
- City of Arlington, TX, Planning and Development Services, Health Services: Pool Inspection (Arlington Open Data)
- Louisville Metro Public Health and Wellness, Louisville Open Data: Louisville Metro KY: Pool Inspections (feature layer and data dictionary)
- Centers for Disease Control and Prevention (CDC): 2024 Model Aquatic Health Code, 5th edition (code)
- Montgomery County, MD, Department of Health and Human Services (dataMontgomery): HHS: Pool Inspection from July 2024 and onward (dataset 5zm9-xdka)
- Centers for Disease Control and Prevention (CDC): Immediate Closures and Violations Identified During Routine Inspections of Public Aquatic Facilities: Network for Aquatic Facility Inspection Surveillance, Five States, 2013 (MMWR Surveill Summ 2016;65(No. SS-5))
- Austin Public Health, City of Austin Open Data: Pool Inspections (dataset peux-uuwu)
- Montgomery County, MD, Department of Health and Human Services (dataMontgomery): Pool Inspections (dataset k35y-k582)
- Louisville Metro Public Health and Wellness, Louisville Open Data: Louisville Metro KY: Inspection Results Pools (last three scores per permitted pool)
- Louisville Metro Public Health and Wellness (GovDelivery): Check pool inspection data before you dive in (June 19, 2026 bulletin)
- Centers for Disease Control and Prevention (CDC): About The MAHC Current Edition
- NYC Department of Health and Mental Hygiene: New York City Health Code Article 165: Bathing Establishments
- Montgomery County, MD, Department of Health and Human Services: Swimming Pools (Licensing and Permits Unit)
- Texas Department of State Health Services: 25 TAC Chapter 265, Subchapter L: Public Swimming Pools and Spas
- City of Austin (Austin Public Health): Request a pool, spa, or interactive water feature inspection
- Sacramento County Environmental Management Department: Recreational Health Program: Pools and Spas
- Metro Nashville Public Health Department: Public Facilities Inspection
- Centers for Disease Control and Prevention (CDC): Violations Identified from Routine Swimming Pool Inspections: Selected States and Counties, United States, 2008 (MMWR 2010;59(19))
- Harris County Public Health (Texas): Swimming Pools & Spa Safety
- Centers for Disease Control and Prevention (CDC): What You Can Do to Stay Healthy in Hot Tubs
- Florida Department of Health: Public Swimming Pools
- DeKalb Public Health (Georgia): Inspection Scores for Public Swimming Pools, Beaches and Spas
Tier 2: trade bodies, public companies, market research (1)
References
- Sacramento County (Environmental Management Department data, County GIS). Pool Inspections: Facilities and Inspection & Violation History. Accessed 2026-10-06.
- NYC Department of Health and Mental Hygiene (DOHMH), NYC Open Data. NYC Pool Inspections (dataset 3kfa-rvez). Accessed 2026-10-06.
- City of Arlington, TX, Planning and Development Services, Health Services. Pool Inspection (Arlington Open Data). Accessed 2026-10-06.
- Louisville Metro Public Health and Wellness, Louisville Open Data. Louisville Metro KY: Pool Inspections (feature layer and data dictionary). Accessed 2026-10-06.
- Centers for Disease Control and Prevention (CDC). 2024 Model Aquatic Health Code, 5th edition (code). Accessed 2026-10-06.
- Montgomery County, MD, Department of Health and Human Services (dataMontgomery). HHS: Pool Inspection from July 2024 and onward (dataset 5zm9-xdka). Accessed 2026-10-06.
- Centers for Disease Control and Prevention (CDC). Immediate Closures and Violations Identified During Routine Inspections of Public Aquatic Facilities: Network for Aquatic Facility Inspection Surveillance, Five States, 2013 (MMWR Surveill Summ 2016;65(No. SS-5)). Accessed 2026-10-06.
- Austin Public Health, City of Austin Open Data. Pool Inspections (dataset peux-uuwu). Accessed 2026-10-06.
- Montgomery County, MD, Department of Health and Human Services (dataMontgomery). Pool Inspections (dataset k35y-k582). Accessed 2026-10-06.
- Louisville Metro Public Health and Wellness, Louisville Open Data. Louisville Metro KY: Inspection Results Pools (last three scores per permitted pool). Accessed 2026-10-06.
- Louisville Metro Public Health and Wellness (GovDelivery). Check pool inspection data before you dive in (June 19, 2026 bulletin). Accessed 2026-10-06.
- Centers for Disease Control and Prevention (CDC). About The MAHC Current Edition. Accessed 2026-10-06.
- NYC Department of Health and Mental Hygiene. New York City Health Code Article 165: Bathing Establishments. Accessed 2026-10-06.
- Montgomery County, MD, Department of Health and Human Services. Swimming Pools (Licensing and Permits Unit). Accessed 2026-10-06.
- Texas Department of State Health Services. 25 TAC Chapter 265, Subchapter L: Public Swimming Pools and Spas. Accessed 2026-10-06.
- Legal Information Institute, Cornell Law School (text of California regulation). Cal. Code Regs. Tit. 22, § 65529: Public Pool Disinfection. Accessed 2026-10-06.
- City of Austin (Austin Public Health). Request a pool, spa, or interactive water feature inspection. Accessed 2026-10-06.
- Sacramento County Environmental Management Department. Recreational Health Program: Pools and Spas. Accessed 2026-10-06.
- Metro Nashville Public Health Department. Public Facilities Inspection. Accessed 2026-10-06.
- Centers for Disease Control and Prevention (CDC). Violations Identified from Routine Swimming Pool Inspections: Selected States and Counties, United States, 2008 (MMWR 2010;59(19)). Accessed 2026-10-06.
- Harris County Public Health (Texas). Swimming Pools & Spa Safety. Accessed 2026-10-06.
- Centers for Disease Control and Prevention (CDC). What You Can Do to Stay Healthy in Hot Tubs. Accessed 2026-10-06.
- Florida Department of Health. Public Swimming Pools. Accessed 2026-10-06.
- DeKalb Public Health (Georgia). Inspection Scores for Public Swimming Pools, Beaches and Spas. Accessed 2026-10-06.
Related pool research
Public Pools by City: Pools per Resident in 99 Large US Cities, 2026
Pool Operator Certification Requirements by State: 2026 Matrix of Operator, Lifeguard and Inspection Rules

Swimming Participation Statistics: Who Swims in the US, How Often and for How Long, 2003 to 2025
Public Pool Admission Prices in 33 Large US Cities, 2026

Vacation Rentals With Pools: Share and Nightly Premium in 18 US Airbnb Markets (2026)

Pool Industry Market Size: US Revenue Estimates Reconciled, 2017 to 2026
All pool industry research (40 reports)