Pool Contractors Per Capita: A 2026 Metro Saturation Index
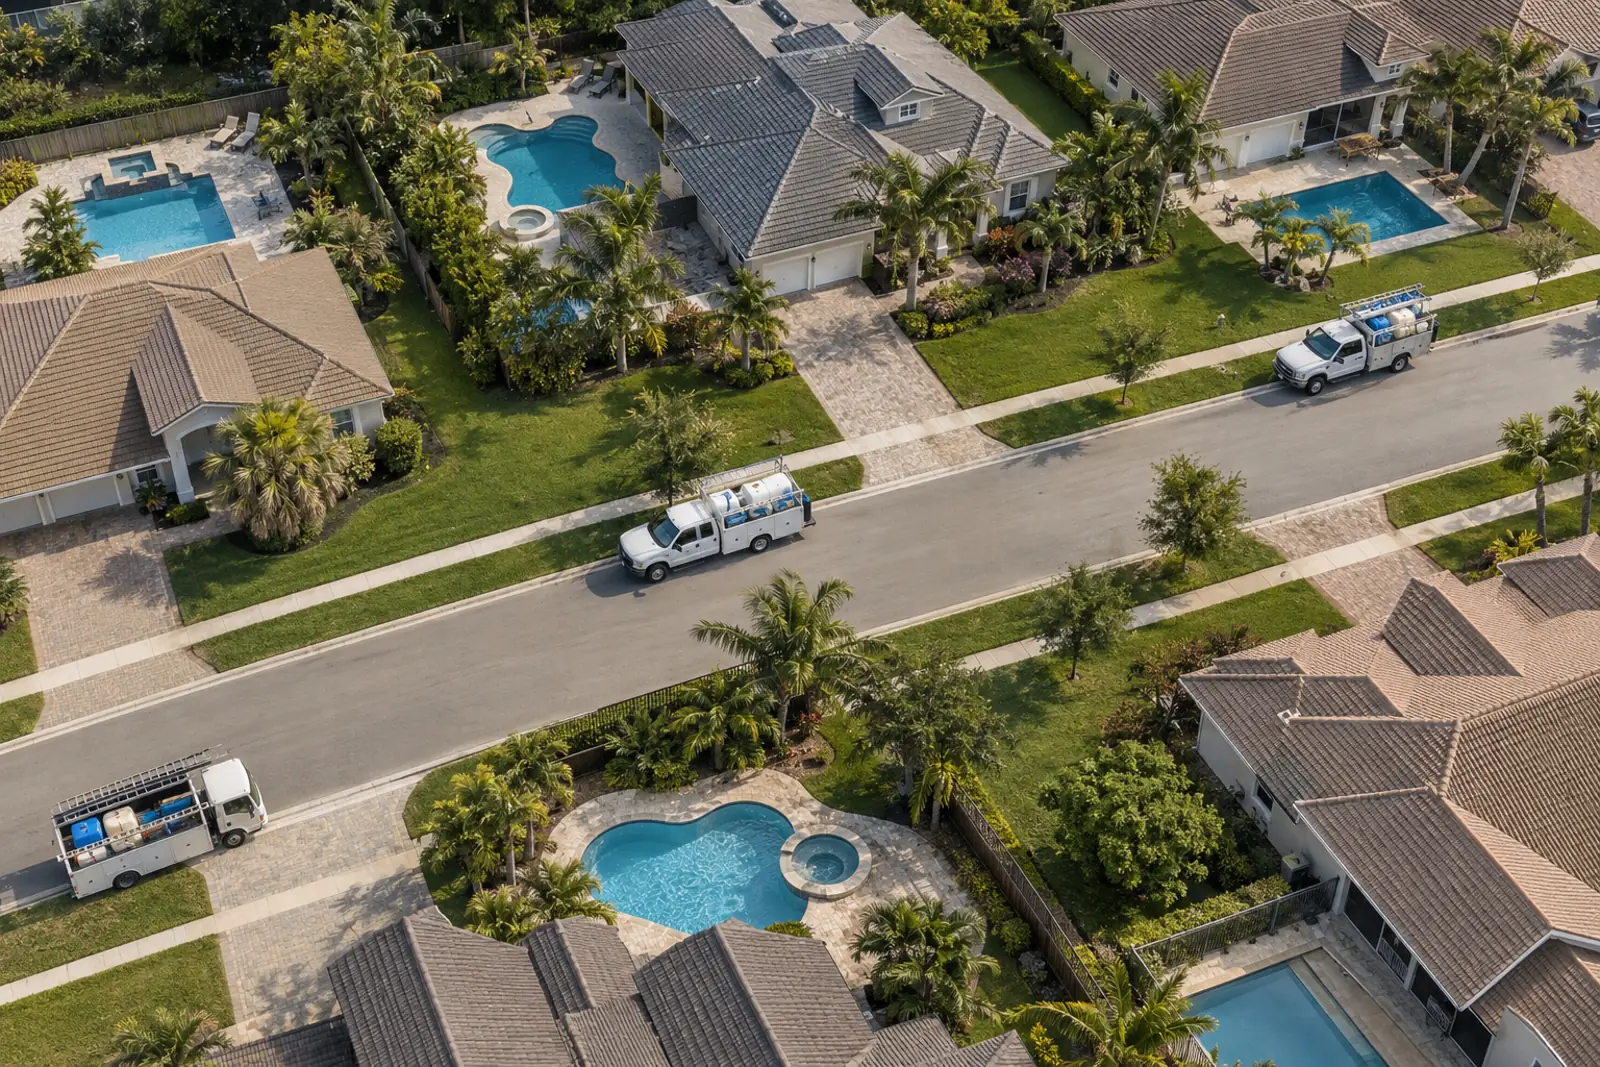
Pool contractors per capita ranged from 5.1 licensed pool businesses per 100,000 residents in San Francisco-Oakland to 36.0 in Cape Coral-Fort Myers across 14 metros in Florida, California, Arizona and Nevada in 2026. Per pool home, Phoenix (17.5 per 10,000) ran thinner than Riverside-San Bernardino (26.1). Pool homes rest on 2015 AHS shares; unlicensed cleaners are not counted.
Pool contractors per capita vs per pool home in 14 metros, 2026
Counting licensed pool businesses per resident and per pool home gives different rankings. Phoenix looks well supplied per resident but thin per pool home, because 36.8% of Phoenix houses had a pool in AHS 2015, against 20.1% in Los Angeles and 13.6% in San Francisco-Oakland. The Saturation Index uses the pool-home denominator and shows a range for the uncertainty in pool counts.
| Metro (2013 CBSA) | Pool-share source | Pool share of houses (%) | Estimated pool homes | Licensed pool builders | Licensed service-class firms | Licensed pool businesses (counted once) | Builders per 10,000 pool homes | Licensed businesses per 10,000 pool homes | Saturation Index (baseline 100) | Index low | Index high | Reading | Confidence | Licensed businesses per 100,000 residents | Roster date | Roster |
|---|---|---|---|---|---|---|---|---|---|---|---|---|---|---|---|---|
| San Diego-Carlsbad, CA | RECS 2024 state share (fallback) | 14.3 | 113400 | 251 | 233 | 456 | 22.1 | 40.2 | 193 | 166 | 231 | More crowded | Low | 13.9 | 2026-10-14 | California CSLB |
| Cape Coral-Fort Myers, FL | RECS 2024 state share (fallback) | 27.5 | 86496 | 238 | 79 | 315 | 27.5 | 36.4 | 175 | 154 | 203 | More crowded | Low | 36.0 | 2026-10-14 | Florida DBPR |
| North Port-Sarasota-Bradenton, FL | RECS 2024 state share (fallback) | 27.5 | 100970 | 213 | 104 | 310 | 21.1 | 30.7 | 148 | 130 | 171 | More crowded | Low | 32.7 | 2026-10-14 | Florida DBPR |
| Sacramento-Roseville-Arden-Arcade, CA | RECS 2024 state share (fallback) | 14.3 | 104487 | 176 | 165 | 314 | 16.8 | 30.0 | 144 | 124 | 173 | More crowded | Low | 12.7 | 2026-10-14 | California CSLB |
| Riverside-San Bernardino-Ontario, CA | AHS 2015 metro share | 22.1 | 292032 | 579 | 227 | 761 | 19.8 | 26.1 | 125 | 114 | 139 | More crowded | High | 16.0 | 2026-10-14 | California CSLB |
| Los Angeles-Long Beach-Anaheim, CA | AHS 2015 metro share | 20.1 | 556915 | 965 | 390 | 1249 | 17.3 | 22.4 | 108 | 95 | 124 | Within range | High | 9.7 | 2026-10-14 | California CSLB |
| Miami-Fort Lauderdale-West Palm Beach, FL | AHS 2015 metro share | 33.3 | 473695 | 677 | 364 | 1014 | 14.3 | 21.4 | 103 | 95 | 112 | Within range | High | 15.9 | 2026-10-14 | Florida DBPR |
| Tampa-St. Petersburg-Clearwater, FL | RECS 2024 state share (fallback) | 27.5 | 302262 | 364 | 217 | 566 | 12.0 | 18.7 | 90 | 79 | 104 | Within range | Low | 16.6 | 2026-10-14 | Florida DBPR |
| Orlando-Kissimmee-Sanford, FL | RECS 2024 state share (fallback) | 27.5 | 223670 | 267 | 142 | 403 | 11.9 | 18.0 | 87 | 76 | 100 | Within range | Low | 13.6 | 2026-10-14 | Florida DBPR |
| Phoenix-Mesa-Scottsdale, AZ | AHS 2015 metro share | 36.8 | 579999 | 541 | 494 | 1017 | 9.3 | 17.5 | 84 | 77 | 93 | Thinner | Medium | 19.4 | 2026-07-20 | Arizona ROC |
| Jacksonville, FL | RECS 2024 state share (fallback) | 27.5 | 150230 | 189 | 59 | 241 | 12.6 | 16.0 | 77 | 68 | 89 | Thinner | Low | 13.5 | 2026-10-14 | Florida DBPR |
| San Francisco-Oakland-Hayward, CA | AHS 2015 metro share | 13.6 | 151978 | 133 | 132 | 235 | 8.8 | 15.5 | 74 | 65 | 87 | Thinner | High | 5.1 | 2026-10-14 | California CSLB |
| Las Vegas-Henderson-Paradise, NV | RECS 2024 state share (fallback) | 16.1 | 104874 | 93 | 62 | 155 | 8.9 | 14.8 | 71 | 56 | 97 | Thinner | Low | 6.4 | 2026-10-14 | Nevada SCB |
| Tucson, AZ | RECS 2024 state share (fallback) | 23.7 | 87430 | 57 | 40 | 97 | 6.5 | 11.1 | 53 | 46 | 63 | Thinner | Low | 9.0 | 2026-07-20 | Arizona ROC |
Source: PC&S calculation from Florida DBPR, Arizona ROC, California CSLB, Nevada State Contractors Board rosters; Census ACS; Census population estimates; AHS 2015 and RECS 2024 pool shares (PC&S). Download CSV
Index above 100 means more licensed pool businesses per pool home than the baseline. Metros using a state pool share (RECS) are low confidence.
Source: PC&S calculation: FL DBPR, CA CSLB, NV SCB rosters (Oct 2026), AZ ROC roster (Jul 2026); Census ACS 2020-2024; AHS 2015 and RECS 2024 pool shares. Download chart data (CSV)
Riverside-San Bernardino-Ontario, CA scored 125 on the Saturation Index in October 2026, with a range of 114 to 139 (PC&S calculation; California CSLB). Riverside had 761 licensed pool businesses for an estimated 292,032 pool homes.
Los Angeles-Long Beach-Anaheim, CA scored 108 (95 to 124) and Miami-Fort Lauderdale-West Palm Beach, FL scored 103 (95 to 112) in 2026 (PC&S calculation; California CSLB; Florida DBPR). Both ranges include the baseline of 100.
Phoenix-Mesa-Scottsdale, AZ scored 84 (77 to 93) on the July 20, 2026 Arizona roster (PC&S calculation; Arizona ROC). San Francisco-Oakland-Hayward, CA scored 74 (65 to 87) in October 2026 (PC&S calculation; California CSLB).
Source: PC&S calculation from state license rosters and Census Vintage 2025 population estimates. Download chart data (CSV)
Per resident, the order changes. Phoenix had 19.4 licensed pool businesses per 100,000 residents in 2026, 2.0 times Los Angeles at 9.7 (PC&S calculation; Census population estimates). San Francisco-Oakland had 5.1 per 100,000, the lowest of 14 roster metros.
Licensed pool builders per 10,000 pool homes
Builder licenses are the most comparable supply measure across the four states, because each of the four has a pool-specific construction class. Builder density per pool home is lowest in Tucson, San Francisco-Oakland, Las Vegas and Phoenix.
Source: PC&S calculation from FL DBPR, AZ ROC, CA CSLB and NV SCB rosters; Census ACS; AHS 2015; EIA RECS 2024. Download chart data (CSV)
Riverside-San Bernardino had 19.8 licensed pool builders per 10,000 pool homes in October 2026, against 9.3 in Phoenix on the July 2026 roster (PC&S calculation; California CSLB; Arizona ROC).
The pooled builder baseline across the five AHS roster metros was 14.09 builders per 10,000 pool homes in 2026 (PC&S calculation). Miami sat close to it at 14.3 (PC&S calculation; Florida DBPR).
Florida counts certified (CPC) and registered (RP) pool/spa contractors. Florida law defines a residential pool/spa contractor’s scope as ‘the construction, repair, and servicing of a residential swimming pool’ (Florida Statutes). California counts C-53 swimming pool contractors (California CSLB); Nevada counts subclassification A-10 and its construction sub-subclasses (Nevada Legislature); Arizona counts B-5, B-6, KA-5, KA-6, A-9 and A-19 (Arizona ROC).
Metro builder pages: Phoenix pool builders, Miami pool builders, Tampa pool builders and Orlando pool builders. How licensing works in each state is covered in pool contractor license requirements by state.
New pool permits per licensed builder: where builders are busiest
The installed base is only half of the demand picture. New pool permits show where construction work is flowing now. Las Vegas and Cape Coral-Fort Myers builders carry far more new pools each than Los Angeles or San Diego builders.
| City with permit data | Metro | City new pool permits, 2025 | City households (ACS 2020-2024) | City share of metro households (%) | Permits per 10,000 city households | Metro households (ACS 2020-2024) | Licensed builders in metro | Lower bound: city permits per builder | Scaled estimate: metro new pools | Scaled estimate: new pools per builder |
|---|---|---|---|---|---|---|---|---|---|---|
| Los Angeles, CA | Los Angeles | 1093 | 1439097 | 32.0 | 7.6 | 4499409 | 965 | 1.13 | 3417 | 3.5 |
| San Diego, CA | San Diego | 232 | 530412 | 45.3 | 4.4 | 1171278 | 251 | 0.92 | 512 | 2.0 |
| Orlando, FL | Orlando | 259 | 131179 | 12.8 | 19.7 | 1022315 | 267 | 0.97 | 2018 | 7.6 |
| Cape Coral, FL | Cape Coral-Fort Myers | 1229 | 82914 | 25.3 | 148.2 | 327803 | 238 | 5.16 | 4859 | 20.4 |
| Mesa, AZ | Phoenix | 329 | 198498 | 10.5 | 16.6 | 1892613 | 541 | 0.61 | 3137 | 5.8 |
| Las Vegas, NV | Las Vegas | 527 | 247741 | 28.7 | 21.3 | 862518 | 93 | 5.67 | 1835 | 19.7 |
Source: PC&S calculation from PC&S city permit counts, Census ACS and state rosters (Florida DBPR, Arizona ROC, California CSLB, Nevada State Contractors Board). Download CSV
Scaled estimates assume the permit city's per-household rate applies metro-wide; lower bounds are in the table.
Source: PC&S calculation from city permit counts (PC&S pool construction statistics), Census ACS 2020-2024 and state rosters. Download chart data (CSV)
The city of Las Vegas issued 527 new residential pool permits in 2025 (PC&S permit analysis). The Las Vegas metro had 93 licensed pool builders in October 2026, a lower bound of 5.67 city permits per builder (PC&S calculation; Nevada State Contractors Board).
Scaled to all metro households, Las Vegas builders handled an estimated 19.7 new pools each in 2025 (PC&S calculation). Cape Coral-Fort Myers builders handled an estimated 20.4 each (PC&S calculation; PC&S permit analysis).
Los Angeles builders handled an estimated 3.5 new pools each and San Diego builders 2.0 in 2025 (PC&S calculation). Phoenix, scaled from Mesa permits, came to 5.8 and Orlando to 7.6 (PC&S calculation).
Pool service supply where no roster exists: Census business counts in 34 metros
Routine pool cleaning falls outside the licensed service classes, so rosters undercount service supply, and Texas has no state pool license at all. Census counts businesses in NAICS 561790, a category that includes swimming pool cleaning. The category grows with pool share across metros, but it also includes gutter, chimney and duct cleaning, so it is a proxy, not a pool count.
| Metro (2013 CBSA) | Pool-share source | Pool share of houses (%) | Estimated pool homes | Nonemployers, NAICS 561790 (2024) | Employer establishments, NAICS 561790 (2023) | Total 561790 businesses | Nonemployer share (%) | 561790 businesses per 10,000 pool homes | 561790 businesses per 10,000 houses | State pool roster available |
|---|---|---|---|---|---|---|---|---|---|---|
| Miami-Fort Lauderdale-West Palm Beach, FL | AHS 2015 metro | 33.3 | 473695 | 11067 | 872 | 11939 | 92.7 | 252.0 | 83.9 | Yes |
| New York-Newark-Jersey City, NY-NJ-PA | AHS 2015 metro | 14.2 | 518065 | 10239 | 1083 | 11322 | 90.4 | 218.5 | 31.0 | No |
| Milwaukee-Waukesha-West Allis, WI | AHS 2015 metro | 5.4 | 22837 | 431 | 63 | 494 | 87.2 | 216.3 | 11.7 | No |
| Chicago-Naperville-Elgin, IL-IN-WI | AHS 2015 metro | 7.2 | 172502 | 2841 | 374 | 3215 | 88.4 | 186.4 | 13.4 | No |
| Denver-Aurora-Lakewood, CO | AHS 2015 metro | 7.1 | 61466 | 933 | 151 | 1084 | 86.1 | 176.4 | 12.5 | No |
| San Diego-Carlsbad, CA | RECS 2024 state | 14.3 | 113400 | 1657 | 274 | 1931 | 85.8 | 170.3 | 24.4 | Yes |
| Seattle-Tacoma-Bellevue, WA | AHS 2015 metro | 5.2 | 56734 | 711 | 199 | 910 | 78.1 | 160.4 | 8.3 | No |
| Cleveland-Elyria, OH | AHS 2015 metro | 8.2 | 57776 | 837 | 77 | 914 | 91.6 | 158.2 | 13.0 | No |
| Portland-Vancouver-Hillsboro, OR-WA | AHS 2015 metro | 5.8 | 42924 | 533 | 123 | 656 | 81.2 | 152.8 | 8.9 | No |
| Los Angeles-Long Beach-Anaheim, CA | AHS 2015 metro | 20.1 | 556915 | 7493 | 584 | 8077 | 92.8 | 145.0 | 29.2 | Yes |
| Las Vegas-Henderson-Paradise, NV | RECS 2024 state | 16.1 | 104874 | 1261 | 254 | 1515 | 83.2 | 144.5 | 23.3 | Yes |
| Cape Coral-Fort Myers, FL | RECS 2024 state | 27.5 | 86496 | 1024 | 218 | 1242 | 82.4 | 143.6 | 39.5 | Yes |
| Houston-The Woodlands-Sugar Land, TX | AHS 2015 metro | 17.5 | 354055 | 4622 | 426 | 5048 | 91.6 | 142.6 | 25.0 | No |
| Detroit-Warren-Dearborn, MI | AHS 2015 metro | 8.9 | 135865 | 1715 | 157 | 1872 | 91.6 | 137.8 | 12.3 | No |
| Kansas City, MO-KS | AHS 2015 metro | 7.8 | 57440 | 671 | 109 | 780 | 86.0 | 135.8 | 10.6 | No |
| Boston-Cambridge-Newton, MA-NH | AHS 2015 metro | 9.8 | 109117 | 1245 | 216 | 1461 | 85.2 | 133.9 | 13.1 | No |
| New Orleans-Metairie, LA | AHS 2015 metro | 11.4 | 47223 | 545 | 56 | 601 | 90.7 | 127.3 | 14.5 | No |
| Dallas-Fort Worth-Arlington, TX | AHS 2015 metro | 15.3 | 331380 | 3626 | 512 | 4138 | 87.6 | 124.9 | 19.1 | No |
| Orlando-Kissimmee-Sanford, FL | RECS 2024 state | 27.5 | 223670 | 2358 | 362 | 2720 | 86.7 | 121.6 | 33.4 | Yes |
| North Port-Sarasota-Bradenton, FL | RECS 2024 state | 27.5 | 100970 | 903 | 251 | 1154 | 78.2 | 114.3 | 31.4 | Yes |
| Washington-Arlington-Alexandria, DC-VA-MD-WV | AHS 2015 metro | 12.4 | 204550 | 2045 | 251 | 2296 | 89.1 | 112.2 | 13.9 | No |
| Atlanta-Sandy Springs-Roswell, GA | AHS 2015 metro | 14.2 | 264536 | 2657 | 293 | 2950 | 90.1 | 111.5 | 15.8 | No |
| Raleigh, NC | AHS 2015 metro | 11.9 | 56340 | 527 | 93 | 620 | 85.0 | 110.0 | 13.1 | No |
| Riverside-San Bernardino-Ontario, CA | AHS 2015 metro | 22.1 | 292032 | 2792 | 306 | 3098 | 90.1 | 106.1 | 23.4 | Yes |
| Tampa-St. Petersburg-Clearwater, FL | RECS 2024 state | 27.5 | 302262 | 2684 | 432 | 3116 | 86.1 | 103.1 | 28.3 | Yes |
| San Francisco-Oakland-Hayward, CA | AHS 2015 metro | 13.6 | 151978 | 1339 | 169 | 1508 | 88.8 | 99.2 | 13.5 | Yes |
| Memphis, TN-MS-AR | AHS 2015 metro | 11.8 | 52739 | 480 | 36 | 516 | 93.0 | 97.8 | 11.5 | No |
| Sacramento-Roseville-Arden-Arcade, CA | RECS 2024 state | 14.3 | 104487 | 822 | 192 | 1014 | 81.1 | 97.0 | 13.9 | Yes |
| Philadelphia-Camden-Wilmington, PA-NJ-DE-MD | AHS 2015 metro | 11.0 | 213386 | 1475 | 309 | 1784 | 82.7 | 83.6 | 9.2 | No |
| Cincinnati, OH-KY-IN | AHS 2015 metro | 12.5 | 88316 | 667 | 61 | 728 | 91.6 | 82.4 | 10.3 | No |
| Jacksonville, FL | RECS 2024 state | 27.5 | 150230 | 1074 | 162 | 1236 | 86.9 | 82.3 | 22.6 | Yes |
| Tucson, AZ | RECS 2024 state | 23.7 | 87430 | 471 | 95 | 566 | 83.2 | 64.7 | 15.3 | Yes |
| Pittsburgh, PA | AHS 2015 metro | 11.7 | 105001 | 604 | 61 | 665 | 90.8 | 63.3 | 7.4 | No |
| Phoenix-Mesa-Scottsdale, AZ | AHS 2015 metro | 36.8 | 579999 | 2892 | 719 | 3611 | 80.1 | 62.3 | 22.9 | Yes |
Source: PC&S calculation from Census Nonemployer Statistics (2024), Census County Business Patterns (2023), Census ACS and pool shares from PC&S homes-with-pools analysis. Download CSV
Source: PC&S calculation from Census NES 2024, CBP 2023 and ACS 2020-2024. Download chart data (CSV)
Across 25 AHS metros, NAICS 561790 businesses per 10,000 houses tracked the single-family pool share with a Pearson correlation of 0.72 and a rank correlation of 0.77 (PC&S calculation; Census Nonemployer Statistics; Census County Business Patterns; PC&S homes-with-pools analysis).
Each extra percentage point of pool share went with 1.39 more 561790 businesses per 10,000 houses, or about 139 per 10,000 extra pool homes (PC&S calculation). Without Miami the slope falls to 0.63, about 63 per 10,000 pool homes (PC&S calculation).
Houston had 142.6 NAICS 561790 businesses per 10,000 pool homes and Dallas-Fort Worth 124.9 in 2023 to 2024 (PC&S calculation; Census Nonemployer Statistics; Census County Business Patterns). Texas has no state pool builder license (PC&S license requirements analysis), so these Census counts are the only uniform supply measure for Houston and Dallas.
Phoenix had 62.3 NAICS 561790 businesses per 10,000 pool homes, the lowest of the 34 metros, while Miami had 252.0 (PC&S calculation; Census Nonemployer Statistics; Census County Business Patterns).
How many pool companies are there in the US: what each count measures
No federal statistic counts pool companies. Each available number measures something different: market research models, a broad Census category, a distributor’s customer list or state licenses. They should not be added together.
| Measure | Count | Year | Source | What it counts | Tier |
|---|---|---|---|---|---|
| Swimming pool construction businesses (IBISWorld estimate) | 22,731 | 2026 | IBISWorld | Market research model; method not public | 2 |
| Swimming pool cleaning services businesses (IBISWorld estimate) | 78,817 | 2025 | IBISWorld | Market research model; method not public | 2 |
| Nonemployer businesses, NAICS 561790 (includes pool cleaning) | 146,860 | 2024 | Census Nonemployer Statistics | Every self-employed filer in the category, not only pool firms | 1 |
| Employer establishments, NAICS 561790 | 18,069 | 2023 | Census County Business Patterns | Establishments with payroll; mixed category | 1 |
| Pool Corporation customers | approximately 125,000 | 2025 | Pool Corporation 10-K | Contractors, professional pool servicers and specialty retailers (company statement) | 2 |
| Licensed pool construction businesses, FL + CA + AZ + NV | 6,590 | Jul to Oct 2026 | State rosters (PC&S count) | Four states only | 1 |
| Licensed pool service-class businesses, FL + CA + AZ + NV | 3,738 | Jul to Oct 2026 | State rosters (PC&S count) | Licensing of pure cleaning is not required in most cases | 1 |
Sources: IBISWorld; IBISWorld; Census Nonemployer Statistics; Census County Business Patterns; Pool Corporation 10-K; state rosters (Florida DBPR, Arizona ROC, California CSLB, Nevada State Contractors Board). Download CSV
| State | Roster | Roster date | Construction classes | Active construction licenses | Distinct construction businesses | Service or repair classes | Active service-class licenses | Distinct service-class businesses |
|---|---|---|---|---|---|---|---|---|
| FL | Florida DBPR | 2026-10-14 | CPC/RP class A, B or none | 3052 | 2904 | CPC/RP class C; SCC RPS | 1527 | 1460 |
| CA | California CSLB | 2026-10-14 | C-53 | 2848 | 2839 | C-61/D-35 | 1624 | 1623 |
| AZ | Arizona ROC | 2026-07-20 | A-9, A-19, B-5, B-5R, B-6, KA-5, KA-6 | 755 | 721 | R-6, C-6, CR-6 | 593 | 578 |
| NV | Nevada SCB | 2026-10-14 | A-10, A-10a, A-10b, A-10d | 126 | 126 | A-10c, A-10e | 77 | 77 |
| TX | None (no state license) | None | None |
Sources: Florida DBPR; California CSLB; Arizona ROC; Nevada State Contractors Board; Texas Governor’s Office. Distinct businesses are a PC&S count. Download CSV
IBISWorld estimated 22,731 swimming pool construction businesses in 2026 (IBISWorld) and 78,817 swimming pool cleaning businesses in 2025 (IBISWorld). Both are model estimates.
Pool Corporation, which describes itself as the world’s largest wholesale distributor of swimming pool supplies, reported approximately 125,000 customers in its 2025 10-K, ‘the majority of whom are small, entrepreneurial, family-owned businesses’ (Pool Corporation 10-K). The company says they operate as ‘independent contractors, professional pool servicers or specialty retailers’, so the figure is broader than pool contractors.
Market totals are covered in pool industry market size and the installed base in number of swimming pools in the US.
Why Google Maps listing counts do not measure pool market saturation
Counting map listings is a tempting shortcut for judging a crowded market. A 34-metro test shows two problems: pool-specialist listings filled at least 23 of the first 30 slots in every metro, and a large share of results returned through a location-targeted API came from other states.
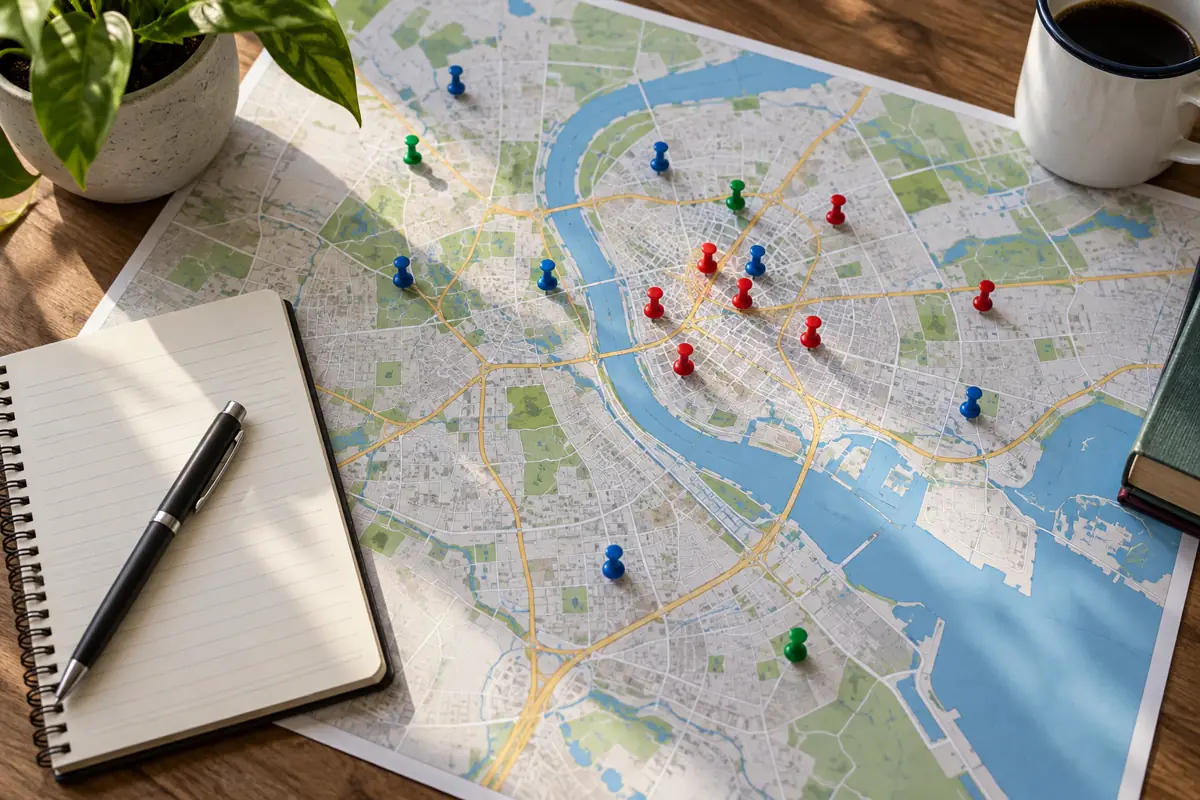
PC&S requested the first 30 ‘pool service’ listings and the first 10 ‘pool builder’ listings for the principal city of each of 34 metros on October 14, 2026 (Google Maps via Serper). The sample returned 992 ‘pool service’ listings, of which 965 carried a pool-specialist category.
In 14 of 34 metros, every ‘pool service’ listing returned (up to 30) had a pool-specialist category, and no metro fell below 89.7% (Google Maps via Serper). Boston and Kansas City, with low pool shares, reached 100% like Phoenix. Listing depth therefore does not separate a crowded market from a thin one.
Of 1,011 listings that carried a street address, 31.3% were in a different state than the city requested (PC&S calculation; Google Maps via Serper). A re-test with the city named in the query returned 13 of 13 addressed listings in the right state.
| Metro | Requested location | 'Pool service' listings (3 pages) | Pool-specialist category (%) | Listings with address | Addressed listings in requested state | 'Pool builder' listings with address (page 1) | 'Pool builder' addressed listings in requested state |
|---|---|---|---|---|---|---|---|
| Phoenix | Phoenix, Arizona, United States | 28 | 100.0 | 21 | 21 | 7 | 7 |
| Miami | Miami, Florida, United States | 29 | 100.0 | 19 | 19 | 8 | 8 |
| Riverside-San Bernardino | Riverside, California, United States | 30 | 100.0 | 20 | 5 | 10 | 10 |
| Los Angeles | Los Angeles, California, United States | 27 | 100.0 | 25 | 25 | 10 | 10 |
| San Francisco-Oakland | San Francisco, California, United States | 29 | 93.1 | 18 | 18 | 9 | 9 |
| Houston | Houston, Texas, United States | 30 | 100.0 | 26 | 20 | 9 | 0 |
| Dallas-Fort Worth | Dallas, Texas, United States | 29 | 96.6 | 24 | 24 | 10 | 10 |
| Atlanta | Atlanta, Georgia, United States | 29 | 96.6 | 21 | 0 | 10 | 0 |
| New York | New York, New York, United States | 29 | 96.6 | 22 | 10 | 10 | 5 |
| Cincinnati | Cincinnati, Ohio, United States | 29 | 89.7 | 23 | 11 | 10 | 0 |
| Washington DC | Washington, District of Columbia, United States | 29 | 96.6 | 26 | 1 | 10 | 0 |
| Raleigh | Raleigh, North Carolina, United States | 30 | 96.7 | 24 | 5 | 10 | 0 |
| Memphis | Memphis, Tennessee, United States | 30 | 100.0 | 20 | 13 | 10 | 0 |
| Pittsburgh | Pittsburgh, Pennsylvania, United States | 30 | 96.7 | 18 | 9 | 8 | 8 |
| New Orleans | New Orleans, Louisiana, United States | 30 | 93.3 | 17 | 0 | 8 | 0 |
| Philadelphia | Philadelphia, Pennsylvania, United States | 30 | 100.0 | 22 | 17 | 10 | 7 |
| Boston | Boston, Massachusetts, United States | 30 | 100.0 | 22 | 8 | 9 | 9 |
| Detroit | Detroit, Michigan, United States | 30 | 96.7 | 12 | 12 | 9 | 0 |
| Cleveland | Cleveland, Ohio, United States | 30 | 96.7 | 12 | 0 | 9 | 9 |
| Kansas City | Kansas City, Missouri, United States | 30 | 100.0 | 15 | 12 | 9 | 0 |
| Chicago | Chicago, Illinois, United States | 24 | 95.8 | 12 | 3 | 9 | 8 |
| Denver | Denver, Colorado, United States | 30 | 96.7 | 23 | 23 | 9 | 0 |
| Portland | Portland, Oregon, United States | 30 | 96.7 | 18 | 15 | 6 | 6 |
| Milwaukee | Milwaukee, Wisconsin, United States | 26 | 92.3 | 21 | 21 | 6 | 0 |
| Seattle | Seattle, Washington, United States | 27 | 92.6 | 18 | 18 | 7 | 7 |
| Tampa | Tampa, Florida, United States | 30 | 96.7 | 23 | 9 | 8 | 8 |
| Orlando | Orlando, Florida, United States | 30 | 100.0 | 27 | 27 | 9 | 9 |
| Jacksonville | Jacksonville, Florida, United States | 30 | 96.7 | 21 | 21 | 9 | 9 |
| North Port-Sarasota | Sarasota, Florida, United States | 29 | 96.6 | 22 | 22 | 10 | 10 |
| Cape Coral-Fort Myers | Cape Coral, Florida, United States | 30 | 93.3 | 23 | 23 | 10 | 10 |
| San Diego | San Diego, California, United States | 29 | 100.0 | 29 | 29 | 9 | 9 |
| Sacramento | Sacramento, California, United States | 30 | 100.0 | 23 | 23 | 7 | 7 |
| Las Vegas | Las Vegas, Nevada, United States | 30 | 100.0 | 18 | 14 | 10 | 10 |
| Tucson | Tucson, Arizona, United States | 29 | 100.0 | 24 | 24 | 8 | 8 |
Source: PC&S calculation from Google Maps results returned by Serper.dev; counts only, no business names. Download CSV
Consolidation pressure in pool service markets
Florida and California, the two largest rosters in this report, also lead the PC&S acquisitions registry. Consolidation reduces the number of independent firms without changing the number of pools.
The PC&S acquisitions registry counted 10 entries naming Florida, 9 naming California, 7 naming Arizona, 6 naming Texas and 1 naming Nevada from 2015 to October 6, 2026 (PC&S acquisitions registry).
SPS PoolCare reported more than 220 acquisitions since its 2021 founding and more than 50,000 weekly recurring customers across Texas, Florida, Arizona, Nevada and Georgia as of July 7, 2026 (SPS PoolCare).
Deal-level detail is in pool industry acquisitions; route sales are covered on pool routes for sale.
Scenarios we modeled
Licensed pool contractors per 10,000 pool homes
How many licensed pool businesses serve each metro’s stock of pools?
distinct licensed pool businesses (builder or service class, counted once) / (pool share x ACS houses) x 10,000Inputs: fact rows for roster counts, ACS houses and pool shares per metro; derived rows for pool homes (see derived.csv, 'Licensed pool businesses per 10,000 pool homes')
Limitations: Pool shares are from AHS 2015; nine metros use the state RECS 2024 share; service licensing rules differ by state; mailing addresses.
New pool permits per licensed builder
Where does each licensed builder have the most new construction to share?
lower bound = city permits 2025 / metro builders; scaled = (city permits / city households) x metro households / metro buildersInputs: city permit and household rows (r21), metro household rows (r13), builder rows (rosters); derived 'Scaled: estimated metro new pools per licensed builder'
Limitations: Six cities only; city rate may not represent the metro; 2025 permits against 2026 rosters.
Service businesses per 10,000 pool homes (Census proxy in place of listings)
How dense is pool service supply where rosters do not count cleaners?
(Census Nonemployer Statistics 2024 + County Business Patterns 2023, NAICS 561790) / pool homes x 10,000Inputs: NES and CBP rows per metro; pool-home derived rows; correlation rows
Limitations: 561790 mixes pool cleaning with other building services; association only; Miami is an outlier.
Pool Market Saturation Index ranking with confidence
Which metros look crowded or thin relative to a common baseline?
licensed businesses per 10,000 pool homes / 20.81 x 100; range from the 90% interval of the pool share; reading = More crowded if the low end exceeds 100, Thinner if the high end is below 100Inputs: derived baseline row and per-metro ratio rows
Limitations: Baseline is relative, not an optimum; Arizona roster is from July 2026; Texas and other non-roster states cannot be indexed.
Per capita versus per pool home
Does a per-resident count give the same answer as a per-pool-home count?
licensed businesses / population x 100,000, compared with licensed businesses per 10,000 pool homesInputs: population rows (r16), roster rows, derived ratios
Limitations: Population is July 1, 2025; per-capita ratios ignore how many residents own pools.
What the comparison shows
- Florida had 2,904 distinct businesses holding an active pool/spa construction license on October 14, 2026 (Florida DBPR).
- California had 2,839 distinct C-53 swimming pool contractor businesses on October 14, 2026 (California CSLB).
- Riverside-San Bernardino had 26.1 licensed pool businesses per 10,000 pool homes in 2026, the highest of the five metros with metro-level pool data (PC&S calculation; California CSLB; PC&S homes-with-pools analysis).
- Phoenix had 17.5 licensed pool businesses per 10,000 pool homes in 2026, a Saturation Index of 84, below the five-metro baseline (PC&S calculation; Arizona ROC).
- Per resident, Phoenix had 19.4 licensed pool businesses per 100,000 people in 2026, 2.0 times Los Angeles at 9.7 (PC&S calculation; Census population estimates).
- Las Vegas builders handled an estimated 19.7 new pools each in 2025, against 3.5 in Los Angeles and 2.0 in San Diego (PC&S calculation; PC&S permit analysis; Nevada State Contractors Board).
- Of 1,011 Google Maps listings with an address in a 34-metro sample on October 14, 2026, 31.3% sat in a different state than the city requested (Google Maps via Serper).
- Texas has no state pool builder license (2026), so Houston and Dallas-Fort Worth can only be measured with Census business counts (PC&S license requirements analysis; Texas Governor’s Office).
Results
- Riverside-San Bernardino-Ontario, CA had 761 licensed pool businesses for an estimated 292,032 pool homes in 2026, 26.1 per 10,000 (PC&S calculation; California CSLB).
- Los Angeles-Long Beach-Anaheim, CA had 1,249 licensed pool businesses and 22.4 per 10,000 pool homes in 2026, an index of 108 with a range of 95 to 124 (PC&S calculation; California CSLB).
- Miami-Fort Lauderdale-West Palm Beach, FL had 1,014 licensed pool businesses and 21.4 per 10,000 pool homes in 2026, an index of 103 (PC&S calculation; Florida DBPR).
- Phoenix-Mesa-Scottsdale, AZ had 541 licensed pool builders for an estimated 579,999 pool homes, or 1,072 pool homes per builder, as of the July 20, 2026 roster (PC&S calculation; Arizona ROC).
- San Francisco-Oakland-Hayward, CA had 1,143 pool homes per licensed builder and an index of 74 in 2026 (PC&S calculation; California CSLB).
- Las Vegas-Henderson-Paradise, NV had 93 licensed pool builders in the Nevada directory on October 14, 2026, 8.9 per 10,000 pool homes on a state-level pool share (low confidence) (PC&S calculation; Nevada State Contractors Board).
- Cape Coral-Fort Myers, FL had 36.0 licensed pool businesses per 100,000 residents in 2026, the most of 14 roster metros (PC&S calculation; Florida DBPR; Census population estimates).
- Cape Coral issued 1,229 new residential pool permits in 2025, which scales to an estimated 20.4 new pools per licensed builder in the metro (PC&S permit analysis; PC&S calculation).
- Los Angeles issued 1,093 new pool permits in 2025, a lower bound of 1.13 permits per licensed builder in the metro and a scaled estimate of 3.5 (PC&S permit analysis; PC&S calculation).
- Across 25 metros, NAICS 561790 businesses per 10,000 houses rose with the AHS pool share (Pearson r 0.72, 2023 to 2024 business data) (Census Nonemployer Statistics; Census County Business Patterns; PC&S calculation).
- Miami had 83.9 NAICS 561790 businesses per 10,000 houses in 2023 to 2024, more than any other of the 34 metros (Census Nonemployer Statistics; Census County Business Patterns).
- The United States had 146,860 nonemployer businesses in NAICS 561790 in 2024, the category that includes swimming pool cleaning (Census Nonemployer Statistics).
- Pool Corporation estimated just below 60,000 new in-ground pools were built in the United States in 2025, down from 62,000 in 2024 (Pool Corporation 10-K).
- IBISWorld estimated 22,731 swimming pool construction businesses in the United States in 2026 (IBISWorld).
Questions owners ask
How many pool companies are there in the US?
No official count exists. IBISWorld estimates 22,731 swimming pool construction businesses (2026) and 78,817 pool cleaning businesses (2025) (IBISWorld; IBISWorld). Census counts 146,860 nonemployers in NAICS 561790, the category that includes pool cleaning, in 2024 (Census Nonemployer Statistics). Four state rosters list 6,590 licensed pool construction businesses (FL, CA, AZ, NV, 2026).
Is the pool service business saturated?
It depends on the metro. Per pool home, Riverside-San Bernardino had 26.1 licensed pool businesses per 10,000 pool homes in 2026, while Phoenix had 17.5 and San Francisco-Oakland 15.5 (PC&S calculation). Florida’s licensed scope covers cleaning only when it ‘requires at least a partial disassembling’ (Florida Statutes), so cleaning-only firms are largely missing from rosters and service supply is undercounted.
Which city is best to start a pool business?
The data point to where supply is thin relative to pools, not to a single best city. Phoenix (index 84) and San Francisco-Oakland (74) had fewer licensed pool businesses per pool home than the five-metro baseline in 2026, and Las Vegas builders handled an estimated 19.7 new pools each in 2025 (PC&S calculation). This is not business advice.
How many pool builders are in Florida?
Florida had 3,052 active, current pool/spa contractor licenses in classes A and B (or no class code), held by 2,904 distinct businesses, in the October 14, 2026 DBPR extract (Florida DBPR). Another 1,460 businesses held a pool/spa servicing license.
Are there too many pool companies in Phoenix?
Not by the license count. The Phoenix metro had 541 licensed pool builders and 494 service-class firms on the July 20, 2026 Arizona roster, 17.5 licensed businesses per 10,000 pool homes and an index of 84 (77 to 93) (Arizona ROC; PC&S calculation). Phoenix had 1,072 pool homes per licensed builder. Per resident it looks busier: 19.4 per 100,000.
Prices and rules used
- Florida DBPR construction licensee extract, California CSLB C-53 and D-35 lists and the Nevada contractor directory were downloaded on October 14, 2026 (Florida DBPR; California CSLB; Nevada State Contractors Board).
- Arizona ROC posting list dated July 20, 2026 used; the live file returned HTTP 403 on October 14, 2026, so the Wayback Machine copy was used (Arizona ROC).
- SPS PoolCare reported more than 220 acquisitions since its 2021 founding and more than 50,000 recurring customers (SPS PoolCare).
- Census Nonemployer Statistics 2024 county file (file date June 4, 2026) is the latest release used (Census Nonemployer Statistics).
- Pool Corporation’s 10-K for 2025 put new in-ground pool construction at just below 60,000 units (Pool Corporation 10-K).
- 2025 is the latest full year of city pool permit counts (PC&S permit analysis). County Business Patterns 2023 is the latest CBP release; CBP 2024 was not posted on October 14, 2026 (Census County Business Patterns).
More questions
What are pool contractors per capita in Los Angeles?
The Los Angeles-Long Beach-Anaheim metro had 9.7 licensed pool businesses per 100,000 residents and 17.3 licensed builders per 10,000 pool homes in 2026 (PC&S calculation; California CSLB).
How many licensed pool contractors are in the Miami metro?
The Miami-Fort Lauderdale-West Palm Beach metro had 677 licensed pool builders and 364 service-class businesses, 1,014 counted once, in the October 14, 2026 Florida extract (Florida DBPR).
How many pool builders are licensed in California?
California had 2,848 active C-53 swimming pool contractor licenses held by 2,839 distinct businesses on October 14, 2026 (California CSLB).
How many pool contractors are licensed in Nevada?
Nevada’s contractor directory listed 126 businesses with an A-10 pool construction subclass and 77 with A-10c or A-10e repair and maintenance on October 14, 2026 (Nevada State Contractors Board).
How many licensed pool companies are in Arizona?
The July 20, 2026 Arizona ROC posting list had 755 active pool construction licenses (721 businesses) and 593 pool service and repair licenses (578 businesses) (Arizona ROC).
Does Texas license pool contractors?
No. Texas has no pool builder license and leaves contractor licensing to cities and counties (PC&S license requirements analysis); the Texas Governor’s 2026-2027 guide says ‘General contractors are not required to obtain a license to practice in Texas’ (Texas Governor’s Office).
How many new pools does a pool builder build per year?
It varies by metro. Scaled from 2025 city permits, estimates ran from 2.0 new pools per licensed builder in San Diego to 20.4 in Cape Coral-Fort Myers (PC&S calculation; PC&S permit analysis).
How many pool homes does one pool builder serve in Phoenix?
Phoenix had 1,072 estimated pool homes per licensed pool builder in 2026, against 504 in Riverside-San Bernardino (PC&S calculation; Arizona ROC; California CSLB).
How many new pools were built in the US in 2025?
Pool Corporation estimated just below 60,000 new in-ground pools in 2025, down from 62,000 in 2024 (Pool Corporation 10-K).
Are Google Maps counts a good way to measure pool competition?
Not on their own. In a 34-metro test on October 14, 2026, 31.3% of addressed listings came from a different state than requested (PC&S calculation; Google Maps via Serper).
Inputs, formulas and caveats
- Downloaded the Florida DBPR construction licensee extract (October 14, 2026, through a US connection), the California CSLB C-53 and C-61/D-35 lists (October 14, 2026) and the Nevada SCB active directory for classifications A and AB (current October 14, 2026). Arizona’s live posting list returned HTTP 403, so the July 20, 2026 file was taken from the Wayback Machine.
- Kept active licenses in pool construction classes (FL CPC/RP class A, B or none; CA C-53; AZ A-9, A-19, B-5, B-5R, B-6, KA-5, KA-6; NV A-10, A-10a, A-10b, A-10d) and pool service or repair classes (FL CPC/RP class C and SCC RPS; CA D-35; AZ R-6, C-6, CR-6; NV A-10c, A-10e).
- Deduplicated to distinct businesses by normalised business name (DBA where present) plus ZIP; a business holding both class types counts once in the combined total.
- Assigned each business to a county by its address ZIP (2020 ZCTA to county file, largest land overlap), with fallbacks to the roster’s county field and the modal county of the ZIP3; then to a 2013 CBSA. Florida ZIP-derived counties matched DBPR county codes for 98.5% of rows.
- Estimated pool homes as the metro pool share times ACS 2020-2024 houses (one-unit detached, attached and mobile homes). Pool shares: AHS 2015 metro share of single-family and mobile homes with a pool (25 metros, PC&S tabulation with 90% intervals); EIA RECS 2024 state share for the nine roster metros outside the AHS sample.
- Computed licensed businesses per 10,000 pool homes and per 100,000 residents (Census Vintage 2025), and the Saturation Index against the pooled ratio of the five metros with both a roster and an AHS share (20.81 per 10,000).
- Computed new pools per licensed builder from 2025 city permit counts (PC&S pool construction statistics), as a city-only lower bound and as a household-scaled metro estimate.
- Summed Census Nonemployer Statistics 2024 and County Business Patterns 2023 counts for NAICS 561790 over each metro’s counties and correlated them with pool share across 25 AHS metros.
- Ran 142 Serper /places queries (34 metros, ‘pool service’ pages 1 to 3 and ‘pool builder’ page 1, plus tests) and audited where the returned listings were located. Only aggregate counts were kept.
- Opened the top Google results for ‘pool contractors per capita’ and ‘pool service business saturated’ and compared their figures and sources.
Included: State license rosters published by the licensing boards, Census and OMB files, federal survey tabulations (AHS, RECS), city permit records, a public company 10-K, market research estimates labelled as such, and a listing sample labelled Tier 3.
Excluded: Business names, addresses and license numbers (never published); unverified listing-derived state counts on blogs; Facebook and Reddit threads that could not be read; listing counts as a supply measure after the location audit. Details in excluded.md.
Conflicting numbers: Supply measures are never mixed in one ratio. Licensed counts (rosters), Census establishment counts (NAICS 561790) and model estimates (IBISWorld) are shown side by side with their definitions. AHS and RECS pool shares are not averaged; each metro uses one, labelled.
Derived metrics: All ratios, intervals, the index, permit-per-builder estimates and correlations are computed by the scripts in scripts/ (supply_by_metro.py, build_index.py, places_sample.py) and listed in derived.csv with formulas and input rows.
Caveats
- Pool shares for the five AHS roster metros are from 2015; pools built since then are not in the denominator, which overstates contractors per pool home where pools grew fastest.
- Nine roster metros use a statewide RECS 2024 pool share; their index values are low confidence.
- Routine pool cleaning sits outside the counted service classes (Florida names cleaning that requires partial disassembly), so licensed service-class counts undercount service supply.
- Rosters list mailing addresses; firms working across metro lines are counted where they are registered.
- The Arizona roster is from July 20, 2026, about three months older than the others.
- Permit-based estimates rely on one city per metro.
- NAICS 561790 also covers chimney, gutter, duct and exterior cleaning.
Method last reviewed October 14, 2026.
Press and citation
Quotable results
- Riverside-San Bernardino had 26.1 licensed pool businesses per 10,000 pool homes in 2026, the most of five US metros with metro-level pool data. (California Contractors State License Board (CSLB))
- Phoenix had 1,072 homes with a pool for every licensed pool builder in 2026. (Arizona Registrar of Contractors)
- Phoenix had 19.4 licensed pool businesses per 100,000 residents in 2026, 2.0 times Los Angeles, yet fewer per pool home. (U.S. Census Bureau)
- Las Vegas pool builders handled an estimated 19.7 new pools each in 2025, against 3.5 in Los Angeles. (Pool Construction & Service research desk (city open-data permit files))
- Florida had 2,904 businesses with an active pool/spa construction license on October 14, 2026. (Florida Department of Business and Professional Regulation (DBPR))
- Of 1,011 Google Maps pool listings with an address sampled in 34 US metros on October 14, 2026, 31.3% were in the wrong state. (Serper.dev (Google Maps results))
Primary inputs
- Construction Industry Licensee extract CONSTRUCTIONLICENSE_1.csv (downloaded Oct 14, 2026), Florida Department of Business and Professional Regulation (DBPR)
- Public Data Portal: List of Contractors by Classification, C-53 and C-61/D-35 (downloaded Oct 14, 2026), California Contractors State License Board (CSLB)
- ROC Posting List: Current Active Contractor Licenses, file created Jul 20, 2026 (Wayback Machine capture), Arizona Registrar of Contractors
- Active Directory of Licensed Contractors, classifications A and AB, all counties (current as of Oct 14, 2026), Nevada State Contractors Board
- Nonemployer Statistics 2024, county and U.S. files (NAICS 56179), U.S. Census Bureau
- Percentage of Homes With Pools (AHS 2015 metro tabulation; EIA RECS 2024 state tabulation), Pool Construction & Service research desk (Census/HUD AHS and EIA RECS microdata)
Media summary
A Pool Construction & Service analysis of state license rosters finds that pool contractor supply per pool home varies widely across US metros. In October 2026, Riverside-San Bernardino had 26.1 licensed pool businesses per 10,000 homes with a pool, the highest of five metros with metro-level pool data, while Phoenix had 17.5 and San Francisco-Oakland 15.5. Per resident the picture flips: Phoenix had 19.4 licensed pool businesses per 100,000 people, 2.0 times Los Angeles. Builders in Las Vegas and Cape Coral-Fort Myers handled an estimated 19.7 and 20.4 new pools each in 2025, against 3.5 in Los Angeles. The index draws on Florida, California, Arizona and Nevada rosters, Census housing and business counts, and AHS pool shares from 2015, which is the main limitation. Texas has no state pool license. A test of Google Maps listings found 31.3% returned from the wrong state, so listing counts were not used to rank markets.
Possible headlines
- Phoenix has more pool contractors per resident than Los Angeles, but fewer per pool
- Riverside-San Bernardino tops a 2026 pool contractor saturation index
- Las Vegas pool builders handled 19.7 new pools each in 2025, against 3.5 in Los Angeles
- Florida has 2,904 licensed pool construction businesses, state roster shows
- Google Maps counts mislead on pool competition: 31.3% of listings came from the wrong state
Citation
Pool Construction & Service. "Pool Contractors Per Capita: A 2026 Metro Saturation Index." PC&S Research Desk, October 14, 2026. https://poolconstructionandservice.com/research/pool-contractor-density/
License
The data tables and charts in this report are licensed under CC BY 4.0. Reuse them with this attribution: “Source: Pool Construction & Service (poolconstructionandservice.com), Pool Contractors Per Capita: A 2026 Metro Saturation Index.” Figures from third-party sources remain subject to their publishers’ terms.
Comparison tables
- Pool Market Saturation Index and pool contractors per capita, 14 US metros, 2026 CSV
- New pool permits per licensed builder, 6 US metros, 2025 permits and 2026 rosters CSV
- NAICS 561790 businesses per pool home and per house, 34 US metros, 2023 to 2024 CSV
- Active pool contractor licenses by state roster, FL, CA, AZ, NV and TX, 2026 CSV
- Counts of US pool businesses by source and definition, 2023 to 2026 CSV
- Google Maps listing sample audit, 34 US metros, October 14, 2026 CSV
- Full fact sheet with sources and limitations CSV
Evidence tiers
Tier 1: primary and government sources (22)
- Florida Department of Business and Professional Regulation (DBPR): Construction Industry Licensee extract CONSTRUCTIONLICENSE_1.csv (downloaded Oct 14, 2026)
- Florida DBPR: Construction Industry Licensing Board: public records downloads and file layout
- Florida Legislature: Florida Statutes, section 489.105 Definitions
- Arizona Registrar of Contractors: ROC Posting List: Current Active Contractor Licenses, file created Jul 20, 2026 (Wayback Machine capture)
- Arizona Registrar of Contractors: License Classifications (Wayback Machine capture, Aug 17, 2026)
- California Contractors State License Board (CSLB): Public Data Portal: List of Contractors by Classification, C-53 and C-61/D-35 (downloaded Oct 14, 2026)
- California CSLB: C-53 Swimming Pool Contractor classification
- California CSLB: D-35 Pool and Spa Maintenance Contractor classification
- Nevada State Contractors Board: Active Directory of Licensed Contractors, classifications A and AB, all counties (current as of Oct 14, 2026)
- Nevada Legislature: Nevada Administrative Code Chapter 624 (subclassification A-10)
- Office of the Texas Governor, Business Permit Office: Texas Licenses and Permits Guide 2026-2027
- U.S. Census Bureau: American Community Survey 2020-2024 5-year, Table B25024 Units in Structure (summary file)
- U.S. Census Bureau: American Community Survey 2020-2024 5-year, Table B25002 Occupancy Status (summary file)
- U.S. Census Bureau (OMB definitions): Core based statistical areas and counties, February 2013 delineation (list 1)
- U.S. Census Bureau: 2020 ZCTA to County Relationship File
- U.S. Census Bureau: County Population Totals, Vintage 2025 (co-est2025-alldata)
- U.S. Census Bureau: Nonemployer Statistics 2024, county and U.S. files (NAICS 56179)
- U.S. Census Bureau: County Business Patterns 2023, county and U.S. files (NAICS 561790)
- U.S. Census Bureau: 2022 NAICS Index File and Descriptions (561790 Other Services to Buildings and Dwellings)
- Pool Construction & Service research desk (Census/HUD AHS and EIA RECS microdata): Percentage of Homes With Pools (AHS 2015 metro tabulation; EIA RECS 2024 state tabulation)
- Pool Construction & Service research desk (city open-data permit files): Pool Construction Statistics (city permit counts, 2015 to 2025)
- Pool Construction & Service research desk: Pool Contractor License Requirements by State
Tier 2: trade bodies, public companies, market research (4)
- Pool Corporation (SEC EDGAR): Pool Corporation Form 10-K for fiscal year 2025
- IBISWorld: Swimming Pool Construction in the US: Number of Businesses
- IBISWorld: Swimming Pool Cleaning Services in the US
- Pool Construction & Service research desk (primary disclosures): Pool Industry Acquisitions registry (2015 to Oct 6, 2026)
Tier 3: journalism and expert commentary (2)
References
- Florida Department of Business and Professional Regulation (DBPR). Construction Industry Licensee extract CONSTRUCTIONLICENSE_1.csv (downloaded Oct 14, 2026). Accessed 2026-10-14.
- Florida DBPR. Construction Industry Licensing Board: public records downloads and file layout. Accessed 2026-10-14.
- Florida Legislature. Florida Statutes, section 489.105 Definitions. Accessed 2026-10-14.
- Arizona Registrar of Contractors. ROC Posting List: Current Active Contractor Licenses, file created Jul 20, 2026 (Wayback Machine capture). Accessed 2026-10-14.
- Arizona Registrar of Contractors. License Classifications (Wayback Machine capture, Aug 17, 2026). Accessed 2026-10-14.
- California Contractors State License Board (CSLB). Public Data Portal: List of Contractors by Classification, C-53 and C-61/D-35 (downloaded Oct 14, 2026). Accessed 2026-10-14.
- California CSLB. C-53 Swimming Pool Contractor classification. Accessed 2026-10-14.
- California CSLB. D-35 Pool and Spa Maintenance Contractor classification. Accessed 2026-10-14.
- Nevada State Contractors Board. Active Directory of Licensed Contractors, classifications A and AB, all counties (current as of Oct 14, 2026). Accessed 2026-10-14.
- Nevada Legislature. Nevada Administrative Code Chapter 624 (subclassification A-10). Accessed 2026-10-14.
- Office of the Texas Governor, Business Permit Office. Texas Licenses and Permits Guide 2026-2027. Accessed 2026-10-14.
- U.S. Census Bureau. American Community Survey 2020-2024 5-year, Table B25024 Units in Structure (summary file). Accessed 2026-10-14.
- U.S. Census Bureau. American Community Survey 2020-2024 5-year, Table B25002 Occupancy Status (summary file). Accessed 2026-10-14.
- U.S. Census Bureau (OMB definitions). Core based statistical areas and counties, February 2013 delineation (list 1). Accessed 2026-10-14.
- U.S. Census Bureau. 2020 ZCTA to County Relationship File. Accessed 2026-10-14.
- U.S. Census Bureau. County Population Totals, Vintage 2025 (co-est2025-alldata). Accessed 2026-10-14.
- U.S. Census Bureau. Nonemployer Statistics 2024, county and U.S. files (NAICS 56179). Accessed 2026-10-14.
- U.S. Census Bureau. County Business Patterns 2023, county and U.S. files (NAICS 561790). Accessed 2026-10-14.
- U.S. Census Bureau. 2022 NAICS Index File and Descriptions (561790 Other Services to Buildings and Dwellings). Accessed 2026-10-14.
- Pool Construction & Service research desk (Census/HUD AHS and EIA RECS microdata). Percentage of Homes With Pools (AHS 2015 metro tabulation; EIA RECS 2024 state tabulation). Accessed 2026-10-14.
- Pool Construction & Service research desk (city open-data permit files). Pool Construction Statistics (city permit counts, 2015 to 2025). Accessed 2026-10-14.
- Pool Corporation (SEC EDGAR). Pool Corporation Form 10-K for fiscal year 2025. Accessed 2026-10-14.
- IBISWorld. Swimming Pool Construction in the US: Number of Businesses. Accessed 2026-10-14.
- IBISWorld. Swimming Pool Cleaning Services in the US. Accessed 2026-10-14.
- Pool Construction & Service research desk (primary disclosures). Pool Industry Acquisitions registry (2015 to Oct 6, 2026). Accessed 2026-10-14.
- SPS PoolCare via PR Newswire. SPS PoolCare celebrates five years, 50,000 recurring customers (press release, Jul 7, 2026). Accessed 2026-10-14.
- Serper.dev (Google Maps results). Google Maps listings returned by the Serper.dev /places API, PC&S sample of 34 metros (Oct 14, 2026). Accessed 2026-10-14.
- Pool Construction & Service research desk. Pool Contractor License Requirements by State. Accessed 2026-10-14.
Related pool research
Pool Contractor License Requirements by State, 2026: Exams, Experience, Bonds, Insurance and Licensee Counts
Pool Industry Acquisitions: A Registry of U.S. Deals From Primary Disclosures, 2015 to 2026
Pool Contractor Complaints: State Licensing Board Discipline Data, 2022 to 2026

Pool Equipment Tariffs: A Registry of U.S. Duties on Pumps, Filters, Heaters, Pools and Chemicals, 2018 to 2026
Cities With the Most Pools: A 2022 to 2023 Satellite Census of 25 US Metros
Pool Equipment Prices 2026: A Retail Price Index for Pumps, Filters, Heaters, Cleaners and Chlorine
All pool industry research (43 reports)