Swimming Participation Statistics: Who Swims in the US, How Often and for How Long, 2003 to 2025
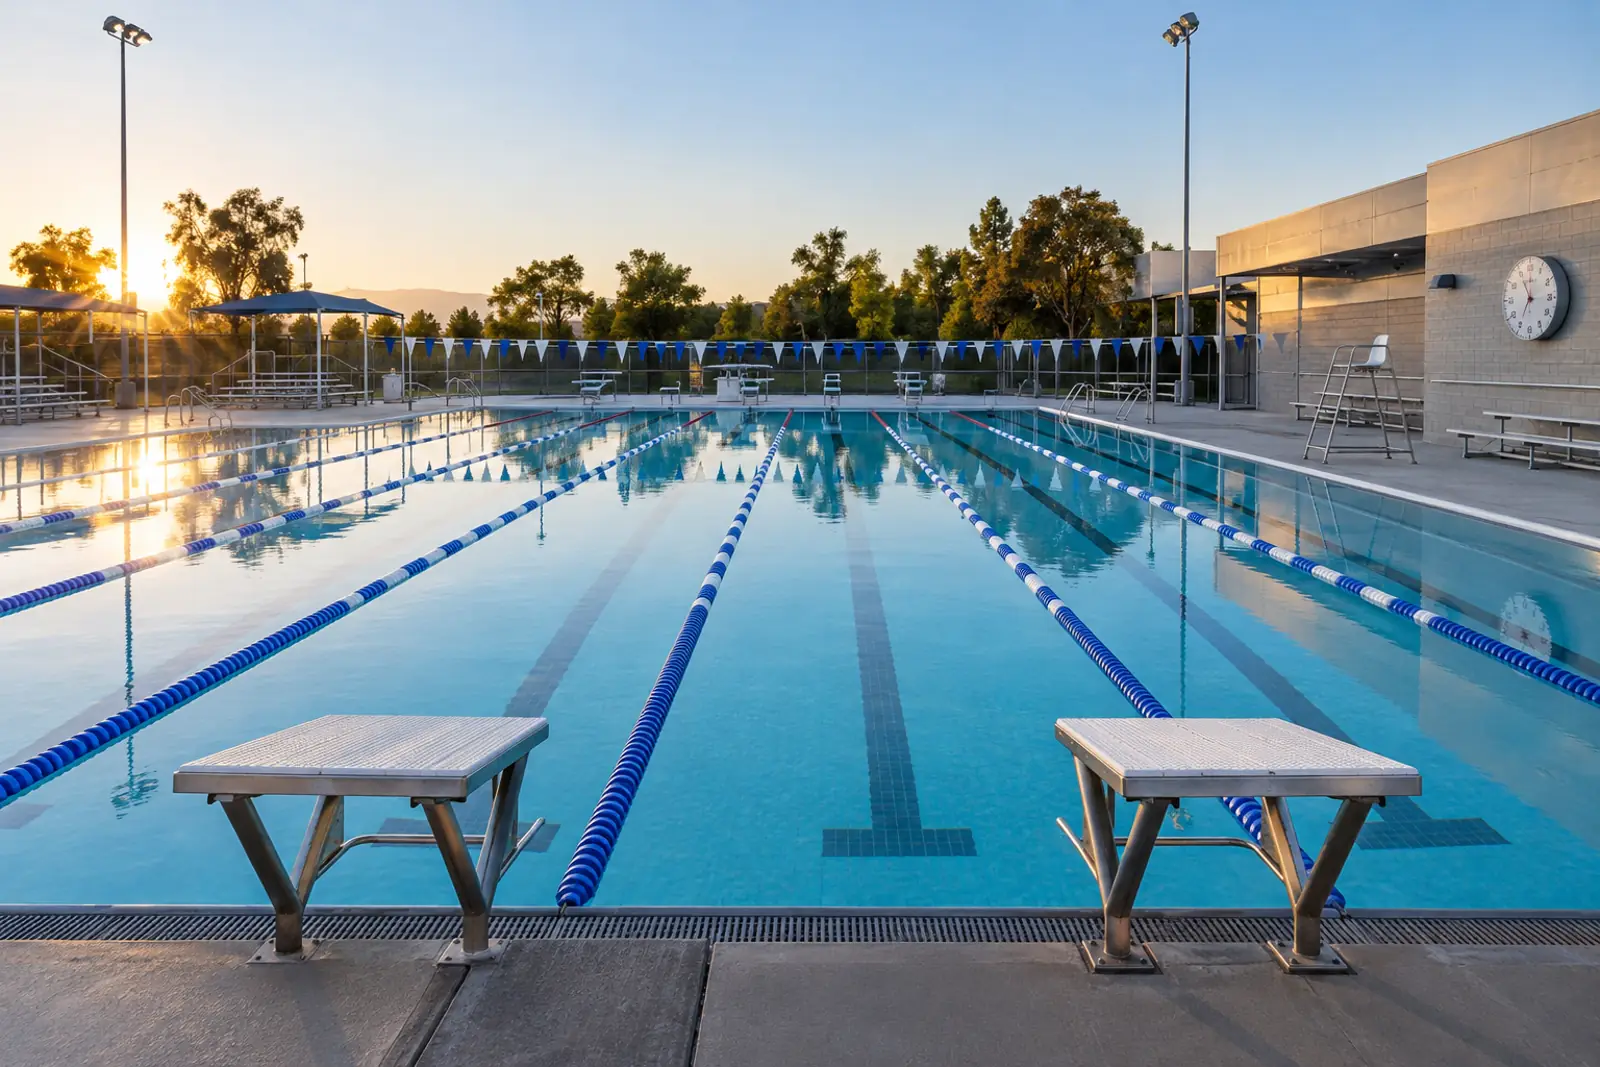
Swimming participation statistics from federal time diaries show that on an average day in 2021 to 2025, 1.13% of Americans age 15 and older, about 3.1 million people, swam or did other water sports, for 108.5 minutes on average. The share rises to 2.98% on summer days and is 20.4% lower than in 2003 to 2007.
At a glance
- On an average day in 2021 to 2025, 1.13% of US residents age 15 and older swam or did other water sports, about 3.1 million people (BLS ATUS microdata, PC&S tabulation).
- On days they took part, US participants spent 108.5 minutes in the water activity on average in 2021 to 2025, about 1.81 hours (BLS ATUS microdata, PC&S tabulation).
- On an average US summer day in 2021 to 2025, 2.98% of people 15+ took part, about 8.1 million, against 0.30% on an average winter day (BLS ATUS microdata, PC&S tabulation).
- In 2015 to 2025 (excluding 2020), the highest family-income fifth took part on 1.92% of days and the lowest fifth on 0.70%, a ratio of 2.7 (BLS ATUS microdata, PC&S tabulation).
- Teens 15 to 19 had the highest US average-day share in 2015 to 2025 (excluding 2020), 2.70%, rising to 6.42% on summer days (BLS ATUS microdata, PC&S tabulation).
- US average-day participation fell 20.4% from 1.42% in 2003 to 2007 to 1.13% in 2021 to 2025; the post-2019 drop sits in September to May, not in summer (BLS ATUS microdata, PC&S tabulation).
- 51.2% of US adults spent time in or around a swimming pool in the six months to October to November 2023 (CDC MMWR).
- High school swimming and diving had 246,116 participants in 2025-26, 21.8% below the 2017-18 peak of 314,529, while all high school sports grew 5.4% (NFHS).
How many Americans swim on an average day
Just over 1% of Americans age 15 and older swim or do another water sport on a given day. The daily share is low because most people who swim do so on a few days a year, mostly in summer.
PC&S tabulated every American Time Use Survey (ATUS) diary from 2003 to 2025, 258,954 respondents in total (BLS ATUS multi-year files). Each respondent reports every activity of one randomly assigned day, so the weighted share of diaries with water sports is the share of people doing it on an average day.
In 2021 to 2025, 1.13% of US residents age 15 and older swam or did other water sports on an average day (standard error 0.06 points) (BLS ATUS microdata, PC&S tabulation). Applied to the mean population of 271.2 million people age 15+ represented by the ATUS weights, 1.13% is about 3.1 million people a day.
US participants averaged 108.5 minutes of the activity on the days they did it in 2021 to 2025, about 1.81 hours (BLS ATUS microdata, PC&S tabulation). Spread across everyone age 15+, the share works out to 4.1 water-sports days per person per year in 2021 to 2025, and to 1.12 billion person-days a year nationally (PC&S calculation).
The PC&S weighting reproduces BLS’s own published totals: the microdata give 23.4% of people 15+ doing any sport, exercise or recreation on an average day in 2025, the same as BLS Table 1 (BLS ATUS Table 1, 2025).
Swimming participation statistics by season and month
Swimming participation is strongly seasonal. June to August holds nearly two thirds of all US water-sports days, and the summer concentration is strongest in the Northeast and Midwest.
Source: PC&S tabulation of BLS American Time Use Survey 2003-2025 microdata (activity code 130132, water sports including swimming). Download chart data (CSV)
Pooling 2003 to 2025 (excluding 2020), the US average-day share climbs from 0.47% in January to 1.20% in May, peaks at 4.25% in July and drops to 0.34% in December (BLS ATUS microdata, PC&S tabulation).
In 2021 to 2025, 2.98% of people 15+ took part on an average summer day (June to August), about 8.1 million people, against 0.30% on an average winter day (December to February), about 0.8 million (BLS ATUS microdata, PC&S tabulation). The summer share is 9.9 times the winter share (PC&S calculation).
Summer sessions are longer: 116.6 minutes per participant on summer days against 80.3 minutes on winter days, 2003 to 2025 (BLS ATUS microdata, PC&S tabulation).
In 2015 to 2025 (excluding 2020), 68.1% of Northeast and 66.8% of Midwest water-sports days fell in June to August, against 56.9% in the South and 54.1% in the West (BLS ATUS microdata, PC&S tabulation). For outdoor season lengths by city, see the pool season length study.
| Month | Share on an average day, 2003-2025 excl. 2020 (%) | Standard error (pts) | Minutes on days they did it, 2003-2025 | Share on an average day, 2021-2025 (%) | Standard error 2021-2025 (pts) | Note |
|---|---|---|---|---|---|---|
| January | 0.47 | 0.06 | 85.4 | 2021-2025 share suppressed (fewer than 30 participants) | ||
| February | 0.5 | 0.06 | 88.1 | 2021-2025 share suppressed (fewer than 30 participants) | ||
| March | 0.51 | 0.07 | 98.0 | 2021-2025 share suppressed (fewer than 30 participants) | ||
| April | 0.65 | 0.08 | 82.8 | 2021-2025 share suppressed (fewer than 30 participants) | ||
| May | 1.2 | 0.10 | 111.8 | 1.05 | 0.20 | |
| June | 2.98 | 0.15 | 121.2 | 2.53 | 0.30 | |
| July | 4.25 | 0.18 | 117.2 | 3.73 | 0.40 | |
| August | 2.78 | 0.16 | 111.2 | 2.64 | 0.34 | |
| September | 1.22 | 0.11 | 107.6 | 1.0 | 0.23 | |
| October | 0.58 | 0.08 | 78.3 | 2021-2025 share suppressed (fewer than 30 participants) | ||
| November | 0.37 | 0.06 | 87.0 | 2021-2025 share suppressed (fewer than 30 participants) | ||
| December | 0.34 | 0.06 | 63.4 | 2021-2025 share suppressed (fewer than 30 participants) |
Source: BLS ATUS microdata, PC&S tabulation. Monthly 2021-2025 values suppressed where fewer than 30 participants. Download CSV
Who swims in the US: age, sex and household
Teenagers and adults aged 35 to 44 have the highest participation, and people living with children take part more often than people without. Men and women take part at similar rates. Older swimmers take part about as often as middle-aged adults but in shorter sessions.
Summer value for ages 20-24 suppressed (fewer than 30 participants).
Source: PC&S tabulation of BLS American Time Use Survey 2003-2025 microdata (activity code 130132, water sports including swimming). Download chart data (CSV)
In 2015 to 2025 (excluding 2020), 2.70% of US teens 15 to 19 swam or did water sports on an average day, and 6.42% on an average summer day (BLS ATUS microdata, PC&S tabulation). The share for ages 35 to 44 was 1.51%, or 4.47% on summer days, against 1.01% for ages 25 to 34 (BLS ATUS microdata, PC&S tabulation).
People living with a child under 18 took part on 1.58% of days, against 1.09% for people without one (2015 to 2025, excluding 2020), a ratio of 1.4 (BLS ATUS microdata, PC&S tabulation). Men took part on 1.23% of days and women on 1.30%; in 2021 to 2025 the gap between women and men was 0.08 points and not statistically significant (BLS ATUS microdata, PC&S tabulation).
Source: PC&S tabulation of BLS American Time Use Survey 2003-2025 microdata (activity code 130132, water sports including swimming). Download chart data (CSV)
Session length falls with age. Pooling 2003 to 2025 (excluding 2020), participants aged 15 to 19 spent 126.6 minutes on a water-sports day and participants 75 and older spent 63.9 minutes, about half as long (BLS ATUS microdata, PC&S tabulation). ATUS does not record which water activity older participants chose.
| Dimension | Group | Share on an average day (%) | Standard error (pts) | Share on an average summer day (%) | Minutes on days they did it | Respondents | Water-sports participants | Reliability note |
|---|---|---|---|---|---|---|---|---|
| All people 15+ | All | 1.27 | 0.04 | 3.06 | 109.7 | 90235 | 1240 | |
| Sex | Men | 1.23 | 0.07 | 2.92 | 107.1 | 41035 | 575 | |
| Sex | Women | 1.3 | 0.06 | 3.18 | 111.9 | 49200 | 665 | |
| Age | 15-19 | 2.7 | 0.32 | 6.42 | 128.3 | 3623 | 100 | |
| Age | 20-24 | 0.98 | 0.21 | 3397 | 38 | Summer share suppressed; Minutes suppressed (fewer than 50 participants) | ||
| Age | 25-34 | 1.01 | 0.10 | 2.28 | 114.7 | 12801 | 163 | |
| Age | 35-44 | 1.51 | 0.10 | 4.47 | 120.5 | 15564 | 315 | |
| Age | 45-54 | 1.02 | 0.11 | 2.64 | 113.4 | 13727 | 165 | |
| Age | 55-64 | 1.07 | 0.09 | 2.31 | 99.6 | 15505 | 184 | |
| Age | 65-74 | 1.27 | 0.13 | 2.31 | 79.8 | 15099 | 179 | |
| Age | 75+ | 1.04 | 0.14 | 1.91 | 66.4 | 10519 | 96 | |
| Race and Hispanic origin | White, non-Hispanic | 1.51 | 0.06 | 3.71 | 107.2 | 60475 | 988 | |
| Race and Hispanic origin | Hispanic (any race) | 0.89 | 0.11 | 2.17 | 143.4 | 12853 | 124 | |
| Race and Hispanic origin | Black, non-Hispanic | 0.43 | 0.08 | 11111 | 48 | Summer share suppressed; Minutes suppressed (fewer than 50 participants) | ||
| Race and Hispanic origin | Asian, non-Hispanic | 1.52 | 0.29 | 92.4 | 4202 | 59 | Summer share suppressed | |
| Race and Hispanic origin | Other or multiple races, non-Hispanic | 1594 | 21 | Average-day share suppressed (fewer than 30 participants); Summer share suppressed; Minutes suppressed (fewer than 50 participants) | ||||
| Family income fifth | Lowest fifth | 0.7 | 0.08 | 1.64 | 114.7 | 20465 | 153 | |
| Family income fifth | Second fifth | 0.85 | 0.08 | 1.99 | 113.2 | 18614 | 175 | |
| Family income fifth | Middle fifth | 1.37 | 0.11 | 3.51 | 111.1 | 17555 | 244 | |
| Family income fifth | Fourth fifth | 1.51 | 0.10 | 3.67 | 99.9 | 17070 | 291 | |
| Family income fifth | Highest fifth | 1.92 | 0.11 | 4.47 | 112.9 | 16530 | 378 | |
| Census region | Northeast | 1.29 | 0.11 | 3.57 | 92.5 | 14631 | 209 | |
| Census region | Midwest | 1.17 | 0.09 | 3.19 | 108.7 | 21094 | 240 | |
| Census region | South | 1.16 | 0.07 | 2.6 | 123.9 | 34333 | 459 | |
| Census region | West | 1.55 | 0.11 | 3.33 | 103.0 | 20177 | 332 | |
| Metro status | Metropolitan | 1.32 | 0.05 | 3.11 | 110.1 | 75857 | 1106 | |
| Metro status | Nonmetropolitan | 0.9 | 0.11 | 2.78 | 104.4 | 13462 | 124 | |
| Education (age 25+) | Less than high school | 0.42 | 0.09 | 6252 | 30 | Summer share suppressed; Minutes suppressed (fewer than 50 participants) | ||
| Education (age 25+) | High school diploma | 0.69 | 0.07 | 1.59 | 123.8 | 19410 | 139 | |
| Education (age 25+) | Some college or associate | 1.12 | 0.09 | 2.64 | 106.5 | 22166 | 256 | |
| Education (age 25+) | Bachelor's degree | 1.54 | 0.09 | 3.5 | 106.6 | 20761 | 375 | |
| Education (age 25+) | Advanced degree | 1.89 | 0.13 | 4.59 | 81.0 | 14626 | 302 | |
| Household | Child under 18 in household | 1.58 | 0.09 | 4.28 | 128.1 | 31831 | 597 | |
| Household | No child under 18 in household | 1.09 | 0.05 | 2.36 | 94.3 | 58404 | 643 | |
| Employment | Employed | 1.15 | 0.05 | 2.9 | 106.6 | 53719 | 779 | |
| Employment | Not employed | 1.46 | 0.09 | 3.31 | 113.8 | 36516 | 461 | |
| Day of week | Weekday (non-holiday) | 1.1 | 0.06 | 2.45 | 96.0 | 44536 | 500 | |
| Day of week | Weekend day | 1.61 | 0.07 | 4.33 | 126.4 | 44312 | 711 |
Source: BLS ATUS microdata, PC&S tabulation. Shares suppressed below 30 participants; minutes suppressed below 50. Download CSV
Swimming participation by income, education, race and Hispanic origin
The steepest gradients in this profile run by income and education. Two federal surveys with different designs, ATUS time diaries and the CDC’s 2023 pool-time question, show the same direction.
Fifths are weighted person fifths of CPS family income, built within each year by splitting income brackets that straddle a boundary.
Source: PC&S tabulation of BLS American Time Use Survey 2003-2025 microdata (activity code 130132, water sports including swimming). Download chart data (CSV)
In 2015 to 2025 (excluding 2020), US residents in the highest family-income fifth swam or did water sports on 1.92% of days, against 0.70% in the lowest fifth, a ratio of 2.7 (BLS ATUS microdata, PC&S tabulation). On summer days the shares were 4.47% and 1.64% (BLS ATUS microdata, PC&S tabulation). Minutes per session barely differ by income: 114.7 in the lowest fifth and 112.9 in the highest.
| Family income fifth | Share on an average day, 2015-2025 excl. 2020 (%) | Standard error (pts) | Share on an average summer day, 2015-2025 excl. 2020 (%) | Summer standard error (pts) | Minutes on days they did it | Share on an average day, 2021-2025 (%) | Standard error 2021-2025 (pts) |
|---|---|---|---|---|---|---|---|
| Lowest fifth | 0.7 | 0.08 | 1.64 | 0.24 | 114.7 | 0.7 | 0.12 |
| Second fifth | 0.85 | 0.08 | 1.99 | 0.22 | 113.2 | 0.77 | 0.12 |
| Middle fifth | 1.37 | 0.11 | 3.51 | 0.34 | 111.1 | 1.09 | 0.12 |
| Fourth fifth | 1.51 | 0.10 | 3.67 | 0.32 | 99.9 | 1.42 | 0.14 |
| Highest fifth | 1.92 | 0.11 | 4.47 | 0.35 | 112.9 | 1.69 | 0.16 |
Source: BLS ATUS microdata, PC&S tabulation. Fifths built within each year from 16 CPS family income brackets. Download CSV
The CDC’s 2023 survey of 7,046 adults (NCHS Rapid Surveys System Round 2) points the same way: 56.7% of adults at 200% or more of the federal poverty level spent at least one day around a pool in six months, against 37.4% below 100% (NCHS Rapid Surveys System). By education, the ATUS share was 1.89% for adults with an advanced degree and 0.69% for high school graduates (2015 to 2025, excluding 2020) (BLS ATUS microdata, PC&S tabulation).
Pooled 2015-2025 excluding 2020. Confidence intervals from 160 BLS replicate weights.
Source: PC&S tabulation of BLS American Time Use Survey 2003-2025 microdata (activity code 130132, water sports including swimming). Download chart data (CSV)
White non-Hispanic people took part on 1.51% of days and Black non-Hispanic people on 0.43% in 2015 to 2025 (excluding 2020), a ratio of 3.5 (BLS ATUS microdata, PC&S tabulation). Hispanic participants took part less often (0.89%) but had the longest sessions of any group, 143.4 minutes (BLS ATUS microdata, PC&S tabulation). In the 2023 CDC survey, 33.0% of Black non-Hispanic adults had spent a day around a pool in six months, against 56.1% of White non-Hispanic adults (NCHS Rapid Surveys System).
The CDC links these gaps to access and history, including segregated pools, pool closures after integration and restrictive private clubs (CDC MMWR). Swimming ability by group is covered in the how many Americans can’t swim report; where public pools are located is covered in the public pools by city study.
Where Americans swim: regions and metro areas
The West has the highest year-round share; the Northeast and Midwest catch up in summer. Metro residents take part more often than people outside metro areas.
In 2015 to 2025 (excluding 2020), the US average-day share was 1.55% in the West, 1.29% in the Northeast, 1.17% in the Midwest and 1.16% in the South (BLS ATUS microdata, PC&S tabulation). On summer days the Northeast led at 3.57%, ahead of the West (3.33%), Midwest (3.19%) and South (2.60%) (BLS ATUS microdata, PC&S tabulation).
Southern participants had the longest sessions, 123.9 minutes, against 92.5 minutes in the Northeast (2015 to 2025, excluding 2020) (BLS ATUS microdata, PC&S tabulation). Metro residents took part on 1.32% of days and nonmetro residents on 0.90% (BLS ATUS microdata, PC&S tabulation). In the 2023 CDC survey, 45.4% of nonmetro adults had spent a day around a pool in six months, against 53.9% in large fringe metro counties (NCHS Rapid Surveys System).
For context on how many pools exist, see the number of swimming pools in the US. Families comparing how often a home pool would be used can start with the pool planning checklist.
Is swimming participation declining? Trend from 2003 to 2025
Yes, on the time-diary measure: the average-day share in 2021 to 2025 is about a fifth below both 2003 to 2007 and 2015 to 2019. The drop since 2019 is concentrated in September to May, and organized youth swimming shows a similar decline.
Single-year estimates have standard errors of roughly 0.1 to 0.2 points (all-year) and 0.3 to 0.7 points (summer). 2020 excludes spring 2020; 2025 excludes 30 Sep to 11 Nov.
Source: PC&S tabulation of BLS American Time Use Survey 2003-2025 microdata (activity code 130132, water sports including swimming). Download chart data (CSV)
Five-year pools give stable readings: 1.42% of US people 15+ took part on an average day in 2003 to 2007, 1.41% in 2008 to 2012, 1.38% in 2013 to 2017, 1.41% in 2015 to 2019 and 1.13% in 2021 to 2025 (BLS ATUS microdata, PC&S tabulation). The 2021 to 2025 share is 20.4% below 2003 to 2007 and 19.9% below 2015 to 2019; both differences are statistically significant (z of -3.7 and -3.3) (PC&S calculation).
The decline since 2015 to 2019 sits outside summer. The September-to-May share fell from 0.82% to 0.53%, down 35.4% (z = -3.6), while the summer share moved from 3.13% to 2.98%, a 4.8% change that is not significant (BLS ATUS microdata, PC&S tabulation). That pattern is consistent with less off-season swimming after the pandemic, much of which happens indoors; ATUS does not record whether a pool was indoor.
| Year | Share on an average day (%) | Standard error (pts) | 95% confidence interval (%) | Share on an average summer day (%) | Minutes on days they did it | People 15+ on an average day (millions) | Respondents | Water-sports participants | Note |
|---|---|---|---|---|---|---|---|---|---|
| 2003 | 1.28 | 0.09 | 1.10 to 1.45 | 3.48 | 97.3 | 2.88 | 20720 | 302 | |
| 2004 | 1.26 | 0.12 | 1.01 to 1.50 | 2.84 | 109.7 | 2.86 | 13973 | 178 | |
| 2005 | 1.46 | 0.11 | 1.24 to 1.69 | 4.11 | 94.2 | 3.37 | 13038 | 226 | |
| 2006 | 1.4 | 0.13 | 1.15 to 1.65 | 3.55 | 100.3 | 3.27 | 12943 | 206 | |
| 2007 | 1.69 | 0.14 | 1.41 to 1.97 | 4.1 | 109.1 | 3.99 | 12248 | 208 | |
| 2008 | 1.51 | 0.13 | 1.25 to 1.76 | 3.9 | 107.7 | 3.59 | 12723 | 202 | |
| 2009 | 1.19 | 0.12 | 0.96 to 1.42 | 2.83 | 97.9 | 2.86 | 13133 | 173 | |
| 2010 | 1.27 | 0.12 | 1.03 to 1.51 | 3.37 | 124.8 | 3.07 | 13260 | 185 | |
| 2011 | 1.49 | 0.13 | 1.23 to 1.74 | 4.36 | 118.4 | 3.62 | 12479 | 208 | |
| 2012 | 1.58 | 0.15 | 1.29 to 1.88 | 4.15 | 126.6 | 3.92 | 12443 | 192 | |
| 2013 | 0.98 | 0.11 | 0.77 to 1.19 | 2.82 | 96.7 | 2.44 | 11385 | 132 | Shutdown in 2013 raised the share of days without diaries |
| 2014 | 1.33 | 0.16 | 1.02 to 1.64 | 3.9 | 98.4 | 3.36 | 11592 | 150 | |
| 2015 | 1.3 | 0.16 | 0.99 to 1.61 | 3.44 | 103.7 | 3.32 | 10905 | 142 | |
| 2016 | 1.62 | 0.14 | 1.34 to 1.91 | 3.63 | 110.6 | 4.19 | 10493 | 173 | |
| 2017 | 1.63 | 0.17 | 1.28 to 1.97 | 2.84 | 98.2 | 4.21 | 10223 | 156 | |
| 2018 | 1.37 | 0.14 | 1.10 to 1.64 | 3.15 | 124.0 | 3.6 | 9593 | 140 | |
| 2019 | 1.12 | 0.14 | 0.84 to 1.40 | 2.59 | 119.9 | 2.96 | 9435 | 124 | |
| 2020 | 1.26 | n/a | 2.91 | 122.9 | 2.85 | 8782 | 137 | No data 18 Mar to 9 May 2020; no replicate SE | |
| 2021 | 1.04 | 0.13 | 0.79 to 1.29 | 2.72 | 105.8 | 2.76 | 9087 | 110 | |
| 2022 | 1.3 | 0.17 | 0.96 to 1.63 | 3.13 | 113.4 | 3.48 | 8136 | 103 | |
| 2023 | 1.05 | 0.12 | 0.82 to 1.29 | 2.55 | 100.6 | 2.86 | 8548 | 113 | |
| 2024 | 1.28 | 0.18 | 0.92 to 1.64 | 4.08 | 104.0 | 3.49 | 7669 | 92 | |
| 2025 | 1.0 | 0.12 | 0.77 to 1.23 | 2.4 | 118.9 | 2.78 | 6146 | 87 | No diaries 30 Sep to 11 Nov 2025 (shutdown) |
Source: BLS ATUS microdata, PC&S tabulation. 2020 uses TU20FWGT and has no replicate SE; 2025 lacks diaries for 30 Sep to 11 Nov (BLS notice). Download CSV
Organized swimming shows a similar shape. High school swimming and diving peaked at 314,529 participants in 2017-18 (NFHS 2017-18) and fell to 246,116 in 2025-26, down 21.8%, while all high school athletics grew 5.4% to a record 8,415,684 (NFHS 2025-26). Swimming’s share of high school athletes fell from 3.94% to 2.92% (PC&S calculation).
| School year | Swimming and diving participants | All high school athletics participants | Swimming and diving share (%) |
|---|---|---|---|
| 2009-10 | 289795 | 7628377 | 3.8 |
| 2010-11 | 294781 | 7667955 | 3.84 |
| 2011-12 | 294279 | 7692520 | 3.83 |
| 2012-13 | 302169 | 7713577 | 3.92 |
| 2013-14 | 304152 | 7795658 | 3.9 |
| 2014-15 | 303925 | 7807047 | 3.89 |
| 2015-16 | 300217 | 7866265 | 3.82 |
| 2016-17 | 309161 | 7963535 | 3.88 |
| 2017-18 | 314529 | 7980886 | 3.94 |
| 2018-19 | 309726 | 7937491 | 3.9 |
| 2021-22 | 272959 | 7618054 | 3.58 |
| 2022-23 | 257452 | 7851833 | 3.28 |
| 2023-24 | 254973 | 8062302 | 3.16 |
| 2024-25 | 257405 | 8266244 | 3.11 |
| 2025-26 | 246116 | 8415684 | 2.92 |
Source: NFHS High School Athletics Participation Surveys; no surveys for 2019-20 and 2020-21. Download CSV
USA Swimming counted 286,526 year-round athlete members in 2025, 19.2% fewer than the 354,627 in 2017 (USA Swimming 2025 report). SFIA’s count of people who swam for fitness at least once was flat, 28,219 thousand in 2019 and 28,173 thousand in 2023, but its CORE group swimming 50+ times a year fell 14.6% between 2018 and 2023 (SFIA 2024 Topline). SFIA’s first-half 2025 indicators showed Swimming on a Team down 2.7% (SFIA mid-year release).
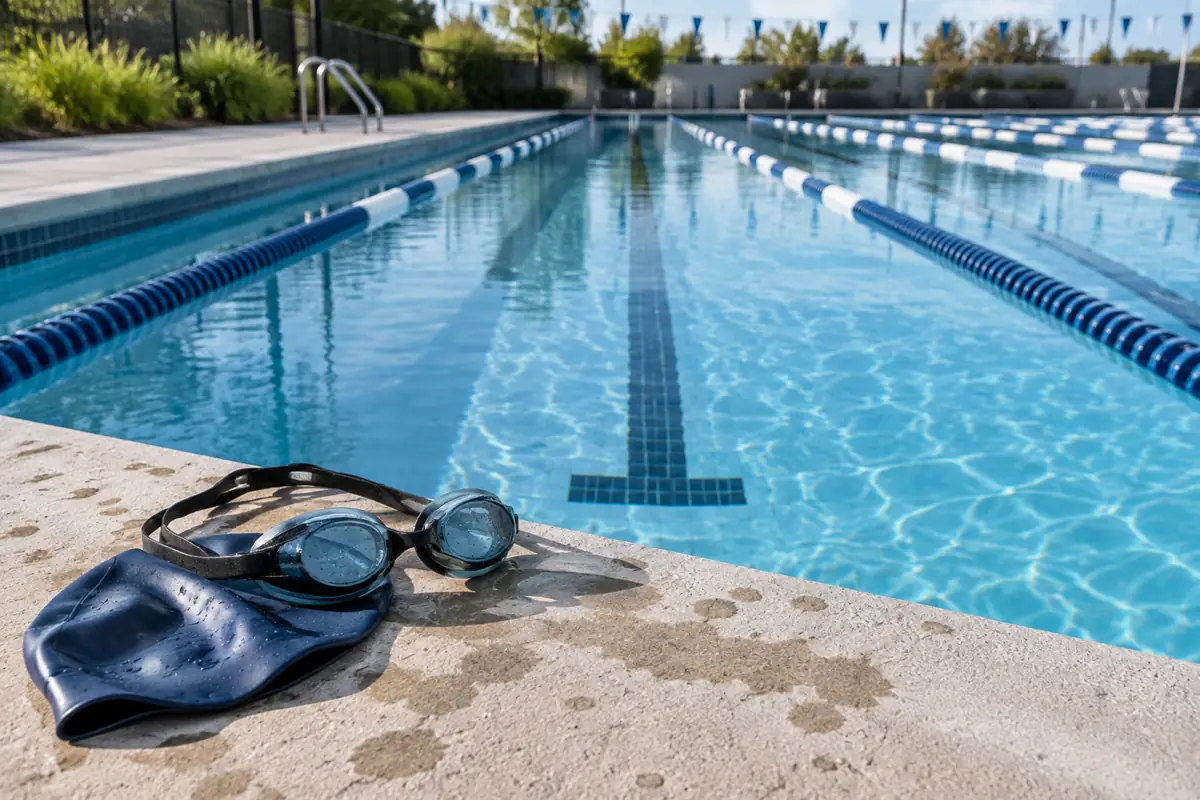
Pools that operate year-round carry the off-season share; for indoor and public facilities see commercial pool construction.
How many people swim in the US each year: annual counts compared
Annual participant counts and daily counts measure different things. About 29.4 million people swam for fitness at least once in 2024, while about 8.1 million people 15+ are in the water on an average summer day.
| Measure | Estimate | Population | Period | Source |
|---|---|---|---|---|
| People 15+ swimming or doing water sports on an average day | 1.13% (3.1 million) | Ages 15+ | 2021-2025 average | BLS ATUS microdata, PC&S tabulation |
| People 15+ swimming or doing water sports on an average summer day | 2.98% (8.1 million) | Ages 15+ | June to August, 2021-2025 | BLS ATUS microdata, PC&S tabulation |
| Water-sports person-days per year | 1.12 billion | Ages 15+ | 2021-2025 average | BLS ATUS microdata, PC&S calculation |
| Adults who spent time in or around a swimming pool | 51.2% | Adults 18+ | 6 months to Oct-Nov 2023 | CDC MMWR / NCHS Rapid Surveys System |
| Adults who spent 7 or more days at a swimming pool | 23.0% (59050 thousand) | Adults 18+ | 6 months to Oct-Nov 2023 | CDC MMWR / NCHS Rapid Surveys System |
| Adults who swam, boated, fished or did water sports in other bodies of water | 44.6% | Adults 18+ | 6 months to Oct-Nov 2023 | NCHS Rapid Surveys System |
| Swimming for Fitness participants (at least once a year) | 29.4 million | Ages 6+ | 2024 | SFIA 2025 Topline (via City of Wheat Ridge appendix) |
| Swimming for Fitness participants (at least once a year) | 28173 thousand | Ages 6+ | 2023 | SFIA 2024 Topline Participation Report |
| Swimming for Fitness CORE participants (50+ times a year) | 7553 thousand | Ages 6+ | 2023 | SFIA 2024 Topline Participation Report |
| Aquatic Exercise participants | 11.3 million | Ages 6+ | 2023 | SFIA 2024 Topline Participation Report |
| Swimming on a Team participants | 3.3 million | Ages 6+ | 2023 | SFIA 2024 Topline Participation Report |
| Swimmers (at least six times a year) | 50226 thousand (18.6%) | Ages 7+ | 2009 | NSGA via Census Statistical Abstract |
| High school swimming and diving participants | 246116 | High school students | 2025-26 | NFHS Participation Survey |
| USA Swimming year-round athlete members | 286526 | Club swimmers | 2025 | USA Swimming Membership Demographics Report |
Sources: BLS ATUS microdata, PC&S tabulation; CDC MMWR; NCHS Rapid Surveys System; SFIA 2024 Topline; SFIA 2025 Topline via Wheat Ridge; Census Statistical Abstract (NSGA); NFHS; USA Swimming. Download CSV
SFIA counted 29.4 million people age 6+ who swam for fitness at least once in 2024 (SFIA 2025 Topline via City of Wheat Ridge). In 2023, SFIA’s 28,173 thousand fitness swimmers were 9.2% of the population age 6+, and 73.2% of them swam 1 to 49 times in the year (SFIA 2024 Topline).
Two independent measures of swimming volume line up. ATUS diaries imply 1.04 billion water-sports person-days among people 15+ in 2023 (PC&S calculation from BLS ATUS microdata, PC&S tabulation); SFIA reported 1.005 billion Swimming for Fitness occasions among people 6+ in 2023 (SFIA 2024 Topline). The populations and definitions differ, so the 1.04 ratio is a scale check, not a match.
The older National Sporting Goods Association measure, which counts people 7+ who swam at least six times, found 50,226 thousand swimmers in 2009, 18.6% of that population (Census Statistical Abstract, Table 1249). NSGA still uses the six-day rule (NSGA 2026 edition sample).
Reading the time-diary data: limits and safety context
The diary measure is precise about timing and duration but cannot name the activity inside the water-sports code, and it misses children under 15.
- ATUS records primary activities only; a parent standing in the pool while supervising a child is coded as childcare.
- Each estimate covers people age 15+ in the civilian noninstitutional population.
- 2020 data exclude March 18 to May 9, 2020 (ATUS User’s Guide); 2025 data exclude September 30 to November 11, 2025 (BLS notice).
- Small groups (for example ages 20 to 24 in summer, or Black non-Hispanic people in summer) fall below the PC&S reliability floor and are suppressed in the tables.
Fifteen numbers that matter
- US: 1.00% of people 15+ swam or did other water sports on an average day in 2025, about 2.78 million people; the 2024 share was 1.28% and the change is not statistically significant (BLS ATUS microdata, PC&S tabulation).
- US, 2003 to 2025 (excluding 2020): July is the peak month at 4.25% of people 15+ on an average day; December is the low at 0.34% (BLS ATUS microdata, PC&S tabulation).
- US, 2021 to 2025: 64.6% of all water-sports participation days fell in June, July and August (BLS ATUS microdata, PC&S tabulation).
- US, 2015 to 2025 (excluding 2020): in the Northeast 68.1% of participation days fell in summer, against 54.1% in the West and 56.9% in the South (BLS ATUS microdata, PC&S tabulation).
- US, 2003 to 2025 (excluding 2020): participants aged 15 to 19 spent 126.6 minutes on a water-sports day and participants 75 and older spent 63.9 minutes (BLS ATUS microdata, PC&S tabulation).
- US, 2015 to 2025 (excluding 2020): White non-Hispanic people took part on 1.51% of days, Asian non-Hispanic 1.52%, Hispanic 0.89% and Black non-Hispanic 0.43% (BLS ATUS microdata, PC&S tabulation).
- US, 2015 to 2025 (excluding 2020): the West had the highest average-day share at 1.55%, against 1.29% in the Northeast, 1.17% in the Midwest and 1.16% in the South (BLS ATUS microdata, PC&S tabulation).
- US, 2015 to 2025 (excluding 2020): people living with a child under 18 took part on 1.58% of days against 1.09% for people without, a ratio of 1.4 (BLS ATUS microdata, PC&S tabulation).
- US, 2015 to 2025 (excluding 2020): the share on weekend days was 1.61% against 1.10% on weekdays, and weekend sessions averaged 126.4 minutes against 96.0 (BLS ATUS microdata, PC&S tabulation).
- US, 2015 to 2025 (excluding 2020): adults 25+ with an advanced degree took part on 1.89% of days and those with a high school diploma on 0.69% (BLS ATUS microdata, PC&S tabulation).
- US, 2021 to 2025 vs 2015 to 2019: the September-to-May share fell from 0.82% to 0.53% (35.4% lower), while the summer share moved from 3.13% to 2.98%, a change that is not significant (BLS ATUS microdata, PC&S tabulation).
- US, 2023: adults below 100% of the federal poverty level were less likely to have spent a day around a pool in six months (37.4%) than adults at 200% or more (56.7%) (NCHS Rapid Surveys System).
- US, 2024: 29.4 million people age 6+ swam for fitness at least once, according to SFIA’s 2025 Topline report as reproduced by the City of Wheat Ridge (SFIA via Wheat Ridge).
- US, 2023: SFIA counted 7,553 thousand CORE fitness swimmers (50+ times a year), 14.6% fewer than the 8,847 thousand in 2018 (SFIA 2024 Topline).
- US, 2025: USA Swimming had 286,526 year-round athlete members, 19.2% fewer than the 354,627 in 2017 (USA Swimming).
Rates, trends and severity we calculated
Summer day vs winter day
How much more common is swimming on a summer day than a winter day in the US?
Weighted share of diaries with code 130132 > 0 for June to August days and for December to February days; people = share x mean population 15+; seasonal concentration = summer participation days / all participation daysInputs: Fact rows #311, #314, #715; derived D02 (row #913), D03 (row #914), D05 (row #916)
Limitations: Winter estimate rests on 38 participants (SE 0.06 points). Population held at the 2021-2025 mean. Includes all water sports.
Participation by household income fifth
How does swimming participation change with family income?
Within each survey year, split the 16 CPS family-income brackets into weighted person fifths (brackets straddling a boundary are split proportionally), then compute the weighted participation share per fifth over pooled yearsInputs: Fact rows #679, #711, #681, #713; derived D10 (row #921), D11 (row #922)
Limitations: Income is categorical, nominal and recorded in the CPS months before the diary; imputed for some households. Fifths are of persons 15+, not households.
Trend 2003 to 2025 and where the decline sits
Is swimming participation declining, and in which part of the year?
Pooled five-year shares; percent change = (later - earlier) / earlier; replicate-weight SE of each differenceInputs: Fact rows #248, #293, #308, #723, #724, #908; derived D06 (row #917), D07 (row #918), D08 (row #919), D09 (row #920)
Limitations: Single years are noisy (SE 0.1 to 0.2 points); 2020 excluded from pools; 2013 and 2025 have shutdown gaps. The diary cannot say whether the decline is indoor pools, lessons or open water.
Minutes per swimmer by age
How long do people of different ages swim on the days they swim?
sum(weight x minutes) / sum(weight x participant) by age group, pooled 2003 to 2025 excluding 2020Inputs: Fact rows #725, #727, #731, #739; derived D18 (row #930)
Limitations: Minutes include all water sports (a beach or lake day counts the same way as a lap session); travel and changing time are coded separately.
Daily diaries vs annual surveys
Do the time-diary numbers agree with industry participation counts?
ATUS annual person-days = share x (sum of weights / days) x days; compare with SFIA total occasions; compare SFIA annual participants with ATUS people per summer dayInputs: Fact rows #871, #65, #72; derived D17 (row #928), D38 (row #963)
Limitations: Different age floors, definitions (all water sports vs fitness swimming) and methods (time diary vs online recall panel).
Regional summer concentration
Where is swimming most concentrated in the summer months?
Weighted participation days in June to August / all weighted participation days, by Census region, pooled 2015 to 2025 excluding 2020Inputs: Fact rows #718, #719, #720, #721
Limitations: Regional SEs are 3.3 to 4.2 points; Census regions mix climates (the South includes Florida and Maryland).
New in this edition
- NFHS published its 2025-26 High School Athletics Participation Survey: swimming and diving fell to 246,116 participants (NFHS 2025-26) from 257,405 in 2024-25 (NFHS 2024-25).
- BLS released 2025 American Time Use Survey results and the 2003-2025 multi-year microdata on June 25, 2026 (BLS news release). This report adds 2025: 1.00% of Americans 15+ took part on an average day (BLS ATUS microdata, PC&S tabulation).
- BLS documented that no ATUS diaries exist for September 30 to November 11, 2025 because of the federal shutdown (BLS notice). Summer 2025 estimates are unaffected.
- SFIA’s 2026 Topline Participation Report counted 250 million Americans active in at least one sport or fitness activity in 2025; its public release does not give a swimming figure (SFIA release).
What people ask
How many people swim in the US?
It depends on the time window. On an average day in 2021 to 2025, about 3.1 million Americans 15+ (1.13%) swam or did other water sports (BLS ATUS microdata, PC&S tabulation). Over a year, SFIA counted 29.4 million people 6+ who swam for fitness at least once in 2024 (SFIA via Wheat Ridge), and 51.2% of adults spent time around a pool in the six months to late 2023 (CDC MMWR).
What age group swims the most?
Teens 15 to 19: 2.70% swam or did water sports on an average day in 2015 to 2025 (excluding 2020), and 6.42% on summer days (BLS ATUS microdata, PC&S tabulation). Adults 35 to 44 come second at 1.51%. Among adults, the CDC found 59.0% of 18 to 29 year olds spent time at a pool in six months in 2023, against 37.9% of people 65+ (CDC MMWR).
Is swimming popular in America?
Swimming for fitness drew 29.4 million participants age 6+ in 2024 (SFIA via Wheat Ridge), and 23.0% of adults spent 7 or more days at a pool in the six months to October to November 2023 (CDC MMWR). On any single day, though, only 1.13% of people 15+ swim or do water sports (2021 to 2025) (BLS ATUS microdata, PC&S tabulation).
How often do Americans swim?
Across all people 15+, the 2021 to 2025 average-day share implies 4.1 water-sports days per person per year (PC&S calculation from BLS ATUS microdata, PC&S tabulation). Among SFIA fitness swimmers, the mean was 36 days in 2023, and 73.2% swam 1 to 49 times (SFIA 2024 Topline). Sessions last 108.5 minutes on average (BLS ATUS microdata, PC&S tabulation).
Is swimming participation declining?
On the federal time-diary measure, yes: the US average-day share fell from 1.41% in 2015 to 2019 to 1.13% in 2021 to 2025, a statistically significant 19.9% drop, concentrated in September to May (BLS ATUS microdata, PC&S tabulation). High school swimming and diving fell 21.8% from 2017-18 to 2025-26 (NFHS). SFIA’s count of people who swam for fitness at least once was flat between 2019 and 2023 (SFIA 2024 Topline).
Common questions
What share of Americans swim on a typical day?
1.13% of people age 15 and older swam or did other water sports on an average day in 2021 to 2025, according to a PC&S tabulation of BLS time diaries (BLS ATUS microdata, PC&S tabulation).
How long do Americans swim when they swim?
Participants averaged 108.5 minutes on the days they swam or did water sports in 2021 to 2025, about 1.81 hours (BLS ATUS microdata, PC&S tabulation).
Which month has the most swimmers in the US?
July. Pooling 2003 to 2025 (excluding 2020), 4.25% of people 15+ swam or did water sports on an average July day, against 0.34% in December (BLS ATUS microdata, PC&S tabulation).
Do men or women swim more?
They are about equal. In 2015 to 2025 (excluding 2020), 1.23% of men and 1.30% of women took part on an average day; the 2021-2025 difference of 0.08 points is not statistically significant (BLS ATUS microdata, PC&S tabulation).
Does income affect how often people swim?
Yes. In 2015 to 2025 (excluding 2020), the highest family-income fifth took part on 1.92% of days and the lowest fifth on 0.70% (BLS ATUS microdata, PC&S tabulation). In 2023, 56.7% of adults at 200%+ of the poverty level spent time around a pool in six months, against 37.4% below the poverty level (NCHS Rapid Surveys System).
Which US region swims the most?
The West has the highest year-round share, 1.55% on an average day in 2015 to 2025 (excluding 2020); the Northeast leads on summer days at 3.57% (BLS ATUS microdata, PC&S tabulation).
How many high school students swim competitively?
246,116 students took part in high school swimming and diving in 2025-26: 115,316 boys and 130,800 girls (NFHS 2025-26).
How many people belong to USA Swimming?
USA Swimming had 375,416 individual members in its 2025 membership year, including 286,526 year-round athlete members; 53.4% of athletes were female and the average athlete age was 12.5 (USA Swimming 2025 report).
Did swimming drop after the pandemic?
Off-season swimming did. Between 2015-2019 and 2021-2025 the September-to-May share fell from 0.82% to 0.53%, while the summer share held at 2.98% against 3.13% before (BLS ATUS microdata, PC&S tabulation).
Does the ATUS count only swimming?
No. ATUS code 130132 covers swimming plus water polo, diving, waterskiing, snorkeling, scuba diving, surfing, river tubing and water aerobics (ATUS 2025 lexicon). Boating and fishing are separate codes.
Method and data notes
- Downloaded the BLS ATUS 2003-2025 multi-year Activity Summary, Respondent, ATUS-CPS and replicate-weight files (released June 25, 2026) and kept a respondent-level extract in raw/atus_extract.csv.gz.
- Defined a participant as a respondent with more than 0 minutes of activity code 130132 (water sports, including swimming) on the diary day.
- Weighted with TUFNWGTP for all years except 2020 (TU20FWGT), following the ATUS User’s Guide; computed standard errors with the 160 BLS replicate weights (variance = 4/160 x sum of squared deviations).
- Validated the weighting by reproducing BLS Table 1 for 2025: 23.4% of people 15+ in sports, exercise and recreation on an average day, 1.47 hours per participant, 0.34 hours per person.
- Pooled years for stable group estimates: 2021-2025 for the latest headline, 2015-2025 excluding 2020 for demographic groups, 2003-2025 excluding 2020 for months and minutes by age.
- Built family-income fifths within each survey year from the 16 CPS family income brackets, splitting brackets that straddle a fifth boundary in proportion to weighted overlap.
- Applied PC&S reliability rules: suppress shares below 30 participants or 300 respondents; suppress minutes below 50 participants; flag coefficients of variation above 30%.
- Cross-checked against CDC/NCHS 2023 pool-time estimates, SFIA Topline counts, NSGA 2009 (via Census), NFHS 2009-10 to 2025-26 surveys and the USA Swimming 2025 report.
- Compared the report with the top Google results for ‘swimming participation statistics’ and ‘how many people swim in the us’ (raw/serp, raw/pages_to_beat).
Included: Federal microdata and federal survey releases (BLS, CDC/NCHS, Census) as Tier 1; trade association and governing-body counts with published methods (SFIA, NFHS, USA Swimming, NSGA, PAC) as Tier 2, headline figures only.
Excluded: The National Health Interview Survey was checked and not used: its 2024 adult physical activity questions ask about intensity and frequency and name no activities, including swimming (NHIS 2024 adult codebook). Also excluded: UK figures (Sport England, Statista England series), unsourced blog statistics, paywalled market research tables, and a peer-reviewed beachgoer study whose full text could not be opened (see excluded.md).
Conflicting numbers: Estimates are kept side by side with their definitions (average day, six months, at least once a year, six or more days a year) instead of being averaged. Where SFIA editions differ (28,173 thousand for 2023 vs 29.4 million for 2024), each is cited with its year and edition.
Derived metrics: Derived metrics (people counts, ratios, percent changes, person-days, hours, school shares) are in derived.csv with formulas and input rows; ATUS tabulations are reproducible with scripts/extract_atus.py, analyze_atus.py and analyze_extra.py.
Caveats
- ATUS cannot separate swimming from other water sports (code 130132).
- ATUS covers people 15+; children’s swimming is only reflected in NFHS and USA Swimming counts.
- Average-day participation is not the same as annual participation; most people who swim in a year are not swimming on a given day.
- Small groups require pooling across up to ten years, which blurs recent change.
- 2020 (collection suspended March 18 to May 9; the usual weight is missing for 2020, per the ATUS interview data dictionary) and 2025 (no diaries September 30 to November 11) have gaps; BLS says the 2025 effect cannot be quantified.
- SFIA and NSGA reports are paid; only headline figures from public copies are used, and the SFIA 2024 figure comes from a city planning document that reproduces SFIA’s table.
Method last reviewed October 8, 2026.
For reporters and researchers
Quotable statistics
- On an average day in 2021 to 2025, 1.13% of Americans age 15 and older, about 3.1 million people, swam or did other water sports (PC&S tabulation of BLS ATUS microdata). (U.S. Bureau of Labor Statistics)
- On an average US summer day in 2021 to 2025, about 8.1 million people age 15+ swam or did other water sports, against about 0.8 million on an average winter day. (U.S. Bureau of Labor Statistics)
- In 2015 to 2025, Americans in the highest family-income fifth swam or did water sports on 1.92% of days, 2.7 times the 0.70% in the lowest fifth. (U.S. Bureau of Labor Statistics)
- US participation in swimming and water sports from September to May fell 35.4% between 2015-2019 and 2021-2025, while summer participation held near 3%. (U.S. Bureau of Labor Statistics)
- US teens 15 to 19 spent 126.6 minutes on a swimming or water-sports day in 2003 to 2025; people 75 and older spent 63.9 minutes. (U.S. Bureau of Labor Statistics)
- High school swimming and diving participation fell 21.8% from 314,529 in 2017-18 to 246,116 in 2025-26, while all high school sports grew 5.4% (NFHS). (National Federation of State High School Associations)
- 51.2% of US adults spent at least one day in or around a swimming pool in the six months to October to November 2023 (CDC). (Centers for Disease Control and Prevention)
Best-sourced figures
- American Time Use Survey 2003-2025 multi-year microdata files, U.S. Bureau of Labor Statistics
- Vital Signs: Drowning Death Rates, Self-Reported Swimming Skill, Swimming Lesson Participation, and Recreational Water Exposure, MMWR 73(20), Centers for Disease Control and Prevention
- NCHS Rapid Surveys System, Round 2 dashboard data (p89x-xx88), National Center for Health Statistics
- High School Athletics Participation Survey 2025-26, National Federation of State High School Associations
- 2024 Topline Participation Report (copy hosted by USTA Colorado), Sports & Fitness Industry Association
150-word brief
A new Pool Construction & Service analysis of 258,954 federal time diaries finds that 1.13% of Americans age 15 and older, about 3.1 million people, swam or did other water sports on an average day in 2021 to 2025, for 108.5 minutes on average. The share reaches 2.98% on summer days, about 8.1 million people, and falls to 0.30% in winter. Participation is 20.4% lower than in 2003 to 2007. The drop since 2015 to 2019 is concentrated outside summer: September-to-May participation fell 35.4%, while summer held steady. People in the highest family-income fifth take part 2.7 times as often as those in the lowest. Teens 15 to 19 have the highest share, 2.70%. Cross-checks agree on direction: high school swimming and diving fell 21.8% from 2017-18 to 2025-26, and USA Swimming athlete membership is 19.2% below 2017. Data: BLS ATUS microdata, CDC, SFIA, NFHS.
Possible headlines
- About 3.1 Million Americans Swim or Do Water Sports on an Average Day, Federal Time Diaries Show
- Summer Days Bring 9.9 Times as Many Swimmers as Winter Days in the US
- Highest-Income Americans Swim 2.7 Times as Often as the Lowest-Income Fifth
- Off-Season Swimming Fell 35.4% After the Pandemic While Summer Held Steady
- High School Swimming Is Down 21.8% From Its 2017-18 Peak as School Sports Hit a Record
Citation
Pool Construction & Service. "Swimming Participation Statistics: Who Swims in the US, How Often and for How Long, 2003 to 2025." PC&S Research Desk, October 8, 2026. https://poolconstructionandservice.com/research/swimming-participation-statistics/
License
The data tables and charts in this report are licensed under CC BY 4.0. Reuse them with this attribution: “Source: Pool Construction & Service (poolconstructionandservice.com), Swimming Participation Statistics: Who Swims in the US, How Often and for How Long, 2003 to 2025.” Figures from third-party sources remain subject to their publishers’ terms.
Datasets
- Swimming and water-sports participation by demographic group, US, 2015 to 2025 (excluding 2020) CSV
- Swimming and water-sports participation by year, US, 2003 to 2025 CSV
- Swimming and water-sports participation by month, US, 2003 to 2025 CSV
- Swimming and water-sports participation by family income fifth, US, 2015 to 2025 CSV
- How many Americans swim, by measure and source, 2009 to 2026 CSV
- High school swimming and diving participants, US, 2009-10 to 2025-26 CSV
- Full fact sheet with sources and limitations CSV
Evidence tiers
Tier 1: primary and government sources (14)
- U.S. Bureau of Labor Statistics: American Time Use Survey 2003-2025 multi-year microdata files
- U.S. Bureau of Labor Statistics: ATUS 2025 Coding Lexicon (with examples)
- U.S. Bureau of Labor Statistics: American Time Use Survey User's Guide (September 2026)
- U.S. Bureau of Labor Statistics: Federal Government Shutdown: 2025 American Time Use Survey
- U.S. Bureau of Labor Statistics: American Time Use Survey 2025 Results, Table 1
- Centers for Disease Control and Prevention: Vital Signs: Drowning Death Rates, Self-Reported Swimming Skill, Swimming Lesson Participation, and Recreational Water Exposure, MMWR 73(20)
- National Center for Health Statistics: NCHS Rapid Surveys System, Round 2 dashboard data (p89x-xx88)
- U.S. Census Bureau (data: National Sporting Goods Association): Statistical Abstract of the United States 2012, Table 1249: Participation in Selected Sports Activities, 2009
- National Center for Health Statistics: NCHS Rapid Surveys System Round 2: Swimming
- U.S. Bureau of Labor Statistics: American Time Use Survey Summary, 2025 results (USDL-26-1022)
- U.S. Bureau of Labor Statistics: ATUS 2003 Coding Lexicon (with examples)
- U.S. Bureau of Labor Statistics: ATUS 2003-2025 ATUS-CPS Data Dictionary
- U.S. Bureau of Labor Statistics: ATUS 2003-2025 Interview Data Dictionary
- National Center for Health Statistics: National Health Interview Survey 2024 Adult Codebook
Tier 2: trade bodies, public companies, market research (10)
- National Federation of State High School Associations: High School Athletics Participation Survey 2025-26
- National Federation of State High School Associations: High School Athletics Participation Survey 2017-18
- Sports & Fitness Industry Association: 2024 Topline Participation Report (copy hosted by USTA Colorado)
- City of Wheat Ridge, Colorado / SFIA: Wheat Ridge Parks and Recreation Pathway, Appendix F Trends Analysis (reproduces SFIA 2025 Topline)
- Sports & Fitness Industry Association: SFIA Releases the 2026 Topline Participation Report
- Sports & Fitness Industry Association: SFIA Releases First Edition of Mid-Year Participation Report
- USA Swimming: 2025 Membership Demographics Report
- National Sporting Goods Association: Sports Participation in the U.S., 2026 Edition (sample pages)
- National Federation of State High School Associations: High School Athletics Participation Survey 2024-25
- National Federation of State High School Associations: High School Participation Survey Archive
References
- U.S. Bureau of Labor Statistics. American Time Use Survey 2003-2025 multi-year microdata files. Accessed 2026-10-08.
- U.S. Bureau of Labor Statistics. ATUS 2025 Coding Lexicon (with examples). Accessed 2026-10-08.
- U.S. Bureau of Labor Statistics. American Time Use Survey User's Guide (September 2026). Accessed 2026-10-08.
- U.S. Bureau of Labor Statistics. Federal Government Shutdown: 2025 American Time Use Survey. Accessed 2026-10-08.
- U.S. Bureau of Labor Statistics. American Time Use Survey 2025 Results, Table 1. Accessed 2026-10-08.
- Centers for Disease Control and Prevention. Vital Signs: Drowning Death Rates, Self-Reported Swimming Skill, Swimming Lesson Participation, and Recreational Water Exposure, MMWR 73(20). Accessed 2026-10-08.
- National Center for Health Statistics. NCHS Rapid Surveys System, Round 2 dashboard data (p89x-xx88). Accessed 2026-10-08.
- U.S. Census Bureau (data: National Sporting Goods Association). Statistical Abstract of the United States 2012, Table 1249: Participation in Selected Sports Activities, 2009. Accessed 2026-10-08.
- National Federation of State High School Associations. High School Athletics Participation Survey 2025-26. Accessed 2026-10-08.
- National Federation of State High School Associations. High School Athletics Participation Survey 2017-18. Accessed 2026-10-08.
- Sports & Fitness Industry Association. 2024 Topline Participation Report (copy hosted by USTA Colorado). Accessed 2026-10-08.
- City of Wheat Ridge, Colorado / SFIA. Wheat Ridge Parks and Recreation Pathway, Appendix F Trends Analysis (reproduces SFIA 2025 Topline). Accessed 2026-10-08.
- Sports & Fitness Industry Association. SFIA Releases the 2026 Topline Participation Report. Accessed 2026-10-08.
- Sports & Fitness Industry Association. SFIA Releases First Edition of Mid-Year Participation Report. Accessed 2026-10-08.
- USA Swimming. 2025 Membership Demographics Report. Accessed 2026-10-08.
- National Sporting Goods Association. Sports Participation in the U.S., 2026 Edition (sample pages). Accessed 2026-10-08.
- National Center for Health Statistics. NCHS Rapid Surveys System Round 2: Swimming. Accessed 2026-10-08.
- U.S. Bureau of Labor Statistics. American Time Use Survey Summary, 2025 results (USDL-26-1022). Accessed 2026-10-08.
- National Federation of State High School Associations. High School Athletics Participation Survey 2024-25. Accessed 2026-10-08.
- National Federation of State High School Associations. High School Participation Survey Archive. Accessed 2026-10-08.
- U.S. Bureau of Labor Statistics. ATUS 2003 Coding Lexicon (with examples). Accessed 2026-10-08.
- U.S. Bureau of Labor Statistics. ATUS 2003-2025 ATUS-CPS Data Dictionary. Accessed 2026-10-08.
- U.S. Bureau of Labor Statistics. ATUS 2003-2025 Interview Data Dictionary. Accessed 2026-10-08.
- National Center for Health Statistics. National Health Interview Survey 2024 Adult Codebook. Accessed 2026-10-08.
Related pool research
Public Pools by City: Pools per Resident in 99 Large US Cities, 2026
Public Pool Inspection Violations: Closure Rates and Most Common Citations in Six US Jurisdictions, 2019 to 2026
Pool Operator Certification Requirements by State: 2026 Matrix of Operator, Lifeguard and Inspection Rules
Public Pool Admission Prices in 33 Large US Cities, 2026

Vacation Rentals With Pools: Share and Nightly Premium in 18 US Airbnb Markets (2026)

Pool Industry Market Size: US Revenue Estimates Reconciled, 2017 to 2026
All pool industry research (40 reports)